Home / Thu 23 May 2024 Market Recap
23 May 2024: Nifty 50 Surges (+1.55%) Closes at ₹22,950.19. Adani Enterprises Leads! GRASIM Dips, Macrotech Developers Shine!
Show Table of Contents
Table of Contents
- 1: Top Indices Performance Overview
- 2: Nifty 50 Performance Overview
- 2.1: Nifty 50 Top Gainers
- 2.2: Nifty 50 Top Losers
- 2.3: Nifty 50 Stocks To Watch for Tomorrow
- 2.3.1: ➲ Adani Enterprises (Bullish Pattern)
- 2.3.2: ➲ GRASIM (Bearish Trend)
- 3: Nifty 500 Performance Overview
- 3.1: Nifty 500 Top Gainers
- 3.2: Nifty 500 Top Losers
- 3.3: Nifty 51 to 500 Stocks To Watch for Tomorrow
- 3.3.1: ➲ Macrotech Developers (Bullish Pattern)
- 3.3.2: ➲ Brightcom Group (Bearish Pattern)
- 4: Top Stocks That Created a New All Time High Today
- 4.1: Top Large Cap Stocks That Created a New All Time High Today
- 4.2: Top Mid Cap Stocks That Created a New All Time High Today
- 4.3: Top Small Cap Stocks That Created a New All Time High Today
Top Indices Performance Overview
| Stock | Close | Range |
|---|---|---|
| NIFTY 50 | ₹22,950.19 (1.55%) | ₹22,580.34 – ₹22,992.69 |
| NIFTY BANK | ₹48,737.05 (1.99%) | ₹47,875.89 – ₹48,828.05 |
| NIFTY FIN SERVICE | ₹21,716.15 (1.82%) | ₹21,355.09 – ₹21,758.75 |
| NIFTY IT | ₹34,043.1 (1.27%) | ₹33,618.5 – ₹34,097.75 |
| NIFTY AUTO | ₹23,849.34 (2.25%) | ₹23,253.9 – ₹23,873.5 |
| NIFTY ENERGY | ₹41,510.25 (0.43%) | ₹41,089.39 – ₹41,624.05 |
Nifty 50 Performance Overview
The Nifty 50 commenced trading at ₹22,604.15. Throughout the session, it fluctuated between a low of ₹22,580.34 and a high of ₹22,992.69. The index eventually closed at ₹22,950.19, marking a (+1.55%) gain.
The table below lists the top gainers and losers that shaped the Nifty 50’s movement today.
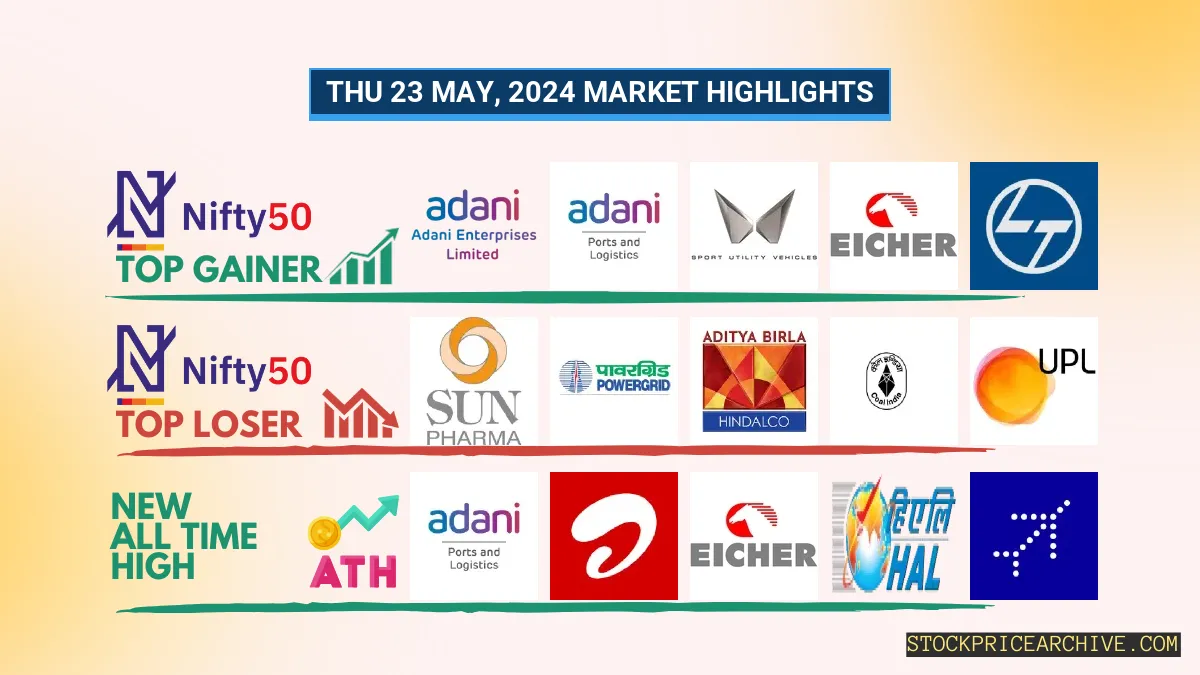
Nifty 50 Top Gainers
| Stock | Close | Range |
|---|---|---|
| Adani Enterprises | ₹3400 (8.24%) | ₹3,135.55 – ₹3405 |
| Adani Ports | ₹1445 (4.84%) | ₹1,369.9 – ₹1,448.65 |
| Mahindra & Mahindra | ₹2611 (3.56%) | ₹2,500.6 – ₹2,616.94 |
| Eicher Motors | ₹4,854.85 (3.39%) | ₹4684 – ₹4,866.79 |
| Larsen Toubro | ₹3578 (3.38%) | ₹3,460.14 – ₹3,600.75 |
Nifty 50 Top Losers
| Stock | Close | Range |
|---|---|---|
| Sun Pharma | ₹1,497.55 (-2.72%) | ₹1,467.55 – ₹1,503.55 |
| Power Grid | ₹319 (-2.08%) | ₹309 – ₹320.64 |
| Hindalco | ₹676.04 (-1.25%) | ₹666.15 – ₹678.54 |
| Coal India | ₹496.6 (-1.02%) | ₹492.1 – ₹503.64 |
| UPL | ₹510.95 (-0.9%) | ₹507.2 – ₹517.15 |
Nifty 50 Stocks To Watch for Tomorrow
➲ Adani Enterprises (Bullish Pattern)
- Performance Overview: Over the past 25 trading sessions, Adani Enterprises has closed in green 15 times and in red 10 times.
- Recent Trend: Adani Enterprises has been on a 5-day green streak, with no red closing since Thursday, May 16th, 2024.
- Returns: Adani Enterprises delivered 8.79% returns in the last 25 trading sessions, indicating that an investment of ₹10,000 would’ve grown to ₹10,879.
- Financial Performance: In the past 12 months, Adani Enterprises reported revenue of ₹96,420.98 Crore and a profit of ₹3,239.54 Crore.
- As of Thursday, May 23rd, 2024, Adani Enterprises had a Market Capital of ₹3,48,896.99 Crore.
- Summary: Adani Enterprises exhibits a strong bullish pattern, presenting potential growth opportunities for investors. For more insights, consider exploring: Adani Enterprises Target for Tomorrow and Adani Enterprises Targets for 2024 & 2025.
Adani Enterprises Financial Performance
| Metric | Value | Description |
|---|---|---|
| Market Capital | 3,48,896.99 Crore | Market valuation of Adani Enterprises’s shares. |
| Revenue (TTM) | 96,420.98 Crore | Total revenue generated by Adani Enterprises over the past twelve months. |
| Net Income (TTM) | +3,239.54 Crore | Net Profit or Loss after all the expenses over the past twelve months. |
| Operating Margin | 8.76% | Income from operations as a percentage of revenue, before taxes and interest. |
| Profit Margin | 3.36% | Net income as a percentage of revenue, after all expenses. |
| Revenue Growth (Quarterly) | -6.9% | Change in revenue compared to the previous quarter. |
| Earnings Growth (YOY Quarterly) | -37.6% | Change in earnings compared to the same quarter last year. |
| Debt-to-Equity (D/E) Ratio | 147.8 | Company’s total debt divided by total shareholder equity. |
| Total Debt | 65,310.14 Crore | Sum of Adani Enterprises’s current & long-term financial obligations. |
| Total Cash | 8,522.96 Crore | Total amount of liquid funds available to Adani Enterprises. |
| Beta | 0.84 | Beta is less than 1 indicating that the Adani Enterprises’s price is less volatile than the market. |
➲ GRASIM (Bearish Trend)
- Market Recap: Over the past 25 trading sessions, GRASIM has experienced a mixed performance, closing in the red 11 times and in the green 14 times.
- Current Standing: As of today, Thu 23 May 2024, GRASIM has been on a 2-day losing streak, without a single day of gains since Tuesday, May 21, 2024.
- Earnings: In the past 12 months, GRASIM has witnessed positive financial performance, with a revenue of ₹1,26,713.48 Crore and net profit of ₹5,623.59 Crore.
- Market Cap: As of Thu 23 May 2024, GRASIM holds a Market Cap of ₹1,64,427.43 Crore.
- Investment Growth: In the past 25 trading sessions, GRASIM has shown moderate growth, delivering returns of 8.46%. This means an initial investment of ₹10,000 would have grown to ₹10,846.
- Outlook: GRASIM is currently experiencing a bearish trend, marked by recent losses. Investors are advised to monitor the stock closely, particularly with regard to GRASIM Target for Tomorrow and GRASIM Targets for 2024 & 2025.
GRASIM Financial Performance
| Metric | Value | Description |
|---|---|---|
| Market Capital | 1,64,427.43 Crore | Market valuation of GRASIM’s shares. |
| Revenue (TTM) | 1,26,713.48 Crore | Total revenue generated by GRASIM over the past twelve months. |
| Net Income (TTM) | +5,623.59 Crore | Net Profit or Loss after all the expenses over the past twelve months. |
| Operating Margin | 17.67% | Income from operations as a percentage of revenue, before taxes and interest. |
| Profit Margin | 4.43% | Net income as a percentage of revenue, after all expenses. |
| Revenue Growth (Quarterly) | +11.6% | Change in revenue compared to the previous quarter. |
| Earnings Growth (YOY Quarterly) | -39.81% | Change in earnings compared to the same quarter last year. |
| Debt-to-Equity (D/E) Ratio | 93.15 | Company’s total debt divided by total shareholder equity. |
| Total Debt | 1,21,928.06 Crore | Sum of GRASIM’s current & long-term financial obligations. |
| Total Cash | 18,566.27 Crore | Total amount of liquid funds available to GRASIM. |
| Beta | 0.54 | Beta is less than 1 indicating that the GRASIM’s price is less volatile than the market. |
Nifty 500 Performance Overview
The Nifty 500 stock market index opened on Monday, June 27, 2023, at a price of ₹21,275.44. Throughout the trading day, the index experienced fluctuations, reaching a low of ₹21,249.55 and a high of ₹21,504.94. Finally, the index closed at ₹21,479.65, a 1.13% increase from its opening price.Nifty 500 Top Gainers
| Stock | Close | Range |
|---|---|---|
| Cochin Shipyard | ₹1900 (16.32%) | ₹1,667.69 – ₹1935 |
| Saregama India | ₹468.6 (14.05%) | ₹404.1 – ₹470.5 |
| UNO Minda | ₹854 (12.7%) | ₹753.29 – ₹880 |
| Rail Vikas Nigam | ₹373 (9.25%) | ₹341.79 – ₹374.29 |
| Mazagoan Dock Shipbuilders | ₹3,123.44 (8.5%) | ₹2916 – ₹3,207.75 |
Nifty 500 Top Losers
| Stock | Close | Range |
|---|---|---|
| H.E.G. | ₹2264 (-15.75%) | ₹2,190.6 – ₹2,571.64 |
| Teamlease Services | ₹3177 (-10.11%) | ₹3,155.14 – ₹3525 |
| GMM Pfaudler | ₹1,323.9 (-5.86%) | ₹1,320.05 – ₹1,377.19 |
| Deepak Nitrite | ₹2334 (-5.26%) | ₹2,328.8 – ₹2459 |
| Lupin | ₹1,632.65 (-4.85%) | ₹1,591.44 – ₹1698 |
Nifty 51 to 500 Stocks To Watch for Tomorrow
➲ Macrotech Developers (Bullish Pattern)
- Performance Overview: In the past 25 trading sessions, Macrotech Developers has closed in green 18 times and in red 7 times.
- Recent Trend: Macrotech Developers has been on a 11-day green streak, without a single day closing in red since Wed 08 May 2024.
- Returns: Macrotech Developers gave a 15.23% returns in the last 25 trading sessions, that means your investment of ₹10,000 would have become ₹11,522.99
- Financial Insight: Over the past 12 months, Macrotech Developers has generated a revenue of ₹10,316.1 Crore and created a profit of ₹1,549.1 Crore.
- As of Thu 23 May 2024, Macrotech Developers has a Market Capital of ₹1,19,340.08 Crore.
- Summary: Macrotech Developers exhibits a robust bullish pattern. Investors should keep a watch on the price for growth opportunities in the short and long term: Checkout Macrotech Developers Target for Tomorrow and Macrotech Developers Targets for 2024 & 2025.
Macrotech Developers Financial Performance
| Metric | Value | Description |
|---|---|---|
| Market Capital | 1,19,340.08 Crore | Market valuation of Macrotech Developers’s shares. |
| Revenue (TTM) | 10,316.1 Crore | Total revenue generated by Macrotech Developers over the past twelve months. |
| Net Income (TTM) | +1,549.1 Crore | Net Profit or Loss after all the expenses over the past twelve months. |
| Operating Margin | 23.13% | Income from operations as a percentage of revenue, before taxes and interest. |
| Profit Margin | 15.01% | Net income as a percentage of revenue, after all expenses. |
| Revenue Growth (Quarterly) | +23.4% | Change in revenue compared to the previous quarter. |
| Earnings Growth (YOY Quarterly) | -10.6% | Change in earnings compared to the same quarter last year. |
| Debt-to-Equity (D/E) Ratio | 43.9 | Company’s total debt divided by total shareholder equity. |
| Total Debt | 7,697.59 Crore | Sum of Macrotech Developers’s current & long-term financial obligations. |
| Total Cash | 4,642.19 Crore | Total amount of liquid funds available to Macrotech Developers. |
| Beta | 0.37 | Beta is less than 1 indicating that the Macrotech Developers’s price is less volatile than the market. |
➲ Brightcom Group (Bearish Pattern)
- Recent Performance: Over the past 25 trading sessions, Brightcom Group stock has experienced a string of losses, closing in red 17 times and in green just 5 times.
- Current Trend: For the past 7 days, Brightcom Group has been on a continuous losing streak, with no positive close since Tuesday, May 14, 2024.
- Returns: In the last 25 trading sessions, Brightcom Group shares have delivered negative returns of -39.34%. This means that an investment of INR 10,000 would have decreased to approximately INR 6,066.
- Financial Performance: Within the past 12 months, Brightcom Group reported revenue of INR 7,606.48 Crore and a profit of INR 1,415.23 Crore.
- As of Thursday, May 23, 2024, Brightcom Group has a market capitalization of INR 2,242.47 Crore.
- Summary: Brightcom Group is currently in a bearish phase. We recommend that investors monitor the situation closely, particularly with regard to Brightcom Group’s target price for tomorrow and Brightcom Group’s targets for 2024 and 2025.
Brightcom Group Financial Performance
| Metric | Value | Description |
|---|---|---|
| Market Capital | 2,242.47 Crore | Market valuation of Brightcom Group’s shares. |
| Revenue (TTM) | 7,606.48 Crore | Total revenue generated by Brightcom Group over the past twelve months. |
| Net Income (TTM) | +1,415.23 Crore | Net Profit or Loss after all the expenses over the past twelve months. |
| Operating Margin | 26.37% | Income from operations as a percentage of revenue, before taxes and interest. |
| Profit Margin | 18.6% | Net income as a percentage of revenue, after all expenses. |
| Revenue Growth (Quarterly) | +14.2% | Change in revenue compared to the previous quarter. |
| Earnings Growth (YOY Quarterly) | +16% | Change in earnings compared to the same quarter last year. |
| Total Cash | 1,411.72 Crore | Total amount of liquid funds available to Brightcom Group. |
| Beta | 0.95 | Beta is less than 1 indicating that the Brightcom Group’s price is less volatile than the market. |
Top Stocks That Created a New All Time High Today
Top Large Cap Stocks That Created a New All Time High Today
Companies with Market Capital more than 20,000 Crores| Stock | Close | New All-Time High (ATH) | Previous ATH | Previous ATH Date |
|---|---|---|---|---|
| Adani Ports | 1445.00 (+4.84%) | 1448.65 (+%) | Thu 01 Jan 1970 | |
| Adani Power | 710.79 (+2.79%) | 720.00 (+11.31%) | 646.84 | Thu 04 Apr 2024 |
| Ashok Leyland | 212.10 (+1.87%) | 213.70 (+%) | Thu 01 Jan 1970 | |
| Aurobindo Pharma | 1227.94 (+0.42%) | 1235.94 (+%) | Thu 01 Jan 1970 | |
| Bharti Airtel | 1375.25 (+2.02%) | 1377.30 (+1.94%) | 1351.00 | Tue 23 Apr 2024 |
Top Mid Cap Stocks That Created a New All Time High Today
Companies with Market Capital between 5,000 Crores to 20,000 Crores| Stock | Close | New All-Time High (ATH) | Previous ATH | Previous ATH Date |
|---|---|---|---|---|
| Ahluwalia Contracts | 1289.59 (+2.11%) | 1290.00 (+%) | Thu 01 Jan 1970 | |
| Ashoka Buildcon | 189.00 (+3.78%) | 197.20 (+%) | Thu 01 Jan 1970 | |
| Astra Microwave Products | 771.50 (-0.67%) | 793.90 (+10.23%) | 720.20 | Tue 23 Apr 2024 |
| Balmer Lawrie & | 309.54 (+1.55%) | 320.35 (+%) | Thu 01 Jan 1970 | |
| BEML | 4565.00 (+0.13%) | 4764.35 (+%) | Thu 01 Jan 1970 |
Top Small Cap Stocks That Created a New All Time High Today
Companies with Market Capital less than 5,000 Crores| Stock | Close | New All-Time High (ATH) | Previous ATH | Previous ATH Date |
|---|---|---|---|---|
| Ahmedabad Steelcraft | 57.79 (+4.99%) | 57.79 (+%) | Thu 01 Jan 1970 | |
| AMBO AGRITEC LIMITED | 70.00 (+4.99%) | 70.00 (+%) | Thu 01 Jan 1970 | |
| Ausom Enterprise | 121.90 (+4.09%) | 133.60 (+%) | Thu 01 Jan 1970 | |
| Balmer Lawrie Investments | 942.00 (+0.86%) | 962.95 (+%) | Thu 01 Jan 1970 | |
| BRADYM | 1079.34 (+9.99%) | 1079.34 (+%) | Thu 01 Jan 1970 |