Home / Fri 24 May 2024 Market Recap
24 May 2024: Nifty 50 closed at ₹22,950.05 (-0.08%), Aegis Logistics Soars to New Highs!
Show Table of Contents
Table of Contents
- 1: Top Indices Performance Overview
- 2: Nifty 50 Performance Overview
- 2.1: Nifty 50 Top Gainers
- 2.2: Nifty 50 Top Losers
- 2.3: Nifty 50 Stocks To Watch for Tomorrow
- 2.3.1: Divis Lab (Bullish Pattern)
- 2.3.2: ➲ Sun Pharma (Bearish Pattern)
- 3: Nifty 500 Performance Overview
- 3.1: Nifty 500 Top Gainers
- 3.2: Nifty 500 Top Losers
- 3.3: Nifty 51 to 500 Stocks To Watch for Tomorrow
- 3.3.1: ➲ Macrotech Developers (Bullish Pattern)
- 3.3.2: ➲ Galaxy Surfactants (Bearish Pattern)
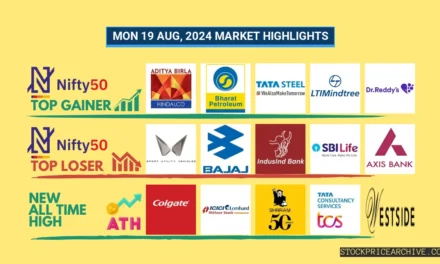
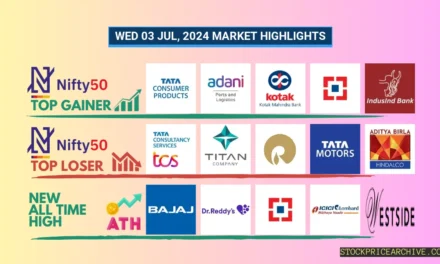
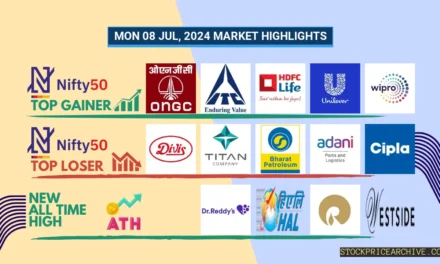
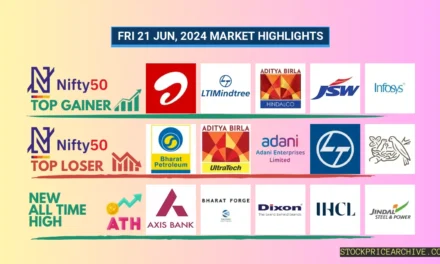
- 4: Top Stocks That Created a New All Time High Today
- 4.1: Top Large Cap Stocks That Created a New All Time High Today
- 4.2: Top Mid Cap Stocks That Created a New All Time High Today
- 4.3: Top Small Cap Stocks That Created a New All Time High Today
Top Indices Performance Overview
| Stock | Close | Range |
|---|---|---|
| NIFTY 50 | ₹22,950.05 (-0.08%) | ₹22,910.55 – ₹23,024.8 |
| NIFTY BANK | ₹48,948.89 (0.36%) | ₹48,644.8 – ₹49,050.89 |
| NIFTY FIN SERVICE | ₹21,847.44 (0.53%) | ₹21,673.9 – ₹21890 |
| NIFTY IT | ₹33,771.85 (-0.8%) | ₹33,763.14 – ₹34,087.8 |
| NIFTY AUTO | ₹23,867.84 (0.07%) | ₹23,692.34 – ₹24,038.3 |
| NIFTY ENERGY | ₹41,600.14 (0.09%) | ₹41,414.05 – ₹41,873.69 |
Nifty 50 Performance Overview
The Nifty 50 began trading at ₹22,925.94, fluctuating between ₹22,910.55 and ₹23,024.80. Closing at ₹22,950.05, the index experienced a modest (-0.08%) change.
Key stocks influencing the movement are presented in the table below:
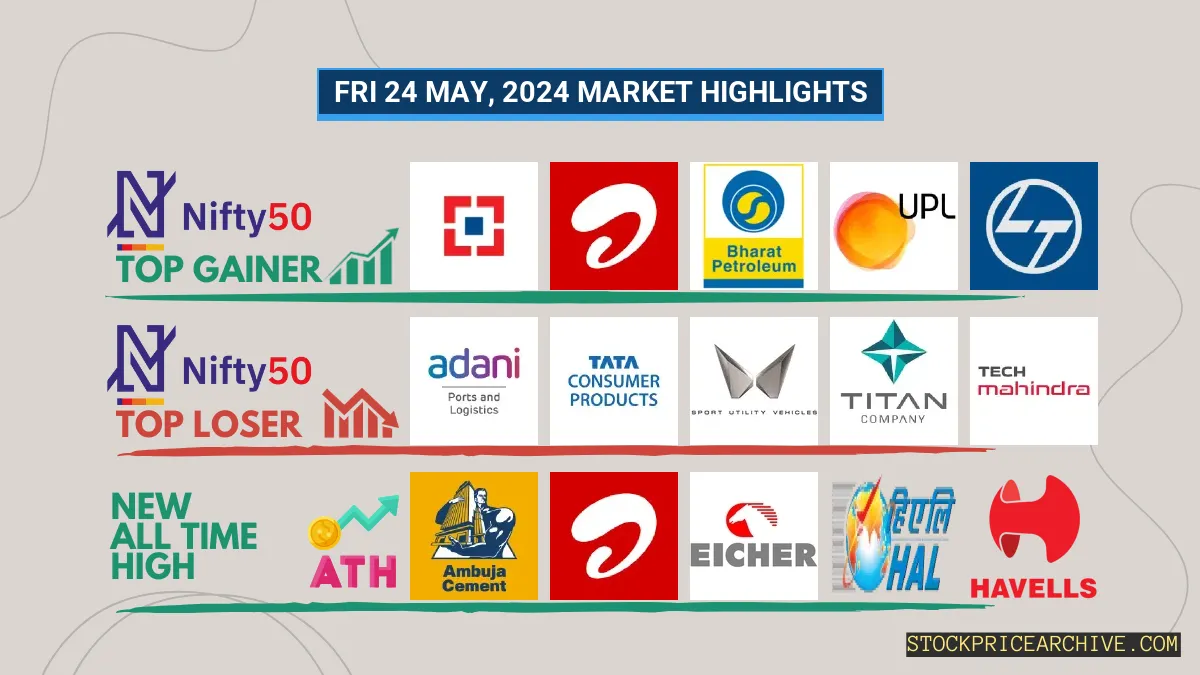
Nifty 50 Top Gainers
| Stock | Close | Range |
|---|---|---|
| HDFC BANK | ₹1,516.19 (1.58%) | ₹1,487.4 – ₹1,519.9 |
| Bharti Airtel | ₹1,389.5 (1.12%) | ₹1,375.59 – ₹1,397.69 |
| Bharat Petroleum | ₹654.7 (1.11%) | ₹641.59 – ₹663.29 |
| UPL | ₹516.5 (1.1%) | ₹513.45 – ₹521.95 |
| Larsen Toubro | ₹3624 (1.07%) | ₹3,586.5 – ₹3659 |
Nifty 50 Top Losers
| Stock | Close | Range |
|---|---|---|
| Adani Ports | ₹1,416.9 (-1.84%) | ₹1384 – ₹1,444.9 |
| Tata Consumer Products | ₹1,099.5 (-1.65%) | ₹1,096.05 – ₹1,109.69 |
| Mahindra & Mahindra | ₹2578 (-1.2%) | ₹2,572.39 – ₹2605 |
| TITAN | ₹3411 (-1.19%) | ₹3,404.39 – ₹3454 |
| Tech Mahindra | ₹1,321.75 (-1.18%) | ₹1318 – ₹1345 |
Nifty 50 Stocks To Watch for Tomorrow
Divis Lab (Bullish Pattern)
- Performance Overview: Recently, Divis Lab has had an impressive performance, closing in green 15 times out of the last 26 trading sessions, outperforming the market.
- Recent Trend: Divis Lab is on a 5-day green streak, showcasing consistent upwards momentum, without a single day closing in red since Fri 17 May 2024.
- Returns: Investors in Divis Lab have enjoyed an 8.84% return on their investment over the last 26 trading sessions. This means that an investment of ₹10,000 would have grown to ₹10,884.
- Financial Insight: Divis Lab’s financial performance has been strong, generating a revenue of ₹7,492.6 Crore and a profit of ₹1,383.37 Crore over the past 12 months.
- As of Fri 24 May 2024, Divis Lab holds a Market Capital of ₹1,03,818.28 Crore, reflecting its strong market presence.
- Summary: Divis Lab exhibits a robust bullish pattern and is a company to watch for potential growth. Investors may want to consider it for both short-term and long-term investment strategies. To gain further insights, explore our Divis Lab Target for Tomorrow and Divis Lab Targets for 2024 & 2025.
Divis Lab Financial Performance
| Metric | Value | Description |
|---|---|---|
| Market Capital | 1,03,818.28 Crore | Market valuation of Divis Lab’s shares. |
| Revenue (TTM) | 7,492.6 Crore | Total revenue generated by Divis Lab over the past twelve months. |
| Net Income (TTM) | +1,383.37 Crore | Net Profit or Loss after all the expenses over the past twelve months. |
| Operating Margin | 21.24% | Income from operations as a percentage of revenue, before taxes and interest. |
| Profit Margin | 18.46% | Net income as a percentage of revenue, after all expenses. |
| Revenue Growth (Quarterly) | +8.6% | Change in revenue compared to the previous quarter. |
| Earnings Growth (YOY Quarterly) | +16.7% | Change in earnings compared to the same quarter last year. |
| Debt-to-Equity (D/E) Ratio | 0.03 | Company’s total debt divided by total shareholder equity. |
| Total Debt | 5 Crore | Sum of Divis Lab’s current & long-term financial obligations. |
| Total Cash | 3,611 Crore | Total amount of liquid funds available to Divis Lab. |
| Beta | 0.38 | Beta is less than 1 indicating that the Divis Lab’s price is less volatile than the market. |
➲ Sun Pharma (Bearish Pattern)
- Performance Overview: In the past 26 trading sessions, Sun Pharma has closed lower 12 times and higher 14 times.
- Recent Trend: Sun Pharma has been on a 3-day red streak, without a single day closing higher since Tuesday, May 21, 2024.
- Returns: Sun Pharma has given a negative 3.76% return in the last 26 trading sessions, which means an investment of ₹10,000 would have become ₹9,624.
- Financial Insight: Over the past 12 months, Sun Pharma has generated revenue of ₹47,444.62 Crore and created a profit of ₹8,906.27 Crore.
- As of Friday, May 24, 2024, Sun Pharma has a Market Capital of ₹3,67,433.4 Crore.
- Summary: Sun Pharma is currently experiencing a bearish phase. We advise investors to keep a close watch, especially on Sun Pharma Target for Tomorrow and Sun Pharma Targets for 2024 & 2025.
Sun Pharma Financial Performance
| Metric | Value | Description |
|---|---|---|
| Market Capital | 3,67,433.4 Crore | Market valuation of Sun Pharma’s shares. |
| Revenue (TTM) | 47,444.62 Crore | Total revenue generated by Sun Pharma over the past twelve months. |
| Net Income (TTM) | +8,906.27 Crore | Net Profit or Loss after all the expenses over the past twelve months. |
| Operating Margin | 22.05% | Income from operations as a percentage of revenue, before taxes and interest. |
| Profit Margin | 18.77% | Net income as a percentage of revenue, after all expenses. |
| Revenue Growth (Quarterly) | +10.1% | Change in revenue compared to the previous quarter. |
| Earnings Growth (YOY Quarterly) | +16.5% | Change in earnings compared to the same quarter last year. |
| Debt-to-Equity (D/E) Ratio | 3.05 | Company’s total debt divided by total shareholder equity. |
| Total Debt | 1,928.23 Crore | Sum of Sun Pharma’s current & long-term financial obligations. |
| Total Cash | 14,833.24 Crore | Total amount of liquid funds available to Sun Pharma. |
| Beta | 0.52 | Beta is less than 1 indicating that the Sun Pharma’s price is less volatile than the market. |
Nifty 500 Performance Overview
The Nifty 500 opened the day at ₹21,483 and experienced fluctuations, hitting a low of ₹21,445.25 and a high of ₹21,567.3, before finally settling at a close of ₹21,476.05 (-0.07%).
Nifty 500 Top Gainers
| Stock | Close | Range |
|---|---|---|
| Aegis Logistics | ₹721.59 (14.52%) | ₹618.5 – ₹747 |
| Finolex Cables | ₹1277 (11.62%) | ₹1,169.58 – ₹1,361.94 |
| ARE&M | ₹1,224.25 (9.87%) | ₹1,115.9 – ₹1238 |
| Vodafone Idea | ₹15.1 (7.47%) | ₹14.25 – ₹15.65 |
| RattanIndia Enterprises | ₹81.95 (7.4%) | ₹76.4 – ₹83.9 |
Nifty 500 Top Losers
| Stock | Close | Range |
|---|---|---|
| Bharat Dynamics | ₹1,549.05 (-44.89%) | ₹1,464.75 – ₹1,647.09 |
| Bayer Cropscience | ₹5281 (-5.55%) | ₹5265 – ₹5382 |
| Suzlon Energy | ₹45.9 (-4.97%) | ₹45.9 – ₹48.9 |
| Teamlease Services | ₹3040 (-4.57%) | ₹2992 – ₹3,201.94 |
| Engineers India | ₹269.7 (-4.45%) | ₹266.75 – ₹289.85 |
Nifty 51 to 500 Stocks To Watch for Tomorrow
➲ Macrotech Developers (Bullish Pattern)
- Performance Overview: Over the past 26 trading sessions, Macrotech Developers has closed in the green 19 times and in the red 7 times, resulting in a positive close rate of 73.08%.
- Recent Trend: Macrotech Developers has been on a remarkable 12-day green streak, showcasing consistent bullish momentum. The stock has not closed in the red since Wednesday, May 8, 2024.
- Returns: Investors have reaped the benefits of Macrotech Developers’ strong performance, with a return of 15.04% over the last 26 trading sessions. This means an investment of ₹10,000 would have grown to ₹11,503.99.
- Financial Insight: Over the past year, Macrotech Developers has demonstrated financial strength with revenue of ₹10,316.1 Crore and a profit of ₹1,549.1 Crore.
- As of Friday, May 24, 2024, Macrotech Developers has a substantial Market Capital of ₹1,19,340.08 Crore, indicating its position as a major player in the industry.
- Summary: Macrotech Developers presents a compelling investment opportunity with its robust bullish pattern. Investors seeking growth potential should consider monitoring its price movements. For specific targets, refer to our detailed analysis of Macrotech Developers Target for Tomorrow and Macrotech Developers Targets for 2024 & 2025.
Macrotech Developers Financial Performance
| Metric | Value | Description |
|---|---|---|
| Market Capital | 1,19,340.08 Crore | Market valuation of Macrotech Developers’s shares. |
| Revenue (TTM) | 10,316.1 Crore | Total revenue generated by Macrotech Developers over the past twelve months. |
| Net Income (TTM) | +1,549.1 Crore | Net Profit or Loss after all the expenses over the past twelve months. |
| Operating Margin | 23.13% | Income from operations as a percentage of revenue, before taxes and interest. |
| Profit Margin | 15.01% | Net income as a percentage of revenue, after all expenses. |
| Revenue Growth (Quarterly) | +23.4% | Change in revenue compared to the previous quarter. |
| Earnings Growth (YOY Quarterly) | -10.6% | Change in earnings compared to the same quarter last year. |
| Debt-to-Equity (D/E) Ratio | 43.9 | Company’s total debt divided by total shareholder equity. |
| Total Debt | 7,697.59 Crore | Sum of Macrotech Developers’s current & long-term financial obligations. |
| Total Cash | 4,642.19 Crore | Total amount of liquid funds available to Macrotech Developers. |
| Beta | 0.37 | Beta is less than 1 indicating that the Macrotech Developers’s price is less volatile than the market. |
➲ Galaxy Surfactants (Bearish Pattern)
- Performance Overview: Galaxy Surfactants has closed in the red for 16 out of the last 26 trading sessions and in the green for 10.
- Recent Trend: Galaxy Surfactants has been on a five-day red streak, without a single day of positive closing since Friday, May 17th, 2024.
- Returns: Galaxy Surfactants has given a -4.06% return over the last 26 trading sessions, meaning an investment of ₹10,000 would now be worth ₹9,594.
- Financial Insight: Over the past 12 months, Galaxy Surfactants has recorded revenue of ₹3,826.18 crore and a profit of ₹314.49 crore.
- As of Friday, May 24th, 2024, Galaxy Surfactants has a Market Capital of ₹9,271.94 crore.
- Summary: Galaxy Surfactants is currently in a bearish phase. Investors should monitor the situation closely, particularly the Galaxy Surfactants Target for Tomorrow and Galaxy Surfactants Targets for 2024 & 2025.
Galaxy Surfactants Financial Performance
| Metric | Value | Description |
|---|---|---|
| Market Capital | 9,271.94 Crore | Market valuation of Galaxy Surfactants’s shares. |
| Revenue (TTM) | 3,826.18 Crore | Total revenue generated by Galaxy Surfactants over the past twelve months. |
| Net Income (TTM) | +314.49 Crore | Net Profit or Loss after all the expenses over the past twelve months. |
| Operating Margin | 9.28% | Income from operations as a percentage of revenue, before taxes and interest. |
| Profit Margin | 8.22% | Net income as a percentage of revenue, after all expenses. |
| Revenue Growth (Quarterly) | -12.9% | Change in revenue compared to the previous quarter. |
| Earnings Growth (YOY Quarterly) | -32.81% | Change in earnings compared to the same quarter last year. |
| Debt-to-Equity (D/E) Ratio | 11.96 | Company’s total debt divided by total shareholder equity. |
| Total Debt | 242.75 Crore | Sum of Galaxy Surfactants’s current & long-term financial obligations. |
| Total Cash | 305.37 Crore | Total amount of liquid funds available to Galaxy Surfactants. |
| Beta | 0.5 | Beta is less than 1 indicating that the Galaxy Surfactants’s price is less volatile than the market. |
Top Stocks That Created a New All Time High Today
Top Large Cap Stocks That Created a New All Time High Today
Companies with Market Capital more than 20,000 Crores| Stock | Close | New All-Time High (ATH) | Previous ATH | Previous ATH Date |
|---|---|---|---|---|
| Aegis Logistics | 721.59 (+14.52%) | 747.00 (+34.84%) | 553.95 | Thu 18 Apr 2024 |
| Ambuja Cements | 635.90 (-1.64%) | 656.95 (+1.61%) | 646.54 | Wed 24 Apr 2024 |
| ARE&M | 1224.25 (+9.74%) | 1238.00 (+3.16%) | 1200.00 | Mon 01 Apr 2024 |
| Ashok Leyland | 210.55 (-0.85%) | 219.35 (+%) | Thu 01 Jan 1970 | |
| Aurobindo Pharma | 1233.00 (+0.25%) | 1245.69 (+%) | Thu 01 Jan 1970 |
Top Mid Cap Stocks That Created a New All Time High Today
Companies with Market Capital between 5,000 Crores to 20,000 Crores| Stock | Close | New All-Time High (ATH) | Previous ATH | Previous ATH Date |
|---|---|---|---|---|
| Ahluwalia Contracts | 1283.15 (-0.13%) | 1299.00 (+%) | Thu 01 Jan 1970 | |
| Amara Raja Batteries | 1205.00 (+8.02%) | 1237.84 (+9.73%) | 1128.00 | Tue 25 Aug 2015 |
| Astra Microwave Products | 798.09 (+3.31%) | 805.00 (+11.77%) | 720.20 | Tue 23 Apr 2024 |
| ELANTAS Beck India | 12001.04 (-0.17%) | 12299.00 (+23.11%) | 9990.00 | Mon 01 Apr 2024 |
| Engineers India | 269.70 (-4.45%) | 289.85 (+%) | Thu 01 Jan 1970 |
Top Small Cap Stocks That Created a New All Time High Today
Companies with Market Capital less than 5,000 Crores| Stock | Close | New All-Time High (ATH) | Previous ATH | Previous ATH Date |
|---|---|---|---|---|
| Ace Software Exports | 189.50 (+1.99%) | 189.50 (+26.09%) | 150.28 | Mon 01 Apr 2024 |
| Acknit Industries | 328.00 (+6.52%) | 360.00 (+%) | Thu 01 Jan 1970 | |
| Ahmedabad Steelcraft | 60.67 (+4.98%) | 60.67 (+%) | Thu 01 Jan 1970 | |
| AMBO AGRITEC LIMITED | 73.50 (+5%) | 73.50 (+%) | Thu 01 Jan 1970 | |
| Balmer Lawrie Investments | 966.50 (+2.41%) | 969.00 (+%) | Thu 01 Jan 1970 |