Home / Mon 27 May 2024 Market Recap
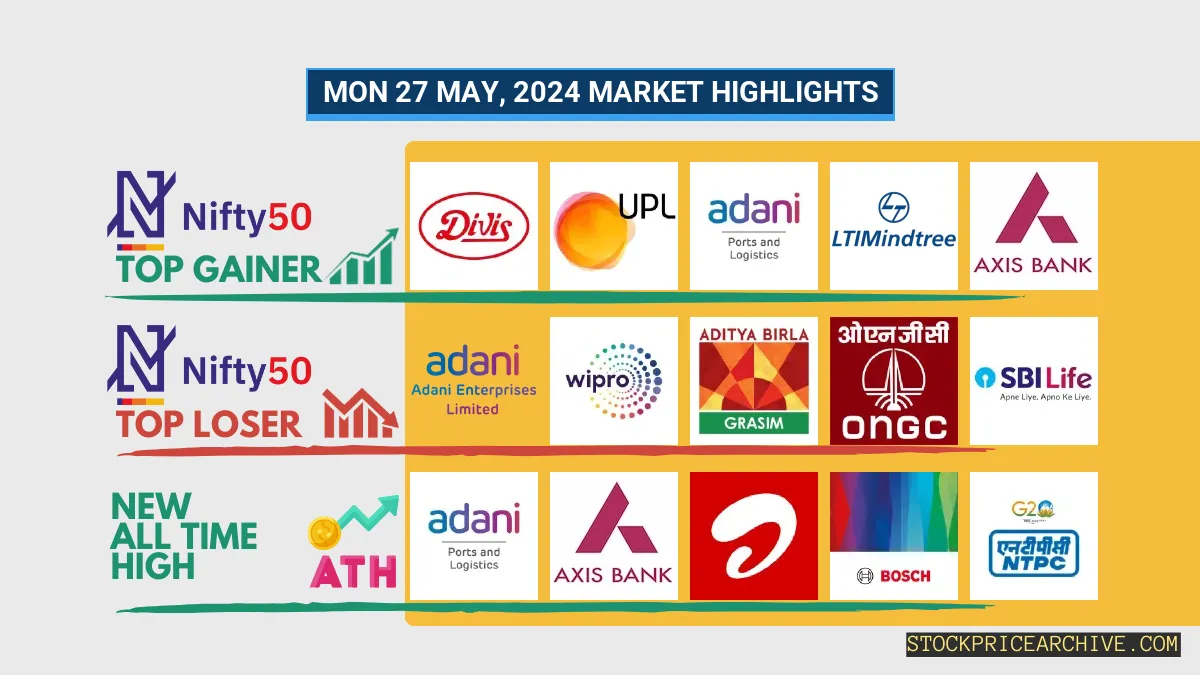
27 May 2024: Nifty 50 closes at ₹22,932.44 (-0.11%), Adani Ports & Bajaj Finance shine with new ATHs!
Show Table of Contents
Table of Contents
- 1: Top Indices Performance Overview
- 2: Nifty 50 Performance Overview
- 2.1: Nifty 50 Top Gainers
- 2.2: Nifty 50 Top Losers
- 2.3: Nifty 50 Stocks To Watch for Tomorrow
- 2.3.1: ➲ Bajaj Finance (Bullish Pattern)
- 2.3.2: ➲ Sun Pharma (Bearish Pattern)
- 3: Nifty 500 Performance Overview
- 3.1: Nifty 500 Top Gainers
- 3.2: Nifty 500 Top Losers
- 3.3: Nifty 51 to 500 Stocks To Watch for Tomorrow
- 3.3.1: ➲ Macrotech Developers (Bullish Pattern)
- 3.3.2: ➲ Galaxy Surfactants (Bearish Trend)
- 4: Top Stocks That Created a New All Time High Today
- 4.1: Top Large Cap Stocks That Created a New All Time High Today
- 4.2: Top Mid Cap Stocks That Created a New All Time High Today
- 4.3: Top Small Cap Stocks That Created a New All Time High Today
Top Indices Performance Overview
| Stock | Close | Range |
|---|---|---|
| NIFTY 50 | ₹22,932.44 (-0.11%) | ₹22,871.19 – ₹23,110.8 |
| NIFTY BANK | ₹49,281.8 (0.63%) | ₹49,051.25 – ₹49,688.85 |
| NIFTY FIN SERVICE | ₹21,962.3 (0.5%) | ₹21,868.9 – ₹22,143.09 |
| NIFTY IT | ₹33,998.39 (0.51%) | ₹33,770.69 – ₹34,225.55 |
| NIFTY AUTO | ₹23,868.65 (-0.1%) | ₹23,697.25 – ₹23,996.09 |
| NIFTY ENERGY | ₹41,307.94 (-0.79%) | ₹41,117.5 – ₹41,854.05 |
Nifty 50 Performance Overview
The Nifty 50 opened the trading day at ₹23,038.94. Throughout the session, it experienced fluctuations, hitting a low of ₹22,871.19 and reaching a high of ₹23,110.80. The index ended the day flat, closing at ₹22,932.44 (-0.11%).
The following table lists the top gainers and losers that influenced today’s Nifty 50 movement:
Nifty 50 Top Gainers
| Stock | Close | Range |
|---|---|---|
| Divis Lab | ₹4,255.25 (3.22%) | ₹4,215.6 – ₹4359 |
| UPL | ₹524.95 (1.77%) | ₹516.84 – ₹529.65 |
| Adani Ports | ₹1433 (1.19%) | ₹1,423.69 – ₹1,454.4 |
| LTIMindtree | ₹4,892.04 (1.08%) | ₹4,826.7 – ₹4,915.2 |
| Axis Bank | ₹1,184.65 (0.9%) | ₹1,168.05 – ₹1,195.9 |
Nifty 50 Top Losers
| Stock | Close | Range |
|---|---|---|
| Adani Enterprises | ₹3,295.05 (-2.66%) | ₹3,267.69 – ₹3,351.94 |
| WIPRO | ₹453.64 (-2.16%) | ₹451.6 – ₹462.14 |
| GRASIM | ₹2,390.64 (-2.07%) | ₹2,385.94 – ₹2,455.69 |
| ONGC | ₹277.64 (-1.99%) | ₹275.7 – ₹284.2 |
| SBI Life Insurance | ₹1,410.19 (-1.82%) | ₹1,402.15 – ₹1448 |
Nifty 50 Stocks To Watch for Tomorrow
➲ Bajaj Finance (Bullish Pattern)
- Performance Overview: In the past 25 trading sessions, Bajaj Finance has closed in green 15 times and in red 10 times. This indicates a balanced performance with a slight bullish bias.
- Recent Trend: Bajaj Finance has been on a 6-day green streak, without a single day closing in red since Fri 17 May 2024. This recent uptrend is a positive sign for investors.
- Returns: Bajaj Finance gave a -3.8% returns in the last 25 trading sessions, meaning your investment of ₹10,000 would have become ₹9,620. While this is a negative return, it’s important to note that the stock has been in an overall uptrend for the past 6 days.
- Financial Insight: Over the past 12 months, Bajaj Finance has generated a renvenue of ₹31,627.11 Crore and created a profit of ₹14,451.16 Crore. These strong financials indicate the company’s financial stability and growth potential.
- As of Mon 27 May 2024, Bajaj Finance has a Market Capital of ₹4,22,525.87 Crore. This high market cap indicates the company’s large size and significance in the financial sector.
- Summary: Bajaj Finance exhibits a robust bullish pattern. Investors should monitor its price movements targets for both short-term and long-term growth prospects: Checkout Bajaj Finance Target for Tomorrow and Bajaj Finance Targets for 2024 & 2025.
Bajaj Finance Financial Performance
| Metric | Value | Description |
|---|---|---|
| Market Capital | 4,22,525.87 Crore | Market valuation of Bajaj Finance’s shares. |
| Revenue (TTM) | 31,627.11 Crore | Total revenue generated by Bajaj Finance over the past twelve months. |
| Net Income (TTM) | +14,451.16 Crore | Net Profit or Loss after all the expenses over the past twelve months. |
| Operating Margin | 60.7% | Income from operations as a percentage of revenue, before taxes and interest. |
| Profit Margin | 45.69% | Net income as a percentage of revenue, after all expenses. |
| Revenue Growth (Quarterly) | +20.8% | Change in revenue compared to the previous quarter. |
| Earnings Growth (YOY Quarterly) | +21.1% | Change in earnings compared to the same quarter last year. |
| Debt-to-Equity (D/E) Ratio | 304.05 | Company’s total debt divided by total shareholder equity. |
| Total Debt | 2,33,197.03 Crore | Sum of Bajaj Finance’s current & long-term financial obligations. |
| Total Cash | 10,651.85 Crore | Total amount of liquid funds available to Bajaj Finance. |
| Beta | 0.94 | Beta is less than 1 indicating that the Bajaj Finance’s price is less volatile than the market. |
➲ Sun Pharma (Bearish Pattern)
- Performance Overview: Over the past 25 trading sessions, Sun Pharma has closed in red 12 times and in green 13 times.
- Recent Trend: Sun Pharma has been on a 4-day red streak, without a single day closing in green since Tuesday, May 21, 2024.
- Returns: Sun Pharma gave a -4.09% return in the last 25 trading sessions, which means your investment of ₹10,000 would have become ₹9,591
- Financial Insight: Over the past 12 months, Sun Pharma has generated a revenue of ₹48,496.84 Crore and earned a profit of ₹9,576.38 Crore.
- As of Monday, May 27, 2024, Sun Pharma has a Market Capital of ₹3,58,724.35 Crore.
- Summary: Sun Pharma is currently experiencing a bearish phase. We advise investors to keep a close watch, especially on Sun Pharma Target for Tomorrow and Sun Pharma Targets for 2024 & 2025.
Sun Pharma Financial Performance
| Metric | Value | Description |
|---|---|---|
| Market Capital | 3,58,724.35 Crore | Market valuation of Sun Pharma’s shares. |
| Revenue (TTM) | 48,496.84 Crore | Total revenue generated by Sun Pharma over the past twelve months. |
| Net Income (TTM) | +9,576.38 Crore | Net Profit or Loss after all the expenses over the past twelve months. |
| Operating Margin | 20.37% | Income from operations as a percentage of revenue, before taxes and interest. |
| Profit Margin | 19.74% | Net income as a percentage of revenue, after all expenses. |
| Revenue Growth (Quarterly) | +9.6% | Change in revenue compared to the previous quarter. |
| Earnings Growth (YOY Quarterly) | +33.8% | Change in earnings compared to the same quarter last year. |
| Debt-to-Equity (D/E) Ratio | 4.87 | Company’s total debt divided by total shareholder equity. |
| Total Debt | 3,273.67 Crore | Sum of Sun Pharma’s current & long-term financial obligations. |
| Total Cash | 19,105.22 Crore | Total amount of liquid funds available to Sun Pharma. |
| Beta | 0.52 | Beta is less than 1 indicating that the Sun Pharma’s price is less volatile than the market. |
Nifty 500 Performance Overview
The Nifty 500 commenced the trading session at ₹21,573.8. Throughout the day, it fluctuated, reaching a low of ₹21,439.15 and a high of ₹21,613.4. The index finally settled at ₹21,494.8 at the close of the session, marking a gain of 0.05%.
The following table lists the top gainers and losers that significantly influenced the Nifty 500’s movement today:
Nifty 500 Top Gainers
| Stock | Close | Range |
|---|---|---|
| zfcvindia | ₹16,261.5 (20%) | ₹13300 – ₹16,261.5 |
| Finolex Cables | ₹1487 (15.93%) | ₹1,304.05 – ₹1505 |
| Indian Overseas Bank | ₹74.5 (10.86%) | ₹67.2 – ₹75.34 |
| Nazara Technologies | ₹672.54 (9.47%) | ₹591.5 – ₹690.84 |
| Glenmark Pharma | ₹1,119.44 (8.05%) | ₹1,031.25 – ₹1,124.5 |
Nifty 500 Top Losers
| Stock | Close | Range |
|---|---|---|
| EIH | ₹443.95 (-5.94%) | ₹441.1 – ₹471.75 |
| PNC Infratech | ₹527.75 (-5.64%) | ₹524.04 – ₹574.79 |
| Hindustan Zinc | ₹704 (-5.21%) | ₹700 – ₹749.7 |
| Timken India | ₹3,951.5 (-4.56%) | ₹3,927.75 – ₹4,173.45 |
| Linde India | ₹8,704.25 (-4.47%) | ₹8650 – ₹9,199.4 |
Nifty 51 to 500 Stocks To Watch for Tomorrow
➲ Macrotech Developers (Bullish Pattern)
- Performance Overview: In the last 25 trading sessions, Macrotech Developers has closed in green 19 times and in red 6 times.
- Recent Trend: Macrotech Developers has been on a 13-day green streak, without a single day closing in red since Wednesday, May 8th, 2024.
- Returns: Macrotech Developers gave a 12.72% return in the last 25 trading sessions, meaning your investment of ₹10,000 would have become ₹11,272.
- Financial Insight: Over the past 12 months, Macrotech Developers has generated a revenue of ₹10,316.1 Crores and created a profit of ₹1,549.1 Crores.
- As of Monday, May 27th, 2024, Macrotech Developers has a Market Capital of ₹1,32,870.29 Crores.
- Summary: Macrotech Developers exhibits a robust bullish pattern. Investors should monitor its price movements, keeping in mind both short-term and long-term growth prospects: Explore Macrotech Developers Target for Tomorrow and Macrotech Developers Targets for 2024 & 2025.
Macrotech Developers Financial Performance
| Metric | Value | Description |
|---|---|---|
| Market Capital | 1,32,870.29 Crore | Market valuation of Macrotech Developers’s shares. |
| Revenue (TTM) | 10,316.1 Crore | Total revenue generated by Macrotech Developers over the past twelve months. |
| Net Income (TTM) | +1,549.1 Crore | Net Profit or Loss after all the expenses over the past twelve months. |
| Operating Margin | 23.13% | Income from operations as a percentage of revenue, before taxes and interest. |
| Profit Margin | 15.01% | Net income as a percentage of revenue, after all expenses. |
| Revenue Growth (Quarterly) | +23.4% | Change in revenue compared to the previous quarter. |
| Earnings Growth (YOY Quarterly) | -10.6% | Change in earnings compared to the same quarter last year. |
| Debt-to-Equity (D/E) Ratio | 43.9 | Company’s total debt divided by total shareholder equity. |
| Total Debt | 7,697.59 Crore | Sum of Macrotech Developers’s current & long-term financial obligations. |
| Total Cash | 4,642.19 Crore | Total amount of liquid funds available to Macrotech Developers. |
| Beta | 0.37 | Beta is less than 1 indicating that the Macrotech Developers’s price is less volatile than the market. |
➲ Galaxy Surfactants (Bearish Trend)
- Performance Overview: Over the past 25 trading sessions, Galaxy Surfactants has ended in the red 16 times, while closing in the green only 9 times.
- Recent Trend: Galaxy Surfactants has been on a 6-day losing streak, with no days closing in the green since Friday, May 17, 2024.
- Returns: In the last 25 trading sessions, Galaxy Surfactants has delivered a return of -5%. This means that an investment of ₹10,000 would now be worth ₹9,500.
- Financial Snapshot: In the past 12 months, Galaxy Surfactants has generated a revenue of ₹3,826.18 Crore and a profit of ₹314.49 Crore.
- As of Monday, May 27, 2024, Galaxy Surfactants has a Market Capitalization of ₹8,838.17 Crore.
- Outlook: Galaxy Surfactants is currently in a bearish phase. Investors should monitor the stock closely, particularly its Tomorrow’s Target and 2024-2025 Targets.
Galaxy Surfactants Financial Performance
| Metric | Value | Description |
|---|---|---|
| Market Capital | 8,838.17 Crore | Market valuation of Galaxy Surfactants’s shares. |
| Revenue (TTM) | 3,826.18 Crore | Total revenue generated by Galaxy Surfactants over the past twelve months. |
| Net Income (TTM) | +314.49 Crore | Net Profit or Loss after all the expenses over the past twelve months. |
| Operating Margin | 9.28% | Income from operations as a percentage of revenue, before taxes and interest. |
| Profit Margin | 8.22% | Net income as a percentage of revenue, after all expenses. |
| Revenue Growth (Quarterly) | -12.9% | Change in revenue compared to the previous quarter. |
| Earnings Growth (YOY Quarterly) | -32.81% | Change in earnings compared to the same quarter last year. |
| Debt-to-Equity (D/E) Ratio | 11.96 | Company’s total debt divided by total shareholder equity. |
| Total Debt | 242.75 Crore | Sum of Galaxy Surfactants’s current & long-term financial obligations. |
| Total Cash | 305.37 Crore | Total amount of liquid funds available to Galaxy Surfactants. |
| Beta | 0.5 | Beta is less than 1 indicating that the Galaxy Surfactants’s price is less volatile than the market. |
Top Stocks That Created a New All Time High Today
Top Large Cap Stocks That Created a New All Time High Today
Companies with Market Capital more than 20,000 Crores| Stock | Close | New All-Time High (ATH) | Previous ATH | Previous ATH Date |
|---|---|---|---|---|
| Adani Ports | 1433.00 (+1.19%) | 1454.40 (+%) | Thu 01 Jan 1970 | |
| Aegis Logistics | 741.00 (+4.32%) | 774.79 (+39.86%) | 553.95 | Thu 18 Apr 2024 |
| Ashok Leyland | 227.20 (+7.83%) | 228.20 (+%) | Thu 01 Jan 1970 | |
| Axis Bank | 1184.65 (+0.9%) | 1195.90 (+%) | Thu 01 Jan 1970 | |
| Bharat Forge | 1569.15 (-0.28%) | 1590.94 (+%) | Thu 01 Jan 1970 |
Top Mid Cap Stocks That Created a New All Time High Today
Companies with Market Capital between 5,000 Crores to 20,000 Crores| Stock | Close | New All-Time High (ATH) | Previous ATH | Previous ATH Date |
|---|---|---|---|---|
| Ahluwalia Contracts | 1279.25 (-0.45%) | 1309.00 (+%) | Thu 01 Jan 1970 | |
| Amara Raja Batteries | 1219.30 (+0.75%) | 1267.65 (+12.38%) | 1128.00 | Tue 25 Aug 2015 |
| Astra Microwave Products | 880.70 (+10.08%) | 914.34 (+26.95%) | 720.20 | Tue 23 Apr 2024 |
| DOMS Industries | 1849.69 (+1.87%) | 1967.90 (+6.6%) | 1846.00 | Mon 01 Apr 2024 |
| Finolex Cables | 1487.00 (+15.93%) | 1505.00 (+%) | Thu 01 Jan 1970 |
Top Small Cap Stocks That Created a New All Time High Today
Companies with Market Capital less than 5,000 Crores| Stock | Close | New All-Time High (ATH) | Previous ATH | Previous ATH Date |
|---|---|---|---|---|
| Ace Software Exports | 193.25 (+1.97%) | 193.25 (+28.59%) | 150.28 | Mon 01 Apr 2024 |
| Ahmedabad Steelcraft | 63.70 (+4.99%) | 63.70 (+%) | Thu 01 Jan 1970 | |
| Alicon Castalloy | 1118.00 (-0.28%) | 1159.00 (+%) | Thu 01 Jan 1970 | |
| AMBO AGRITEC LIMITED | 77.17 (+4.99%) | 77.17 (+%) | Thu 01 Jan 1970 | |
| Arnold Holdings Ltd. | 48.05 (-2.24%) | 50.52 (+%) | Thu 01 Jan 1970 |