Home / Wed 01 May 2024 Stocks To Watch
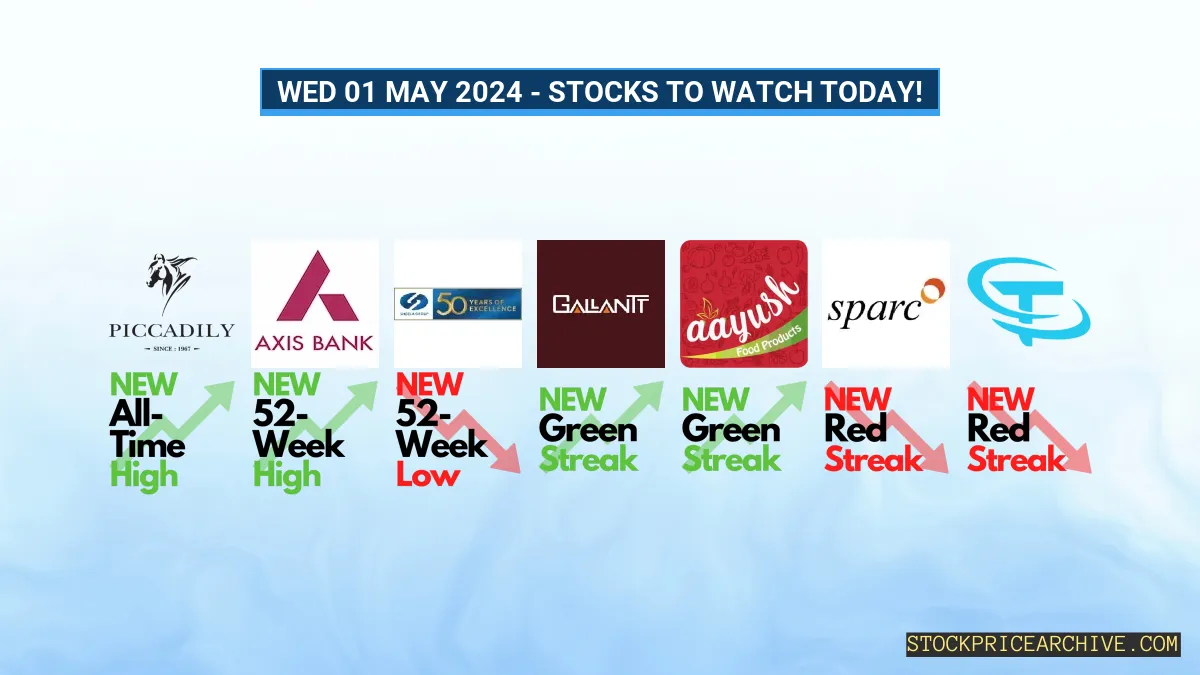
Stocks To Watch Today – 1 May 2024: Piccadily Soars to All-Time High, Axis Bank Creates New 52-Week Peak & More
Show Table of Contents
Table of Contents
- 1: Stocks To Watch for Today!
- 1.1: ➲ Piccadily Agro Industries (Bullish Pattern)
- 1.1.1: Piccadily Agro Industries Financial Performance
- 1.2: ➲ Axis Bank (Bullish Pattern)
- 1.2.1: Axis Bank Financial Performance
- 1.3: ➲ Sheela Foam (Bearish Pattern)
- 1.3.1: Sheela Foam Financial Performance
- 1.4: ➲ Gallantt Metal (Bullish Pattern)
- 1.4.1: Gallantt Metal Financial Performance
- 1.5: ➲ Aayush Food and Herbs (Bullish Pattern)
- 1.5.1: Aayush Food and Herbs Financial Performance
- 1.6: ➲ Sun Pharma Advanced Research Company (Bearish Pattern)
- 1.6.1: Sun Pharma Advanced Research Company Financial Performance
- 1.7: ➲ TIRTH PLASTIC LTD. (Bearish Pattern)
- 1.7.1: TIRTH PLASTIC LTD. Financial Performance
Stocks To Watch for Today!
We have identified some stocks that have potential to give big moves today.
| Company | Yesterday Close | Current Trend |
|---|---|---|
| Piccadily Agro Industries | 667.25 (+31.75%) | Bullish: 12 Day Green Streak, Created New All-Time High |
| Axis Bank | 1163.15 (+3.9%) | Bullish: 8 Day Green Streak, Created New 52-Week High |
| Sheela Foam | 906.00 (-8.41%) | Bearish: 1 Day Red Streak, Creates New 52-Week Low |
| Gallantt Metal | 298.00 (+3.5%) | Bullish: 13 Day Green Streak |
| Aayush Food and Herbs | 256.50 (+4.45%) | Bullish: 23 Day Green Streak (Small Cap Stock) |
| Sun Pharma Advanced Research Company | 232.30 (-12.2%) | Bearish: 14 Day Red Streak |
| TIRTH PLASTIC LTD. | 31.54 (-1.66%) | Bearish: 22 Day Red Streak (Small Cap Stock) |
These stocks didn’t land on our radar by chance, there are compelling trends that caught our attention! Let’s delve into those:-
➲ Piccadily Agro Industries (Bullish Pattern)
Below chart shows daily close price of Piccadily Agro Industries

- On Tuesday, Piccadily Agro Industries shares surged to a new ATH of ₹667.25, eclipsing the previous record of ₹549 set just 6 days prior.
- Performance Overview: Over the past 23 sessions, Piccadily Agro Industries has displayed a remarkable upward trend, with 19 successful trading days, translating to an impressive 82.6% success rate.
- Recent Trend: Since Wed 10 Apr 2024, Piccadily Agro Industries has been on a bullish run, with a significant 78.88% price increase from ₹373 to ₹667.25 over 12 days.
- Returns: In the last 23 trading days, Piccadily Agro Industries has generated exceptional 115.58% returns, transforming an initial investment of ₹10,000 into a substantial ₹21,558.
- Financial Insight: In their 2023-Q3 Income Statement, Piccadily Agro Industries reported a robust net profit of ₹44.35 Crore, translating to Earnings Per Share (EPS) of 4.69 for the Quarter. As of Tue 30 Apr 2024, the company boasts a Market Capital of ₹5,709.88 Crore.
- Future Outlook: Piccadily Agro Industries’ bullish pattern suggests strong potential for growth. Investors are advised to monitor its price movements closely for both short-term and long-term investment opportunities:
- Short-Term Target: Piccadily Agro Industries Target for Tomorrow
- Long-Term Targets: Piccadily Agro Industries Targets for 2024 & 2025.
Piccadily Agro Industries Financial Performance
| Metric | Value | Description |
|---|---|---|
| Revenue Growth (Quarterly) | +50.92% | Change in revenue compared to the previous quarter. |
| Earnings Growth (YOY Quarterly) | +30.65% | Change in earnings compared to the same quarter last year. |
| Operating Margin | 20.92% | Income from operations as a percentage of revenue, before taxes and interest. |
| Profit Margin | 53.91% | Net income as a percentage of revenue, after all expenses. |
| Debt-to-Equity (D/E) Ratio | 0.5 | Company’s total debt divided by total shareholder equity. |
➲ Axis Bank (Bullish Pattern)
Below chart shows daily close price of Axis Bank

- Axis Bank hit ₹1,182.9 on Tuesday, a new 52-Week High since ₹1,151.84 witnessed on 13 Dec 2023.
- Performance Overview: Axis Bank is up 16 times in 23 trading days, clocking in a 69.56% winning rate.
- Recent Trend: The rally has now lasted 8 days, with no red candles in sight since 18 Apr 2024. This positive momentum has pushed the price up 13.58% to ₹1,163.15.
- Returns: Investors who bought Axis Bank 23 days ago have enjoyed a 13.03% returns, turning their ₹10,000 investment into ₹11,303.
- Financial Check-up: In its 2023-Q3 Income Statement, Axis Bank reported a healthy net profit of ₹6,519.5 Crore with ₹21.06 Earnings Per Share (EPS). As of Tue 30 Apr 2024, it boasts a Market Capital of ₹3,48,951.88 Crore.
- Future Outlook: Axis Bank’s bullish momentum shows no signs of slowing down. Keen investors should keep an eye on its price movements for both short-term and long-term gains: Checkout Axis Bank Target for Tomorrow and Axis Bank Targets for 2024 & 2025.
Axis Bank Financial Performance
| Metric | Value | Description |
|---|---|---|
| Revenue Growth (Quarterly) | +110.1% | Change in revenue compared to the previous quarter. |
| Earnings Growth (YOY Quarterly) | +20.31% | Change in earnings compared to the same quarter last year. |
| Operating Margin | 50.19% | Income from operations as a percentage of revenue, before taxes and interest. |
| Profit Margin | 36.43% | Net income as a percentage of revenue, after all expenses. |
| Debt-to-Equity (D/E) Ratio | 1.44 | Company’s total debt divided by total shareholder equity. |
| Beta | 0.88 | Beta is less than 1 indicating that the Axis Bank’s price is less volatile than the market. |
➲ Sheela Foam (Bearish Pattern)
Below chart shows daily close price of Sheela Foam

- Sheela Foam plunged to ₹900.5 on April 29, 2024, marking a new 52-Week Low. Just 11 days ago, it had set its previous 52-Week Low at ₹911.09.
- Performance Overview: In the past 23 trading days, Sheela Foam has declined in 12 sessions, resulting in a negative outcome rate of 52.17%.
- Recent Trend: The stock has been on a 1-day bearish period since April 29, 2024, losing -0.92% to close at ₹906.
- Returns: Over the past 23 trading days, Sheela Foam has accumulated a -3.93% loss, reducing an investor’s ₹10,000 investment to ₹9,607.
- Financial Insight: For the quarter ending December 2023, Sheela Foam reported a net profit of ₹31.15 Crore with an Earnings Per Share (EPS) of 2.83. As of April 30, 2024, it has a Market Capital of ₹9,849.56 Crore.
- Future Outlook: Sheela Foam exhibits a bearish pattern, indicating a downtrend. Investors may want to monitor its price movements and consider their investment strategies accordingly.
Sheela Foam Financial Performance
| Metric | Value | Description |
|---|---|---|
| Revenue Growth (Quarterly) | +7.6% | Change in revenue compared to the previous quarter. |
| Earnings Growth (YOY Quarterly) | -49.2% | Change in earnings compared to the same quarter last year. |
| Operating Margin | 5.26% | Income from operations as a percentage of revenue, before taxes and interest. |
| Profit Margin | 5.69% | Net income as a percentage of revenue, after all expenses. |
| Debt-to-Equity (D/E) Ratio | 19.96 | Company’s total debt divided by total shareholder equity. |
| Beta | 0.35 | Beta is less than 1 indicating that the Sheela Foam’s price is less volatile than the market. |
➲ Gallantt Metal (Bullish Pattern)
Below chart shows daily close price of Gallantt Metal

- Performance Overview: Within the span of the previous 23 trading sessions, Gallantt Metal successfully recorded an upward trend on 18 occasions, equivalent to a 78.26% success ratio.
- Recent Trend: Since Tuesday, April 9, 2024, Gallantt Metal has not seen a single red day, marking a 13-day streak of gains with a 49.64% increase from ₹199.14 to ₹298.
- Returns: The outcome of Gallantt Metal’s recent 23-day effort is a 51.84% profit, which would have escalated ₹10,000 to ₹15,184.
- Financial Insight: In their 2023-Q3 Income Statement Gallantt Metal reported a net profit of ₹51.97 Crore with Earning Per Share (EPS) of 2.15 for the Quarter. Additionally, as of Tuesday, April 30, 2024, it has a Market Capital of ₹7,055.04 Crore.
- Future Outlook: Gallantt Metal exhibits a robust bullish pattern. Investors should monitor its price movements for both short-term and long-term growth prospects: Checkout Gallantt Metal Target for Tomorrow and Gallantt Metal Targets for 2024 & 2025.
Gallantt Metal Financial Performance
| Metric | Value | Description |
|---|---|---|
| Revenue Growth (Quarterly) | +5.6% | Change in revenue compared to the previous quarter. |
| Earnings Growth (YOY Quarterly) | +148.6% | Change in earnings compared to the same quarter last year. |
| Operating Margin | 7.37% | Income from operations as a percentage of revenue, before taxes and interest. |
| Profit Margin | 4.79% | Net income as a percentage of revenue, after all expenses. |
| Debt-to-Equity (D/E) Ratio | 21.26 | Company’s total debt divided by total shareholder equity. |
| Beta | 1.07 | Beta is greater than 1 indicating that the Gallantt Metal’s price is more volatile than the market. |
➲ Aayush Food and Herbs (Bullish Pattern)
Below chart shows daily close price of Aayush Food and Herbs

- Performance Overview: In the recent 23 trading sessions, Aayush Food and Herbs has consistently closed in the green, posting 100% daily gains.
- Bullish Momentum: Aayush Food and Herbs’s impressive run, spanning 23 days from Tue 26 Mar 2024, has led to a remarkable 51.77% surge in its stock price, climbing from ₹169 to ₹256.5.
- Profitable Investment: Investors who invested in Aayush Food and Herbs during this period would have witnessed a 52.22% profit, turning ₹10,000 into ₹15,222.
- Financial Snapshot: In their 2023-Q3 Income Statement, Aayush Food and Herbs declared a net profit of ₹2.97 Lakh, resulting in Earnings Per Share (EPS) of 0.091 for the quarter. As of Tue 30 Apr 2024, its Market Capitalization stood at ₹89.9 Crore.
- Bullish Outlook: Aayush Food and Herbs’s robust bullish pattern suggests a positive outlook. To explore potential growth opportunities, consider these resources: Aayush Food and Herbs Target for Tomorrow and Aayush Food and Herbs Targets for 2024 & 2025.
Aayush Food and Herbs Financial Performance
| Metric | Value | Description |
|---|---|---|
| Revenue Growth (Quarterly) | -100% | Comparison of revenue to the previous quarter, indicating a decline. |
| Operating Margin | -3.51% | Income from operations as a percentage of revenue, before taxes and interest, showing a loss. |
| Profit Margin | 6.26% | Net income as a percentage of revenue, after all expenses, indicating profitability. |
➲ Sun Pharma Advanced Research Company (Bearish Pattern)
Below chart shows daily close price of Sun Pharma Advanced Research Company

- Performance Overview: Sun Pharma Advanced Research Company has demonstrated weakness in the market, with 16 of the last 23 trading sessions (69.56%) closing lower than their opening values.
- Recent Trend: Experiencing a continuous 14-day streak of losses since Mon 08 Apr 2024, Sun Pharma Advanced Research Company has lowered its price from ₹455.29 to ₹232.3, a -48.98% decrease.
- Returns: During the last 23 trading days, Sun Pharma Advanced Research Company’s strategies have faltered, resulting in a -38.35% loss and reducing ₹10,000 to ₹6,165.
- Financial Insight: In their 2023-Q3 Income Statement Sun Pharma Advanced Research Company reported a net loss of ₹99.65 Crore with Earning Per Share (EPS) of -3.07 for the Quarter. Additionally, as of Tue 30 Apr 2024, it has a Market Capital of ₹8,820.58 Crore.
- Future Outlook: Sun Pharma Advanced Research Company exhibits a bearish pattern. Investors should monitor its price movements targets for both short-term and long-term growth prospects: Checkout Sun Pharma Advanced Research Company Target for Tomorrow and Sun Pharma Advanced Research Company Targets for 2024 & 2025.
Sun Pharma Advanced Research Company Financial Performance
| Metric | Value | Description |
|---|---|---|
| Revenue Growth (Quarterly) | -89.4% | Change in revenue compared to the previous quarter. |
| Operating Margin | -763.21% | Income from operations as a percentage of revenue, before taxes and interest. |
| Profit Margin | 28.14% | Net income as a percentage of revenue, after all expenses. |
| Debt-to-Equity (D/E) Ratio | 4.28 | Company’s total debt divided by total shareholder equity. |
| Beta | 0.74 | Beta is less than 1 indicating that the Sun Pharma Advanced Research Company’s price is less volatile than the market. |
➲ TIRTH PLASTIC LTD. (Bearish Pattern)
Below chart shows daily close price of TIRTH PLASTIC LTD.

- Performance Overview: In a sequence of 23 trading days, TIRTH PLASTIC LTD. had closed red in 22 instances, hitting a 95.65% rate of red sessions.
- Recent Trend: TIRTH PLASTIC LTD. has maintained a red trajectory for 22 days since Tue 26 Mar 2024, pulling its value down by -54.35% to ₹31.54 from ₹69.09.
- Returns: With TIRTH PLASTIC LTD. at the helm, the past 23 sessions saw a remarkable -54.35% downturn, making ₹10,000 dwindle to ₹4,565.
- . Additionally, as of Tue 30 Apr 2024, it has a Market Capital of ₹15.55 Crore.
- Future Outlook: TIRTH PLASTIC LTD. exhibits a bearish pattern. Investors should monitor its price movements targets for both short-term and long-term growth prospects: Checkout TIRTH PLASTIC LTD. Target for Tomorrow and TIRTH PLASTIC LTD. Targets for 2024 & 2025.
TIRTH PLASTIC LTD. Financial Performance
| Metric | Value | Description |
|---|