Home / Thu 02 May 2024 Market Recap
May 2, 2024: Nifty 50 closed at ₹22,648.19 (+0.19%), with Bharat Petroleum & Power Grid emerging as top gainers.
Show Table of Contents
Table of Contents
- 1: Top Indices Performance Overview
- 2: Nifty 50 Performance Overview
- 2.1: Nifty 50 Top Gainers
- 2.2: Nifty 50 Top Losers
- 2.3: Nifty 50 Stocks To Watch for Tomorrow
- 2.3.1: ➲ UltraTech Cement (Bullish Pattern)
- 2.3.2: ➲ Britannia (Bearish Pattern)
- 3: Nifty 500 Performance Overview
- 3.1: Nifty 500 Top Gainers
- 3.2: Nifty 500 Top Losers
- 3.3: Nifty 51 to 500 Stocks To Watch for Tomorrow
- 3.3.1: ➲ Ashok Leyland (Bullish Pattern)
- 3.3.2: ➲ Aster Healthcare (Bearish Pattern)
- 4: Top Stocks That Created a New All Time High Today
- 4.1: Top Large Cap Stocks That Created a New All Time High Today
- 4.2: Top Mid Cap Stocks That Created a New All Time High Today
- 4.3: Top Small Cap Stocks That Created a New All Time High Today
Top Indices Performance Overview
| Stock | Close | Range |
|---|---|---|
| NIFTY 50 | ₹22,648.19 (0.19%) | ₹22,567.84 – ₹22,710.5 |
| NIFTY BANK | ₹49,231.05 (-0.34%) | ₹49,123.6 – ₹49,529.35 |
| NIFTY FIN SERVICE | ₹21,873.69 (0.14%) | ₹21,773.84 – ₹21,967.9 |
| NIFTY IT | ₹33,240.19 (0.08%) | ₹33,097.69 – ₹33,328.5 |
| NIFTY AUTO | ₹22,723.94 (1.04%) | ₹22,479.69 – ₹22,776.15 |
| NIFTY ENERGY | ₹40,800.35 (1.1%) | ₹40,384.14 – ₹40,970.25 |
Nifty 50 Performance Overview
The Nifty 50 embarked on its trading day at ₹22,567.84, navigating fluctuations throughout the session. It touched a low of ₹22,567.84 and soared to a high of ₹22,710.5 before concluding the day at ₹22,648.19, marking a 0.19% surge.
Let’s explore the stocks that significantly impacted the Nifty 50’s performance today, examining both the top gainers and losers.
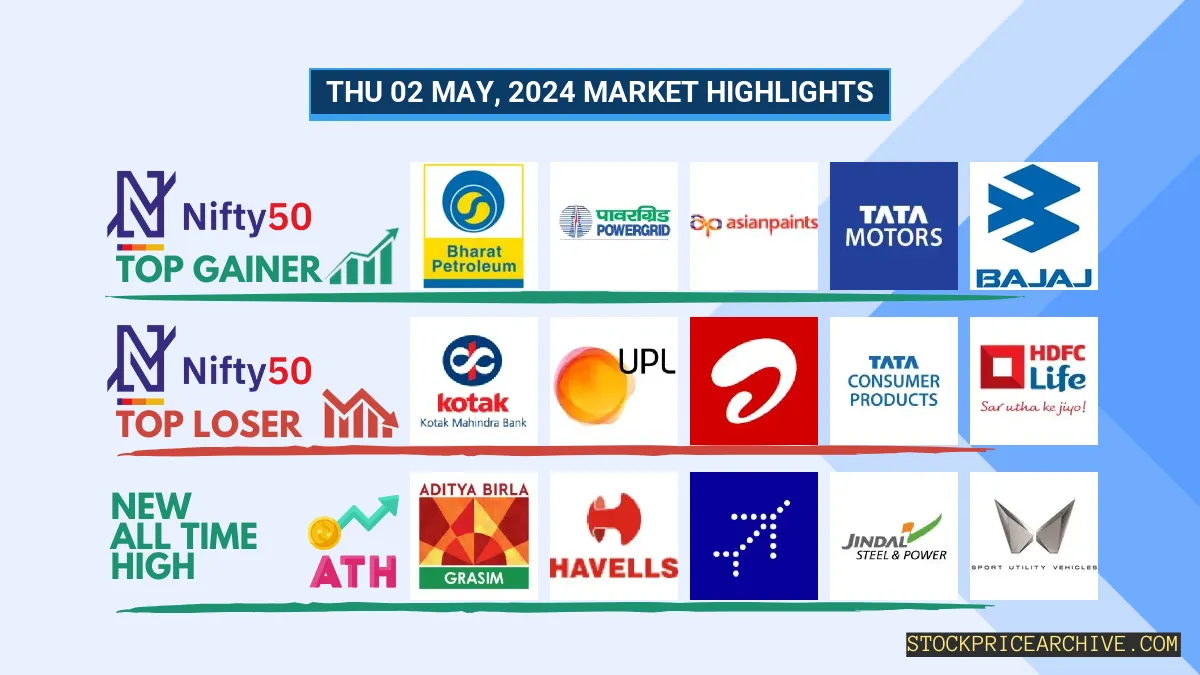
Nifty 50 Top Gainers
| Stock | Close | Range |
|---|---|---|
| Bharat Petroleum | ₹635.34 (4.12%) | ₹614.5 – ₹637.04 |
| Power Grid | ₹313.6 (3.84%) | ₹301.85 – ₹317.25 |
| Asian Paints | ₹2968 (3.38%) | ₹2,875.1 – ₹2988 |
| Tata Motors | ₹1,027.8 (1.97%) | ₹1,011.54 – ₹1030 |
| Bajaj Auto | ₹9087 (1.88%) | ₹8,826.09 – ₹9,145.84 |
Nifty 50 Top Losers
| Stock | Close | Range |
|---|---|---|
| Kotak Mahindra Bank | ₹1578 (-2.83%) | ₹1,552.4 – ₹1,594.5 |
| UPL | ₹498.2 (-1.77%) | ₹497.29 – ₹510.39 |
| Bharti Airtel | ₹1,304.94 (-1.51%) | ₹1,293.58 – ₹1,319.9 |
| Tata Consumer Products | ₹1,091.15 (-1.49%) | ₹1,081.08 – ₹1114 |
| HDFC Life | ₹576.45 (-1.35%) | ₹573.4 – ₹586.54 |
Nifty 50 Stocks To Watch for Tomorrow
➲ UltraTech Cement (Bullish Pattern)
- Performance Overview: Over the past 23 trading sessions, UltraTech Cement has closed in green 14 times and in red 9 times.
- Recent Trend: UltraTech Cement has been on a 6-day green streak, without a single day closing in red since Tuesday, April 23, 2024.
- Returns: UltraTech Cement has delivered a 3.67% return in the last 23 trading sessions, indicating that an investment of ₹10,000 would have grown to ₹10,367.
- Financial Insight: In its 2023-Q3 Income Statement, UltraTech Cement reported a net profit of ₹1,774.78 Crore.
- As of Thursday, May 2, 2024, UltraTech Cement has a Market Capital of ₹2,79,071.13 Crore.
- Summary: UltraTech Cement is showing a strong bullish pattern. Investors may want to consider its price movements and targets for both short-term and long-term growth prospects: Checkout UltraTech Cement Target for Tomorrow and UltraTech Cement Targets for 2024 & 2025.
UltraTech Cement Financial Performance
| Metric | Value | Description |
|---|---|---|
| Revenue Growth (Quarterly) | +7.9% | Change in revenue compared to the previous quarter. |
| Earnings Growth (YOY Quarterly) | +67.9% | Change in earnings compared to the same quarter last year. |
| Operating Margin | 14.76% | Income from operations as a percentage of revenue, before taxes and interest. |
| Profit Margin | 9.27% | Net income as a percentage of revenue, after all expenses. |
| Debt-to-Equity (D/E) Ratio | 20.38 | Company’s total debt divided by total shareholder equity. |
| Beta | 0.47 | Beta is less than 1 indicating that the UltraTech Cement’s price is less volatile than the market. |
➲ Britannia (Bearish Pattern)
- Performance Overview: In the last 23 trading sessions, Britannia has closed in red 15 times and in green 8 times.
- Recent Trend: Britannia has been on a 4-day red streak, without a single day closing in green since Thursday, April 25, 2024.
- Returns: Britannia has given a -4.04% return in the last 23 trading sessions, meaning an investment of ₹10,000 would have become ₹9,596.
- Financial Insight: Britannia reported a net profit of 555.66 Crore in its 2023-Q3 Income Statement.
- As of Thursday, May 2, 2024, Britannia has a Market Capital of ₹1,15,627.48 Crore.
- Summary: Britannia is currently experiencing a bearish phase. Investors may want to monitor its price movements closely, especially its Britannia Target for Tomorrow and Britannia Targets for 2024 & 2025.
Britannia Financial Performance
| Metric | Value | Description |
|---|---|---|
| Revenue Growth (Quarterly) | +1.4% | Change in revenue compared to the previous quarter. |
| Earnings Growth (YOY Quarterly) | -40.31% | Change in earnings compared to the same quarter last year. |
| Operating Margin | 17.45% | Income from operations as a percentage of revenue, before taxes and interest. |
| Profit Margin | 12.96% | Net income as a percentage of revenue, after all expenses. |
| Debt-to-Equity (D/E) Ratio | 96.67 | Company’s total debt divided by total shareholder equity. |
| Beta | 0.48 | Beta is less than 1 indicating that the Britannia’s price is less volatile than the market. |
Nifty 500 Performance Overview
The Nifty 500 commenced the session at ₹21,017.15, experiencing volatility throughout the day. It reached a low of **₹21,015.5** and soared to an intraday high of **₹21,125.84**. Ultimately, the index closed at **₹21,089.05**, marking an increase of **0.48%** compared to its opening value. Key gainers and losers significantly influenced today’s market movement.
Nifty 500 Top Gainers
| Stock | Close | Range |
|---|---|---|
| Raymond | ₹2,294.55 (9.09%) | ₹2,113.25 – ₹2333 |
| Cholamandalam | ₹1,302.25 (8.83%) | ₹1206 – ₹1,309.8 |
| Kfin Technologies | ₹815.95 (8.8%) | ₹748.34 – ₹822 |
| REC | ₹553.9 (8.75%) | ₹510.64 – ₹557.84 |
| Indiamart Intermesh | ₹2858 (8.09%) | ₹2702 – ₹2,908.25 |
Nifty 500 Top Losers
| Stock | Close | Range |
|---|---|---|
| Godrej Industries | ₹892 (-7.47%) | ₹872.9 – ₹990 |
| Aegis Logistics | ₹650.95 (-5.36%) | ₹635.4 – ₹692.04 |
| Supreme Industries | ₹4,812.04 (-4.94%) | ₹4,791.5 – ₹5 |
| JM Financial | ₹84.9 (-4.5%) | ₹84 – ₹89.15 |
| Castrol | ₹202 (-4.11%) | ₹201.55 – ₹211.2 |
Nifty 51 to 500 Stocks To Watch for Tomorrow
➲ Ashok Leyland (Bullish Pattern)
- Performance Overview: Ashok Leyland has closed in green 16 times and in red 7 times in the past 23 trading sessions.
- Recent Trend: Ashok Leyland has been on a 8-day green streak, without a single day closing in red since Fri 19 Apr 2024
- Returns: Ashok Leyland gave a 18.23% returns in the last 23 trading sessions, effectively turning an investment of ₹10,000 into ₹11,823
- Financial Insight: Ashok Leyland reported a net profit of ₹608.85 Crore in the 2023-Q3 Income Statement.
- As of Thu 02 May 2024, Ashok Leyland has a Market Capital of ₹54,351.33 Crore.
- Summary: Ashok Leyland exhibits a robust bullish pattern. Investors should monitor its price movements targets for both short-term and long-term growth prospects: Checkout Ashok Leyland Target for Tomorrow and Ashok Leyland Targets for 2024 & 2025.
Ashok Leyland Financial Performance
| Metric | Value | Description |
|---|---|---|
| Revenue Growth (Quarterly) | +6.7% | Change in revenue compared to the previous quarter. |
| Earnings Growth (YOY Quarterly) | +75.59% | Change in earnings compared to the same quarter last year. |
| Operating Margin | 15.5% | Income from operations as a percentage of revenue, before taxes and interest. |
| Profit Margin | 5.24% | Net income as a percentage of revenue, after all expenses. |
| Debt-to-Equity (D/E) Ratio | 306.52 | Company’s total debt divided by total shareholder equity. |
| Beta | 0.86 | Beta is less than 1 indicating that the Ashok Leyland’s price is less volatile than the market. |
➲ Aster Healthcare (Bearish Pattern)
- Performance Overview: Aster Healthcare has closed in green 9 times and in red 14 times in the last 23 trading sessions.
- Recent Trend: Aster Healthcare has been on a 8-day red streak, without a single day closing in green since Thu 18 Apr 2024
- Returns: Aster Healthcare gave a -16.53% returns in the last 23 trading sessions, effectively turning an investment of ₹10,000 into ₹8,347
- Financial Insight: Aster Healthcare reported a net profit of 209.22 Crore in the 2023-Q3 Income Statement.
- As of Thu 02 May 2024, Aster Healthcare has a Market Capital of ₹17,865.74 Crore.
- Summary: Aster Healthcare is currently experiencing a bearish phase. We advise investors to keep a close watch, especially on Aster Healthcare Target for Tomorrow and Aster Healthcare Targets for 2024 & 2025.
Aster Healthcare Financial Performance
| Metric | Value | Description |
|---|---|---|
| Revenue Growth (Quarterly) | +16.2% | Change in revenue compared to the previous quarter. |
| Earnings Growth (YOY Quarterly) | +28.6% | Change in earnings compared to the same quarter last year. |
| Operating Margin | 8.96% | Income from operations as a percentage of revenue, before taxes and interest. |
| Profit Margin | 2.4% | Net income as a percentage of revenue, after all expenses. |
| Debt-to-Equity (D/E) Ratio | 124.67 | Company’s total debt divided by total shareholder equity. |
| Beta | 0.6 | Beta is less than 1 indicating that the Aster Healthcare’s price is less volatile than the market. |
Top Stocks That Created a New All Time High Today
Top Large Cap Stocks That Created a New All Time High Today
Companies with Market Capital more than 20,000 Crores| Stock | Close | New All-Time High (ATH) | Previous ATH | Previous ATH Date |
|---|---|---|---|---|
| Apar Industries | 8009.79 (+129.69%) | 8105.00 (+3.24%) | 7850.00 | Wed 24 Apr 2024 |
| Ashok Leyland | 201.30 (+8.65%) | 201.95 (+%) | Thu 01 Jan 1970 | |
| Carborundum | 1500.00 (+77.69%) | 1550.00 (+14%) | 1359.59 | Wed 03 Apr 2024 |
| Century Textile | 2005.00 (+7.84%) | 2055.44 (+5.82%) | 1942.25 | Mon 22 Apr 2024 |
| Escorts | 3470.00 (+111.44%) | 3491.85 (+%) | Thu 01 Jan 1970 |
Top Mid Cap Stocks That Created a New All Time High Today
Companies with Market Capital between 5,000 Crores to 20,000 Crores| Stock | Close | New All-Time High (ATH) | Previous ATH | Previous ATH Date |
|---|---|---|---|---|
| BASF | 4036.00 (+299.35%) | 4040.00 (+%) | Thu 01 Jan 1970 | |
| ELANTAS Beck India | 11407.65 (+6.9%) | 11788.90 (+18%) | 9990.00 | Mon 01 Apr 2024 |
| Gallantt Metal | 310.60 (+14.75%) | 310.60 (+12.41%) | 276.29 | Tue 23 Apr 2024 |
| Great Eastern Shipping | 1064.90 (-25.16%) | 1129.00 (+2.91%) | 1097.00 | Wed 24 Apr 2024 |
| Ingersoll Rand | 4030.64 (+35.69%) | 4058.44 (+0.95%) | 4020.10 | Thu 18 Apr 2024 |
Top Small Cap Stocks That Created a New All Time High Today
Companies with Market Capital less than 5,000 Crores| Stock | Close | New All-Time High (ATH) | Previous ATH | Previous ATH Date |
|---|---|---|---|---|
| Aartech Solonics Ltd | 251.89 (+10.95%) | 252.95 (+%) | Thu 01 Jan 1970 | |
| Aayush Food and Herbs | 260.00 (+3%) | 262.00 (+8.1%) | 242.35 | Thu 25 Apr 2024 |
| ABIRAFN | 60.48 (+2.88%) | 60.48 (+21.51%) | 49.77 | Thu 25 Apr 2024 |
| Archidply | 137.19 (+2.89%) | 148.39 (+%) | Thu 01 Jan 1970 | |
| Auro Laboratories | 253.39 (+23%) | 253.39 (+20.83%) | 209.70 | Wed 24 Apr 2024 |