Home / Tue 14 May 2024 Market Recap
Nifty 50 Hits ₹22,225.9 (+0.55%) on 14 May 2024: Adani Enterprises (+5.44%), Mahindra & Mahindra (+3%), and Hero MotoCorp (+2.94%) Drive Market
Show Table of Contents
Table of Contents
- 1: Top Indices Performance Overview
- 2: Nifty 50 Performance Overview
- 2.1: Nifty 50 Top Gainers
- 2.2: Nifty 50 Top Losers
- 2.3: Nifty 50 Stocks To Watch for Tomorrow
- 2.3.1: ➲ Bajaj Auto (Bullish Pattern)
- 2.3.2: ➲ Bharti Airtel (Bearish Pattern)
- 3: Nifty 500 Performance Overview
- 3.1: Nifty 500 Top Gainers
- 3.2: Nifty 500 Top Losers
- 3.3: Nifty 51 to 500 Stocks To Watch for Tomorrow
- 3.3.1: ➲ PI Industries (Bullish Pattern)
- 3.3.2: ➲ Mastek (Bearish Trend)
- 4: Top Stocks That Created a New All Time High Today
- 4.1: Top Large Cap Stocks That Created a New All Time High Today
- 4.2: Top Mid Cap Stocks That Created a New All Time High Today
- 4.3: Top Small Cap Stocks That Created a New All Time High Today
Top Indices Performance Overview
| Stock | Close | Range |
|---|---|---|
| NIFTY 50 | ₹22,225.9 (0.55%) | ₹22,083.15 – ₹22,269.09 |
| NIFTY BANK | ₹47872 (0.24%) | ₹47,608.39 – ₹47,931.14 |
| NIFTY FIN SERVICE | ₹21,256.65 (-0.02%) | ₹21,185.59 – ₹21,317.09 |
| NIFTY IT | ₹33,111.14 (0.07%) | ₹32,918.89 – ₹33,320.85 |
| NIFTY AUTO | ₹22,879.69 (1.87%) | ₹22,436.15 – ₹22,894.44 |
| NIFTY ENERGY | ₹39,514.85 (1.63%) | ₹38,930.8 – ₹39,543.8 |
Nifty 50 Performance Overview
Greetings from the stock market! The Nifty 50 opened the day at ₹22,127.65 and experienced fluctuations, hitting a low of ₹22,083.15 and reaching a high of ₹22,269.09, before finally settling at a close of ₹22,225.9 (+0.55%).
The table below lists the top gainers and losers that influenced today’s Nifty 50 movement.
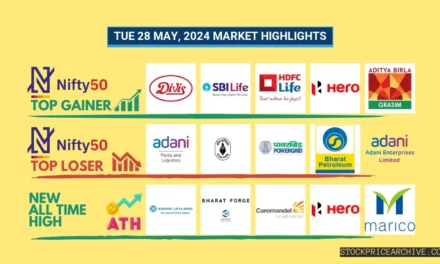
Nifty 50 Top Gainers
| Stock | Close | Range |
|---|---|---|
| Adani Enterprises | ₹3039 (5.44%) | ₹2,874.55 – ₹3,045.19 |
| Mahindra & Mahindra | ₹2,273.25 (3%) | ₹2,190.39 – ₹2,279.6 |
| Hero MotoCorp | ₹5,041.95 (2.94%) | ₹4908 – ₹5051 |
| ONGC | ₹274.45 (2.83%) | ₹266.5 – ₹274.64 |
| JSW Steel | ₹881.5 (2.5%) | ₹861.2 – ₹884.9 |
Nifty 50 Top Losers
| Stock | Close | Range |
|---|---|---|
| Cipla | ₹1,358.19 (-4.42%) | ₹1,350.8 – ₹1,409.65 |
| UPL | ₹511 (-4.33%) | ₹502 – ₹529 |
| HDFC Life | ₹560.29 (-1.44%) | ₹560 – ₹567.95 |
| TCS | ₹3,904.19 (-1.11%) | ₹3,893.75 – ₹3,945.69 |
| Nestle India | ₹2490 (-1.05%) | ₹2482 – ₹2,516.85 |
Nifty 50 Stocks To Watch for Tomorrow
➲ Bajaj Auto (Bullish Pattern)
- Performance Overview: In the past 24 trading sessions, Bajaj Auto has closed in the green 13 times and in the red 10 times.
- Recent Trend: Bajaj Auto has been on a 5-day green streak, without a single day closing in red since Tuesday, May 7, 2024.
- Returns: Bajaj Auto gave a 0.19% return in the last 24 trading sessions, which means your investment of ₹10,000 would have become ₹10,019.
- Financial Insight: Over the past 12 months, Bajaj Auto has generated a revenue of ₹46,306.44 Crore and created a profit of ₹7,708.24 Crore.
- As of Tuesday, May 14, 2024, Bajaj Auto has a Market Capital of ₹2,47,022.61 Crore.
- Summary: Bajaj Auto exhibits a robust bullish pattern. Investors should monitor its price movements for both short-term and long-term growth prospects: Checkout Bajaj Auto Target for Tomorrow and Bajaj Auto Targets for 2024 & 2025.
Bajaj Auto Financial Performance
| Metric | Value | Description |
|---|---|---|
| Market Capital | 2,47,022.61 Crore | Market valuation of Bajaj Auto’s shares. |
| Revenue (TTM) | 46,306.44 Crore | Total revenue generated by Bajaj Auto over the past twelve months. |
| Net Income (TTM) | +7,708.24 Crore | Net Profit or Loss after all the expenses over the past twelve months. |
| Operating Margin | 21.41% | Income from operations as a percentage of revenue, before taxes and interest. |
| Profit Margin | 16.64% | Net income as a percentage of revenue, after all expenses. |
| Revenue Growth (Quarterly) | +34.3% | Change in revenue compared to the previous quarter. |
| Earnings Growth (YOY Quarterly) | +18% | Change in earnings compared to the same quarter last year. |
| Debt-to-Equity (D/E) Ratio | 6.16 | Company’s total debt divided by total shareholder equity. |
| Total Debt | 1,785.9 Crore | Sum of Bajaj Auto’s current & long-term financial obligations. |
| Total Cash | 6,386.91 Crore | Total amount of liquid funds available to Bajaj Auto. |
| Beta | 0.9 | Beta is less than 1 indicating that the Bajaj Auto’s price is less volatile than the market. |
➲ Bharti Airtel (Bearish Pattern)
- Performance Overview: Bharti Airtel has closed in red 13 times and in green 10 times in the last 24 trading sessions.
- Recent Trend: Bharti Airtel is on a 2-day red streak, without a single day closing in green since Friday, 10th May 2024.
- Returns: Over the last 24 trading sessions, Bharti Airtel has provided a return of 8.41%. This means that an investment of ₹10,000 would have grown to ₹10,841.
- Financial Insight: In the past 12 months, Bharti Airtel has generated a renvenue of ₹1,48,392.29 Crore and created a profit of ₹8,401 Crore.
- As of Tuesday, 14th May 2024, Bharti Airtel has a Market Capital of ₹7,58,785.55 Crore.
- Summary: Bharti Airtel is currently experiencing a bearish phase. Investors are advised to closely monitor the stock, especially the Bharti Airtel Target for Tomorrow and Bharti Airtel Targets for 2024 & 2025.
Bharti Airtel Financial Performance
| Metric | Value | Description |
|---|---|---|
| Market Capital | 7,58,785.55 Crore | Market valuation of Bharti Airtel’s shares. |
| Revenue (TTM) | 1,48,392.29 Crore | Total revenue generated by Bharti Airtel over the past twelve months. |
| Net Income (TTM) | +8,401 Crore | Net Profit or Loss after all the expenses over the past twelve months. |
| Operating Margin | 25.7% | Income from operations as a percentage of revenue, before taxes and interest. |
| Profit Margin | 5.66% | Net income as a percentage of revenue, after all expenses. |
| Revenue Growth (Quarterly) | +5.9% | Change in revenue compared to the previous quarter. |
| Earnings Growth (YOY Quarterly) | +53.8% | Change in earnings compared to the same quarter last year. |
| Debt-to-Equity (D/E) Ratio | 211 | Company’s total debt divided by total shareholder equity. |
| Total Debt | 2,18,485.3 Crore | Sum of Bharti Airtel’s current & long-term financial obligations. |
| Total Cash | 23,020.09 Crore | Total amount of liquid funds available to Bharti Airtel. |
| Beta | 0.2 | Beta is less than 1 indicating that the Bharti Airtel’s price is less volatile than the market. |
Nifty 500 Performance Overview
Nifty 500 – A Solid Close!
The Nifty 500 opened at ₹20,551.4 and hit a low of ₹20,508.68 and a high of ₹20,709.34 before closing at ₹20,690.59 (+0.78%).The table below lists the top gainers and losers that affected today’s Nifty 500 performance:Nifty 500 Top Gainers
| Stock | Close | Range |
|---|---|---|
| Cochin Shipyard | ₹1,339.84 (11.93%) | ₹1247 – ₹1,354.59 |
| Finolex Industries/Pipe | ₹299.5 (10.39%) | ₹272.6 – ₹303.6 |
| Mazagoan Dock Shipbuilders | ₹2348 (9.82%) | ₹2,143.89 – ₹2362 |
| Engineers India | ₹243.89 (9.07%) | ₹224.8 – ₹246.89 |
| Godfrey Phillips | ₹3,611.1 (8.93%) | ₹3,266.25 – ₹3,634.39 |
Nifty 500 Top Losers
| Stock | Close | Range |
|---|---|---|
| Tube Investments of India | ₹3,752.8 (-4.64%) | ₹3750 – ₹3,933.69 |
| Cipla | ₹1,358.19 (-4.42%) | ₹1,350.8 – ₹1,409.65 |
| UPL | ₹511 (-4.33%) | ₹502 – ₹529 |
| Zomato | ₹187.55 (-3.48%) | ₹182.25 – ₹193.25 |
| Lupin | ₹1631 (-3.15%) | ₹1630 – ₹1,683.55 |
Nifty 51 to 500 Stocks To Watch for Tomorrow
➲ PI Industries (Bullish Pattern)
- Performance Overview: Over the past 24 trading sessions, PI Industries has closed in green 10 times and in red 14 times.
- Recent Trend: PI Industries has been on a 5-day green streak, without a single day closing in red since Tuesday, May 7, 2024..
- Returns: PI Industries gave a -6.14% return in the last 24 trading sessions, which means that an investment of ₹10,000 would have become ₹9,386.
- Financial Insight: In the past 12 months, PI Industries has generated a revenue of ₹7,490.4 Crore and created a profit of ₹1,592.5 Crore.
- As of Tuesday, May 14, 2024, PI Industries has a Market Capital of ₹53,160.46 Crore.
- Summary: PI Industries exhibits a robust bullish pattern. Investors should monitor its price movements and consider its targets for both short-term and long-term growth prospects: Checkout PI Industries Target for Tomorrow and PI Industries Targets for 2024 & 2025.
PI Industries Financial Performance
| Metric | Value | Description |
|---|---|---|
| Market Capital | 53,160.46 Crore | Market valuation of PI Industries’s shares. |
| Revenue (TTM) | 7,490.4 Crore | Total revenue generated by PI Industries over the past twelve months. |
| Net Income (TTM) | +1,592.5 Crore | Net Profit or Loss after all the expenses over the past twelve months. |
| Operating Margin | 25.04% | Income from operations as a percentage of revenue, before taxes and interest. |
| Profit Margin | 21.26% | Net income as a percentage of revenue, after all expenses. |
| Revenue Growth (Quarterly) | +17.59% | Change in revenue compared to the previous quarter. |
| Earnings Growth (YOY Quarterly) | +27.5% | Change in earnings compared to the same quarter last year. |
| Debt-to-Equity (D/E) Ratio | 2.26 | Company’s total debt divided by total shareholder equity. |
| Total Debt | 180.89 Crore | Sum of PI Industries’s current & long-term financial obligations. |
| Total Cash | 2,955.6 Crore | Total amount of liquid funds available to PI Industries. |
| Beta | 0.62 | Beta is less than 1 indicating that the PI Industries’s price is less volatile than the market. |
➲ Mastek (Bearish Trend)
- Market Performance: Over the past 24 trading sessions, Mastek has been in a bearish trend, closing in red for 19 sessions and green for only 5.
- Recent Trend: The stock has been on a 11-day losing streak, without a single day of gains since Friday, April 26, 2024.
- Returns: In the last 24 trading sessions, Mastek has delivered a negative return of -12.31%. This means that an investment of ₹10,000 would have decreased to ₹8,769.
- Financial Performance: In the past 12 months, Mastek has reported revenue of ₹3,054.79 Crore and a profit of ₹300.28 Crore.
- As of Tuesday, May 14, 2024, Mastek has a Market Capitalization of ₹7,303.46 Crore.
- Outlook: Mastek is currently in a bearish phase. Investors are recommended to monitor the stock closely, including Mastek’s Target for Tomorrow and Mastek’s Targets for 2024 and 2025.
Mastek Financial Performance
| Metric | Value | Description |
|---|---|---|
| Market Capital | 7,303.46 Crore | Market valuation of Mastek’s shares. |
| Revenue (TTM) | 3,054.79 Crore | Total revenue generated by Mastek over the past twelve months. |
| Net Income (TTM) | +300.28 Crore | Net Profit or Loss after all the expenses over the past twelve months. |
| Operating Margin | 12.52% | Income from operations as a percentage of revenue, before taxes and interest. |
| Profit Margin | 9.83% | Net income as a percentage of revenue, after all expenses. |
| Revenue Growth (Quarterly) | +9.9% | Change in revenue compared to the previous quarter. |
| Earnings Growth (YOY Quarterly) | +26.9% | Change in earnings compared to the same quarter last year. |
| Debt-to-Equity (D/E) Ratio | 24.7 | Company’s total debt divided by total shareholder equity. |
| Total Debt | 518.96 Crore | Sum of Mastek’s current & long-term financial obligations. |
| Total Cash | 459.33 Crore | Total amount of liquid funds available to Mastek. |
| Beta | 1.34 | Beta is greater than 1 indicating that the Mastek’s price is more volatile than the market. |
Top Stocks That Created a New All Time High Today
Top Large Cap Stocks That Created a New All Time High Today
Companies with Market Capital more than 20,000 Crores| Stock | Close | New All-Time High (ATH) | Previous ATH | Previous ATH Date |
|---|---|---|---|---|
| ABB India | 8065.00 (+1.01%) | 8117.95 (+20.3%) | 6747.89 | Mon 08 Apr 2024 |
| Apar Industries | 8284.79 (+7.15%) | 8399.00 (+6.99%) | 7850.00 | Wed 24 Apr 2024 |
| Ashok Leyland | 204.60 (+2.63%) | 205.89 (+%) | Thu 01 Jan 1970 | |
| Aurobindo Pharma | 1169.44 (-0.7%) | 1190.00 (+%) | Thu 01 Jan 1970 | |
| Bosch | 31979.90 (+3.83%) | 32096.84 (+3.03%) | 31150.00 | Wed 27 Mar 2024 |
Top Mid Cap Stocks That Created a New All Time High Today
Companies with Market Capital between 5,000 Crores to 20,000 Crores| Stock | Close | New All-Time High (ATH) | Previous ATH | Previous ATH Date |
|---|---|---|---|---|
| BASF | 4639.60 (+13.24%) | 4688.70 (+%) | Thu 01 Jan 1970 | |
| CEBBCO | 488.64 (+1.16%) | 519.95 (+19.85%) | 433.80 | Mon 01 Jan 2024 |
| Finolex Industries/Pipe | 299.50 (+10.45%) | 303.60 (+14.65%) | 264.79 | Thu 04 Apr 2024 |
| H.G. Infra Engineering | 1368.09 (+14.82%) | 1417.00 (+26.07%) | 1123.94 | Mon 08 Apr 2024 |
| Ingersoll Rand | 4505.60 (+4.55%) | 4550.00 (+13.18%) | 4020.10 | Thu 18 Apr 2024 |
Top Small Cap Stocks That Created a New All Time High Today
Companies with Market Capital less than 5,000 Crores| Stock | Close | New All-Time High (ATH) | Previous ATH | Previous ATH Date |
|---|---|---|---|---|
| Aarti Pharmalabs | 624.04 (+19.99%) | 624.04 (+%) | Thu 01 Jan 1970 | |
| Ace Software Exports | 168.45 (+1.99%) | 168.45 (+12.09%) | 150.28 | Mon 01 Apr 2024 |
| Abans Holdings | 448.00 (+9.54%) | 448.89 (+3.05%) | 435.60 | Wed 10 Apr 2024 |
| Allsec Technologies | 1025.50 (-0.43%) | 1060.00 (+%) | Thu 01 Jan 1970 | |
| Balmer Lawrie & | 299.75 (+4.18%) | 299.85 (+%) | Thu 01 Jan 1970 |