Home / Wed 21 Aug 2024 Market Recap
21 Aug 2024: Nifty Closes at ₹24,672.84 (+0.4%), TCS closing higher for the past 6 days & HAVELLS since past 8-days
Show Table of Contents
Table of Contents
- 1: Top Indices Performance Overview
- 2: Nifty 50 Performance Overview
- 2.1: Nifty 50 Top Gainers
- 2.2: Nifty 50 Top Losers
- 2.3: Nifty 50 Stocks To Watch for Tomorrow
- 2.3.1: ➲ TCS (Looking Strong)
- 2.3.2: ➲ Tata Motors (Bearish Pattern)
- 3: Nifty 500 Performance Overview
- 3.1: Nifty 500 Top Gainers
- 3.2: Nifty 500 Top Losers
- 3.3: Nifty 51 to 500 Stocks To Watch for Tomorrow
- 3.3.1: ➲ HAVELLS (Looking Strong!)
- 3.3.2: ➲ J.B. Chemicals & Pharma (Showing Bearish Trends)
- 4: Top Stocks That Created a New All Time High Today
- 4.1: Top Large Cap Stocks That Created a New All Time High Today
- 4.2: Top Mid Cap Stocks That Created a New All Time High Today
- 4.3: Top Small Cap Stocks That Created a New All Time High Today
Top Indices Performance Overview
| Stock | Close | Range |
|---|---|---|
| NIFTY FIN SERVICE | ₹23,161.59 (-0.08%) | ₹23,015.59 – ₹23,169.55 |
| NIFTY IT | ₹41,580.44 (0.01%) | ₹41,368.69 – ₹41,600.39 |
| NIFTY ENERGY | ₹43,597.14 (0.15%) | ₹43,452.69 – ₹43,764.6 |
Nifty 50 Performance Overview
The Nifty 50 started the day at ₹24,648.9, showcasing its typical dynamic nature. Throughout the trading session, the index swung between a low of ₹24,607.19 and a high of ₹24,734.3 before settling at ₹24,672.84, marking a positive close of +0.4%.
The performance of top gainers and losers significantly influenced today’s Nifty 50 movement. Take a look at the table below to see which stocks drove the action.
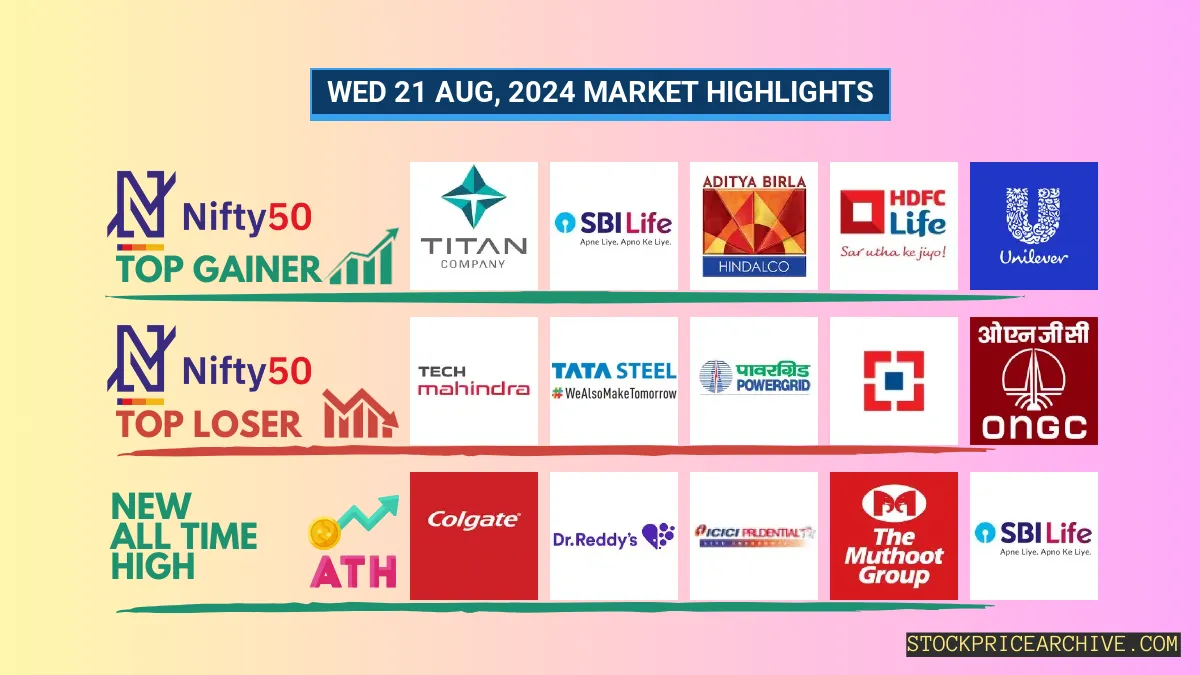
Nifty 50 Top Gainers
| Stock | Close | Range |
|---|---|---|
| TITAN | ₹3559 (2.42%) | ₹3,454.55 – ₹3,580.6 |
| SBI Life Insurance | ₹1799 (2.14%) | ₹1,750.9 – ₹1,803.55 |
| Hindalco | ₹685.59 (1.88%) | ₹668.79 – ₹696.5 |
| HDFC Life | ₹723.2 (1.77%) | ₹708.75 – ₹727.54 |
| Hindustan Unilever | ₹2793 (1.52%) | ₹2,742.94 – ₹2,795.1 |
Nifty 50 Top Losers
| Stock | Close | Range |
|---|---|---|
| Tech Mahindra | ₹1,604.65 (-1.47%) | ₹1,602.05 – ₹1,627.55 |
| Tata Steel | ₹152 (-1.25%) | ₹151.78 – ₹154.13 |
| Power Grid | ₹336.64 (-1.14%) | ₹336.2 – ₹340.95 |
| HDFC BANK | ₹1,625.8 (-0.73%) | ₹1,617.9 – ₹1,633.34 |
| ONGC | ₹328.25 (-0.57%) | ₹326.54 – ₹331.45 |
Nifty 50 Stocks To Watch for Tomorrow
➲ TCS (Looking Strong)
- Recent Performance: In the last 25 trading days, TCS closed higher 16 times and lower 9 times. That’s a pretty good track record!
- Current Trend: TCS has been on a roll, closing higher for the past six days in a row! The last time it closed lower was on Monday, August 12, 2024.
- Returns: Over the last 25 trading days, TCS delivered an 8.94% return. This means an investment of ₹10,000 would have grown to ₹10,894.
- Financial Snapshot: In the past year, TCS generated a revenue of ₹2,40,893 Crore and earned a profit of ₹45,908 Crore.
- As of Wednesday, August 21, 2024, TCS has a Market Capitalization of ₹14,08,686.04 Crore.
- What’s the Outlook? TCS is showing some strong signs. If you’re considering TCS, it’s always wise to check out both short-term and long-term growth possibilities. Take a look at TCS’s Target for Tomorrow and TCS’s Targets for 2024 & 2025.
TCS Financial Performance
| Metric | Value | Description |
|---|---|---|
| Market Capital | 14,08,686.04 Crore | Market valuation of TCS’s shares. |
| Revenue (TTM) | 2,40,893 Crore | Total revenue generated by TCS over the past twelve months. |
| Net Income (TTM) | +45,908 Crore | Net Profit or Loss after all the expenses over the past twelve months. |
| Operating Margin | 25.99% | Income from operations as a percentage of revenue, before taxes and interest. |
| Profit Margin | 19.05% | Net income as a percentage of revenue, after all expenses. |
| Revenue Growth (Quarterly) | +3.5% | Change in revenue compared to the previous quarter. |
| Earnings Growth (YOY Quarterly) | +9.1% | Change in earnings compared to the same quarter last year. |
| Debt-to-Equity (D/E) Ratio | 8.78 | Company’s total debt divided by total shareholder equity. |
| Total Debt | 8,021 Crore | Sum of TCS’s current & long-term financial obligations. |
| Total Cash | 44,100 Crore | Total amount of liquid funds available to TCS. |
| Beta | 0.51 | Beta is less than 1 indicating that the TCS’s price is less volatile than the market. |
➲ Tata Motors (Bearish Pattern)
- Performance Overview: In the last 25 trading sessions, Tata Motors has experienced a mixed bag of results, closing 12 times in the red and 13 times in the green.
- Recent Trend: It’s been a bit of a bumpy ride for Tata Motors lately. The stock has been on a 3-day losing streak, with no gains since Friday, August 16th, 2024.
- Returns: Over the past 25 trading days, Tata Motors has delivered a 5.89% return. This means an investment of ₹10,000 would have grown to ₹10,589.
- Financial Insight: Looking at the bigger picture, Tata Motors has generated a revenue of ₹4,37,927.77 Crore over the past 12 months, and achieved a profit of ₹31,399.09 Crore.
- As of Wednesday, August 21st, 2024, Tata Motors boasts a Market Capital of ₹3,52,846.53 Crore.
- Summary: Right now, Tata Motors is showing a bearish trend. We suggest keeping a close eye on its performance, especially focusing on Tata Motors Target for Tomorrow and Tata Motors Targets for 2024 & 2025.
Tata Motors Financial Performance
| Metric | Value | Description |
|---|---|---|
| Market Capital | 3,52,846.53 Crore | Market valuation of Tata Motors’s shares. |
| Revenue (TTM) | 4,37,927.77 Crore | Total revenue generated by Tata Motors over the past twelve months. |
| Net Income (TTM) | +31,399.09 Crore | Net Profit or Loss after all the expenses over the past twelve months. |
| Operating Margin | 9.32% | Income from operations as a percentage of revenue, before taxes and interest. |
| Profit Margin | 7.17% | Net income as a percentage of revenue, after all expenses. |
| Revenue Growth (Quarterly) | +13.3% | Change in revenue compared to the previous quarter. |
| Earnings Growth (YOY Quarterly) | +221.89% | Change in earnings compared to the same quarter last year. |
| Debt-to-Equity (D/E) Ratio | 112.15 | Company’s total debt divided by total shareholder equity. |
| Total Debt | 1,07,262.5 Crore | Sum of Tata Motors’s current & long-term financial obligations. |
| Total Cash | 60,059.92 Crore | Total amount of liquid funds available to Tata Motors. |
| Beta | 1.81 | Beta is greater than 1 indicating that the Tata Motors’s price is more volatile than the market. |
Nifty 500 Performance Overview
The Nifty 500 started the day at ₹23,281.34, demonstrating a bit of volatility throughout the session. It dipped to a low of ₹23,257 before rallying to a high of ₹23,382.4. Ultimately, it closed the day strong at ₹23,376.55 (+0.41%).
The day’s movement was influenced by a mix of top gainers and losers, which you can see in the table below.
Nifty 500 Top Gainers
| Stock | Close | Range |
|---|---|---|
| Adani Wilmar | ₹393.54 (9.99%) | ₹360 – ₹393.54 |
| PNB Housing Finance | ₹887 (9.38%) | ₹832.34 – ₹909 |
| Lux Industries | ₹2,382.89 (7.49%) | ₹2,214.75 – ₹2411 |
| Justdial | ₹1354 (6.95%) | ₹1268 – ₹1,383.5 |
| Narayana Hrudayalaya | ₹1261 (6.82%) | ₹1,187.69 – ₹1,268.83 |
Nifty 500 Top Losers
| Stock | Close | Range |
|---|---|---|
| ICICI Securities | ₹784.45 (-7.53%) | ₹784 – ₹861.15 |
| Torrent Power | ₹1,723.55 (-4.11%) | ₹1,719.05 – ₹1815 |
| Mankind Pharma | ₹2,283.05 (-3.19%) | ₹2270 – ₹2,354.64 |
| Vaibhav Global | ₹331.35 (-2.79%) | ₹329.25 – ₹339.95 |
| Symphony | ₹1645 (-2.76%) | ₹1,619.84 – ₹1664 |
Nifty 51 to 500 Stocks To Watch for Tomorrow
➲ HAVELLS (Looking Strong!)
- Recent Performance: Over the last 25 trading days, HAVELLS has had a good run, closing higher 15 times and lower 10 times.
- Hot Streak: HAVELLS is on a roll! It has been on an 8-day winning streak, without a single day closing lower since Thursday, August 8th, 2024.
- Returns: Your investment in HAVELLS has seen some growth! Over the past 25 trading days, it delivered a 1.51% return. This means that if you had invested ₹10,000, you would now have ₹10,150.99.
- Financials: HAVELLS has been making solid progress. In the past 12 months, they generated a revenue of ₹19,562.42 Crore and earned a profit of ₹1,391.58 Crore.
- Market Value: As of Wednesday, August 21st, 2024, HAVELLS has a Market Capital of ₹1,17,641.77 Crore.
- The Bottom Line: HAVELLS is showing positive signs. If you’re interested in this stock, consider checking out these resources for potential targets: Checkout HAVELLS Target for Tomorrow and HAVELLS Targets for 2024 & 2025.
HAVELLS Financial Performance
| Metric | Value | Description |
|---|---|---|
| Market Capital | 1,17,641.77 Crore | Market valuation of HAVELLS’s shares. |
| Revenue (TTM) | 19,562.42 Crore | Total revenue generated by HAVELLS over the past twelve months. |
| Net Income (TTM) | +1,391.58 Crore | Net Profit or Loss after all the expenses over the past twelve months. |
| Operating Margin | 8.27% | Income from operations as a percentage of revenue, before taxes and interest. |
| Profit Margin | 7.11% | Net income as a percentage of revenue, after all expenses. |
| Revenue Growth (Quarterly) | +20.1% | Change in revenue compared to the previous quarter. |
| Earnings Growth (YOY Quarterly) | +42.1% | Change in earnings compared to the same quarter last year. |
| Debt-to-Equity (D/E) Ratio | 4.07 | Company’s total debt divided by total shareholder equity. |
| Total Debt | 303.16 Crore | Sum of HAVELLS’s current & long-term financial obligations. |
| Total Cash | 3,022.99 Crore | Total amount of liquid funds available to HAVELLS. |
| Beta | 0.57 | Beta is less than 1 indicating that the HAVELLS’s price is less volatile than the market. |
➲ J.B. Chemicals & Pharma (Showing Bearish Trends)
- Performance Overview: In the last 25 trading days, J.B. Chemicals & Pharma has closed lower than the previous day 10 times and higher 14 times.
- Recent Trend: J.B. Chemicals & Pharma has been on a downward trend for the past four trading days, with no closing gains since Wednesday, August 14, 2024.
- Returns: J.B. Chemicals & Pharma has provided a 6.9% return over the past 25 trading days. This means that a ₹10,000 investment would have grown to ₹10,690 during this period.
- Financial Insight: Over the past 12 months, J.B. Chemicals & Pharma has generated revenue of ₹3,592.38 Crore and earned a profit of ₹587.13 Crore.
- As of Wednesday, August 21, 2024, J.B. Chemicals & Pharma has a Market Capital of ₹30,528.73 Crore.
- Summary: J.B. Chemicals & Pharma is currently showing bearish trends. Keep a close eye on the stock’s performance, particularly in the short term. You might want to check out our J.B. Chemicals & Pharma Target for Tomorrow and J.B. Chemicals & Pharma Targets for 2024 & 2025 for more insights.
J.B. Chemicals & Pharma Financial Performance
| Metric | Value | Description |
|---|---|---|
| Market Capital | 30,528.73 Crore | Market valuation of J.B. Chemicals & Pharma’s shares. |
| Revenue (TTM) | 3,592.38 Crore | Total revenue generated by J.B. Chemicals & Pharma over the past twelve months. |
| Net Income (TTM) | +587.13 Crore | Net Profit or Loss after all the expenses over the past twelve months. |
| Operating Margin | 23.85% | Income from operations as a percentage of revenue, before taxes and interest. |
| Profit Margin | 16.34% | Net income as a percentage of revenue, after all expenses. |
| Revenue Growth (Quarterly) | +12.1% | Change in revenue compared to the previous quarter. |
| Earnings Growth (YOY Quarterly) | +24.2% | Change in earnings compared to the same quarter last year. |
| Debt-to-Equity (D/E) Ratio | 12.91 | Company’s total debt divided by total shareholder equity. |
| Total Debt | 377.65 Crore | Sum of J.B. Chemicals & Pharma’s current & long-term financial obligations. |
| Total Cash | 459.63 Crore | Total amount of liquid funds available to J.B. Chemicals & Pharma. |
| Beta | -0.02 | Beta is less than 1 indicating that the J.B. Chemicals & Pharma’s price is less volatile than the market. |
Top Stocks That Created a New All Time High Today
Top Large Cap Stocks That Created a New All Time High Today
Companies with Market Capital more than 20,000 Crores| Stock | Close | New All-Time High (ATH) | Previous ATH | Previous ATH Date |
|---|---|---|---|---|
| Aditya Birla Sun Life AMC | 772.54 (+2.79%) | 775.00 (+%) | Thu 01 Jan 1970 | |
| Colgate Palmolive | 3573.50 (+0.45%) | 3599.94 (+27.88%) | 2814.89 | Wed 03 Apr 2024 |
| Coromandel International | 1761.94 (+0.95%) | 1784.59 (+%) | Thu 01 Jan 1970 | |
| Dr Reddy Lab | 7058.00 (+1.33%) | 7104.39 (+%) | Thu 01 Jan 1970 | |
| HDFC Asset Management | 4392.00 (+2.16%) | 4395.79 (+%) | Thu 01 Jan 1970 |
Top Mid Cap Stocks That Created a New All Time High Today
Companies with Market Capital between 5,000 Crores to 20,000 Crores| Stock | Close | New All-Time High (ATH) | Previous ATH | Previous ATH Date |
|---|---|---|---|---|
| BALUFORGE | 618.00 (+2.65%) | 630.00 (+%) | Thu 01 Jan 1970 | |
| Bombay Burmah Trading Corp | 2521.64 (+1.18%) | 2598.89 (+%) | Thu 01 Jan 1970 | |
| ENTERO | 1305.05 (+0.51%) | 1324.40 (+%) | Thu 01 Jan 1970 | |
| Eris Lifesciences | 1212.80 (+0.25%) | 1229.59 (+%) | Thu 01 Jan 1970 | |
| Ethos | 3302.25 (-0.35%) | 3479.39 (+%) | Thu 01 Jan 1970 |
Top Small Cap Stocks That Created a New All Time High Today
Companies with Market Capital less than 5,000 Crores| Stock | Close | New All-Time High (ATH) | Previous ATH | Previous ATH Date |
|---|---|---|---|---|
| 21ST CENTURY MANAG | 105.11 (+1.99%) | 105.11 (+%) | Thu 01 Jan 1970 | |
| Ace Men Engg Works | 81.81 (+4.99%) | 81.81 (+%) | Thu 01 Jan 1970 | |
| BELLACASA | 450.00 (+6.52%) | 465.00 (+%) | Thu 01 Jan 1970 | |
| Bits | 8.38 (+1.94%) | 8.38 (+%) | Thu 01 Jan 1970 | |
| Bright Brothers | 261.60 (+20%) | 261.60 (+%) | Thu 01 Jan 1970 |