Home / Thu 16 May 2024 Market Recap
16 May 2024: Nifty 50 at ₹22,403.84 Soars 0.91%, Prince Pipes & Fittings, HAL Shine! Top Stocks Hit ATHs
Show Table of Contents
Table of Contents
- 1: Top Indices Performance Overview
- 2: Nifty 50 Performance Overview
- 2.1: Nifty 50 Top Gainers
- 2.2: Nifty 50 Top Losers
- 2.3: Nifty 50 Stocks To Watch for Tomorrow
- 2.3.1: ➲ Hero MotoCorp (Bullish Pattern)
- 2.3.2: ➲ Asian Paints (Bearish Pattern)
- 3: Nifty 500 Performance Overview
- 3.1: Nifty 500 Top Gainers
- 3.2: Nifty 500 Top Losers
- 3.3: Nifty 51 to 500 Stocks To Watch for Tomorrow
- 3.3.1: ➲ Prince Pipes and Fittings (Bullish Pattern)
- 3.3.2: ➲ Aptus Value Housing Finance (Bearish Pattern)
- 4: Top Stocks That Created a New All Time High Today
- 4.1: Top Large Cap Stocks That Created a New All Time High Today
- 4.2: Top Mid Cap Stocks That Created a New All Time High Today
- 4.3: Top Small Cap Stocks That Created a New All Time High Today
Top Indices Performance Overview
| Stock | Close | Range |
|---|---|---|
| NIFTY 50 | ₹22,403.84 (0.91%) | ₹22,054.55 – ₹22,432.25 |
| NIFTY BANK | ₹47,977.05 (0.6%) | ₹47,340.35 – ₹48,052.89 |
| NIFTY FIN SERVICE | ₹21,416.09 (1.08%) | ₹21,093.84 – ₹21,445.65 |
| NIFTY IT | ₹33,620.19 (1.51%) | ₹33,208.64 – ₹33,704.3 |
| NIFTY AUTO | ₹22,928.5 (0.74%) | ₹22,448.69 – ₹22,941.84 |
| NIFTY ENERGY | ₹40,117.75 (0.42%) | ₹39,425.94 – ₹40,142.25 |
Nifty 50 Performance Overview
The Nifty 50 had a volatile session yesterday, fluctuating between a low of ₹22,054.55 and a high of ₹22,432.25 before finally closing at ₹22,403.84.
Key stocks influencing the index movement:
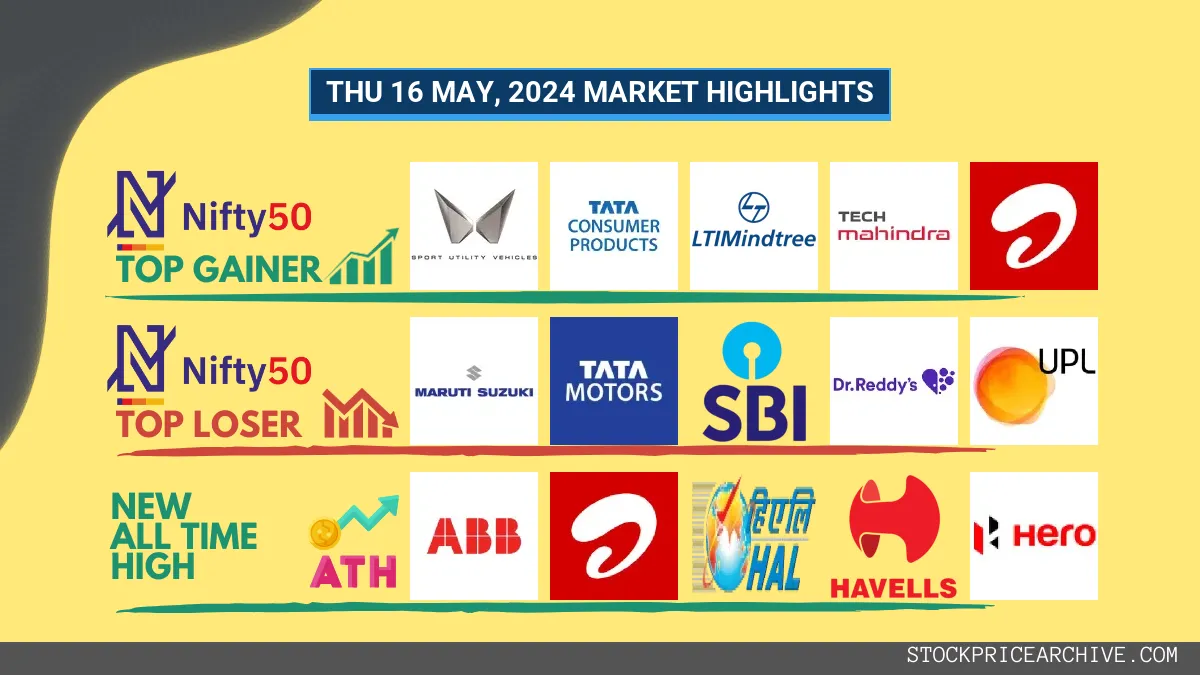
Nifty 50 Top Gainers
| Stock | Close | Range |
|---|---|---|
| Mahindra & Mahindra | ₹2,371.75 (3.01%) | ₹2,286.19 – ₹2,393.89 |
| Tata Consumer Products | ₹1,099.75 (2.88%) | ₹1,057.83 – ₹1,102.55 |
| LTIMindtree | ₹4,771.2 (2.62%) | ₹4,665.95 – ₹4,785.89 |
| Tech Mahindra | ₹1,307.94 (2.62%) | ₹1,281.3 – ₹1,312.59 |
| Bharti Airtel | ₹1344 (2.6%) | ₹1,322.19 – ₹1,356.5 |
Nifty 50 Top Losers
| Stock | Close | Range |
|---|---|---|
| Maruti Suzuki | ₹12,497.65 (-2.12%) | ₹12300 – ₹12848 |
| Tata Motors | ₹936.4 (-1.15%) | ₹919 – ₹954.4 |
| SBI | ₹811.95 (-1.02%) | ₹797.34 – ₹826.15 |
| Dr Reddy Lab | ₹5816 (-1.01%) | ₹5,709.7 – ₹5,927.85 |
| UPL | ₹510 (-0.94%) | ₹505.85 – ₹519.79 |
Nifty 50 Stocks To Watch for Tomorrow
➲ Hero MotoCorp (Bullish Pattern)
- Performance Overview: In the last 24 trading sessions, Hero MotoCorp has closed in green 13 times and in red 11 times.
- Recent Trend: Hero MotoCorp has been on a 7-day green streak, without a single day closing in red since Tuesday, May 7, 2024..
- Returns: Hero MotoCorp gave a 12.87% returns in the last 24 trading sessions, that means your investment of ₹10,000 would have become ₹11,287
- Financial Insight: Over the past 12 months, Hero MotoCorp has generated a renvenue of ₹37,788.62 Crore and created a profit of ₹3,744.82 Crore.
- As of Thursday, May 16, 2024, Hero MotoCorp has a Market Capital of ₹95,265.12 Crore.
- Summary: Hero MotoCorp exhibits a robust bullish pattern. Investors should monitor its price movements targets for both short-term and long-term growth prospects: Checkout Hero MotoCorp Target for Tomorrow and Hero MotoCorp Targets for 2024 & 2025.
Hero MotoCorp Financial Performance
| Metric | Value | Description |
|---|---|---|
| Market Capital | 95,265.12 Crore | Market valuation of Hero MotoCorp’s shares. |
| Revenue (TTM) | 37,788.62 Crore | Total revenue generated by Hero MotoCorp over the past twelve months. |
| Net Income (TTM) | +3,744.82 Crore | Net Profit or Loss after all the expenses over the past twelve months. |
| Operating Margin | 12.44% | Income from operations as a percentage of revenue, before taxes and interest. |
| Profit Margin | 9.91% | Net income as a percentage of revenue, after all expenses. |
| Revenue Growth (Quarterly) | +14% | Change in revenue compared to the previous quarter. |
| Earnings Growth (YOY Quarterly) | +16.1% | Change in earnings compared to the same quarter last year. |
| Debt-to-Equity (D/E) Ratio | 3.4 | Company’s total debt divided by total shareholder equity. |
| Total Debt | 606.4 Crore | Sum of Hero MotoCorp’s current & long-term financial obligations. |
| Total Cash | 5,001.54 Crore | Total amount of liquid funds available to Hero MotoCorp. |
| Beta | 0.82 | Beta is less than 1 indicating that the Hero MotoCorp’s price is less volatile than the market. |
➲ Asian Paints (Bearish Pattern)
- Performance Overview: In the last 24 trading sessions, Asian Paints has closed in red 14 times and in green 10 times.
- Recent Trend: Asian Paints has been on a 3-day red streak, without a single day closing in green since Monday, 13th May 2024.
- Returns: Asian Paints gave a -2.44% returns in the last 24 trading sessions, meaning your investment of ₹10,000 would have become ₹9,756.
- Financial Insight: Over the past 12 months, Asian Paints has generated a revenue of ₹35,490.81 Crore and created a profit of ₹5,437.65 Crore.
- As of Thursday, 16th May 2024, Asian Paints has a Market Capital of ₹2,59,942.77 Crore.
- Summary: Asian Paints is currently experiencing a bearish phase. We advise investors to keep a close watch, especially on Asian Paints Target for Tomorrow and Asian Paints Targets for 2024 & 2025.
Asian Paints Financial Performance
| Metric | Value | Description |
|---|---|---|
| Market Capital | 2,59,942.77 Crore | Market valuation of Asian Paints’s shares. |
| Revenue (TTM) | 35,490.81 Crore | Total revenue generated by Asian Paints over the past twelve months. |
| Net Income (TTM) | +5,437.65 Crore | Net Profit or Loss after all the expenses over the past twelve months. |
| Operating Margin | 20.16% | Income from operations as a percentage of revenue, before taxes and interest. |
| Profit Margin | 15.32% | Net income as a percentage of revenue, after all expenses. |
| Revenue Growth (Quarterly) | +5.4% | Change in revenue compared to the previous quarter. |
| Earnings Growth (YOY Quarterly) | +35% | Change in earnings compared to the same quarter last year. |
| Debt-to-Equity (D/E) Ratio | 13.54 | Company’s total debt divided by total shareholder equity. |
| Total Debt | 2,326.77 Crore | Sum of Asian Paints’s current & long-term financial obligations. |
| Total Cash | 3,998.88 Crore | Total amount of liquid funds available to Asian Paints. |
| Beta | 0.29 | Beta is less than 1 indicating that the Asian Paints’s price is less volatile than the market. |
Nifty 500 Performance Overview
The Nifty 500 commenced the session at ₹20,846.84, experiencing notable fluctuations. It reached a low of ₹20,668 and ascended to a high of ₹20,950.18. Finally, it culminated at ₹20,928.3, marking a gain of (+0.89%). The table below lists the top movers that influenced today’s Nifty 500 performance.
Nifty 500 Top Gainers
| Stock | Close | Range |
|---|---|---|
| HAL | ₹4,637.1 (10.87%) | ₹4,159.2 – ₹4656 |
| NCC | ₹273.54 (8.81%) | ₹254.8 – ₹275 |
| Oberoi Realty | ₹1,711.15 (8.7%) | ₹1,583.25 – ₹1,727.94 |
| Honeywell Automation | ₹53288 (8.12%) | ₹46270 – ₹58,963.89 |
| Ircon International | ₹262.1 (7.97%) | ₹244.05 – ₹263.39 |
Nifty 500 Top Losers
| Stock | Close | Range |
|---|---|---|
| Bandhan Bank | ₹179.85 (-5.29%) | ₹176.55 – ₹190.35 |
| Brightcom Group | ₹11.65 (-4.9%) | ₹11.65 – ₹11.65 |
| Mankind Pharma | ₹2,092.55 (-4.49%) | ₹2060 – ₹2299 |
| Canara Bank | ₹113.9 (-4.29%) | ₹111.85 – ₹120.25 |
| Sobha | ₹1,718.84 (-3.89%) | ₹1702 – ₹1,818.15 |
Nifty 51 to 500 Stocks To Watch for Tomorrow
➲ Prince Pipes and Fittings (Bullish Pattern)
- Performance Overview: In the last 24 trading sessions, Prince Pipes and Fittings has closed in the green 15 times and in the red 9 times.
- Recent Trend: Prince Pipes and Fittings has been on a
- Returns: Prince Pipes and Fittings gave a 5.94% return in the last 24 trading sessions, meaning your investment of ₹10,000 would have become ₹10,593.99
- Financial Insight: Over the past 12 months, Prince Pipes and Fittings has generated a revenue of ₹2,593.02 Crore and created a profit of ₹221.96 Crore.
- As of Thu 16 May 2024, Prince Pipes and Fittings has a Market Capital of ₹6,929.41 Crore.
- Summary: Prince Pipes and Fittings exhibits a robust bullish pattern. Investors should monitor its price movements targets for both short-term and long-term growth prospects: Checkout Prince Pipes and Fittings Target for Tomorrow and Prince Pipes and Fittings Targets for 2024 & 2025.
Prince Pipes and Fittings Financial Performance
| Metric | Value | Description |
|---|---|---|
| Market Capital | 6,929.41 Crore | Market valuation of Prince Pipes and Fittings’s shares. |
| Revenue (TTM) | 2,593.02 Crore | Total revenue generated by Prince Pipes and Fittings over the past twelve months. |
| Net Income (TTM) | +221.96 Crore | Net Profit or Loss after all the expenses over the past twelve months. |
| Operating Margin | 8.52% | Income from operations as a percentage of revenue, before taxes and interest. |
| Profit Margin | 8.55% | Net income as a percentage of revenue, after all expenses. |
| Revenue Growth (Quarterly) | -12.4% | Change in revenue compared to the previous quarter. |
| Earnings Growth (YOY Quarterly) | +6.3% | Change in earnings compared to the same quarter last year. |
| Debt-to-Equity (D/E) Ratio | 4.07 | Company’s total debt divided by total shareholder equity. |
| Total Debt | 58.96 Crore | Sum of Prince Pipes and Fittings’s current & long-term financial obligations. |
| Total Cash | 231.83 Crore | Total amount of liquid funds available to Prince Pipes and Fittings. |
| Beta | 0.92 | Beta is less than 1 indicating that the Prince Pipes and Fittings’s price is less volatile than the market. |
➲ Aptus Value Housing Finance (Bearish Pattern)
- Performance Overview: In the past 24 trading sessions, Aptus Value Housing Finance has closed in red 16 times and in green 8 times.
- Recent Trend: Aptus Value Housing Finance has been on a 4-day red streak, without a single day closing in green since Fri 10 May 2024.
- Returns: Aptus Value Housing Finance gave a -3.7% returns in the last 24 trading sessions, that means your investment of ₹10,000 would have become ₹9,630
- Financial Insight: Over the past 12 months, Aptus Value Housing Finance has generated a revenue of ₹948.38 Crore and created a profit of ₹583.16 Crore.
- As of Thu 16 May 2024, Aptus Value Housing Finance has a Market Capital of ₹16,140.19 Crore.
- Summary: Aptus Value Housing Finance is currently experiencing a bearish phase. We advise investors to keep a close watch, especially on Aptus Value Housing Finance Target for Tomorrow and Aptus Value Housing Finance Targets for 2024 & 2025.
Aptus Value Housing Finance Financial Performance
| Metric | Value | Description |
|---|---|---|
| Market Capital | 16,140.19 Crore | Market valuation of Aptus Value Housing Finance’s shares. |
| Revenue (TTM) | 948.38 Crore | Total revenue generated by Aptus Value Housing Finance over the past twelve months. |
| Net Income (TTM) | +583.16 Crore | Net Profit or Loss after all the expenses over the past twelve months. |
| Operating Margin | 80.07% | Income from operations as a percentage of revenue, before taxes and interest. |
| Profit Margin | 61.49% | Net income as a percentage of revenue, after all expenses. |
| Revenue Growth (Quarterly) | +22.1% | Change in revenue compared to the previous quarter. |
| Earnings Growth (YOY Quarterly) | +25.5% | Change in earnings compared to the same quarter last year. |
| Beta | 0.33 | Beta is less than 1 indicating that the Aptus Value Housing Finance’s price is less volatile than the market. |
Top Stocks That Created a New All Time High Today
Top Large Cap Stocks That Created a New All Time High Today
Companies with Market Capital more than 20,000 Crores| Stock | Close | New All-Time High (ATH) | Previous ATH | Previous ATH Date |
|---|---|---|---|---|
| ABB India | 8329.84 (+3.03%) | 8375.04 (+24.11%) | 6747.89 | Mon 08 Apr 2024 |
| Adani Power | 640.04 (+0.04%) | 651.00 (+0.64%) | 646.84 | Thu 04 Apr 2024 |
| Ashok Leyland | 206.55 (+2.55%) | 207.39 (+%) | Thu 01 Jan 1970 | |
| Bharat Forge | 1485.00 (+1.52%) | 1492.05 (+%) | Thu 01 Jan 1970 | |
| Bharti Airtel | 1344.00 (+2.6%) | 1356.50 (+0.4%) | 1351.00 | Tue 23 Apr 2024 |
Top Mid Cap Stocks That Created a New All Time High Today
Companies with Market Capital between 5,000 Crores to 20,000 Crores| Stock | Close | New All-Time High (ATH) | Previous ATH | Previous ATH Date |
|---|---|---|---|---|
| Astra Microwave Products | 751.04 (+4.05%) | 760.00 (+5.52%) | 720.20 | Tue 23 Apr 2024 |
| CEBBCO | 514.70 (+0.43%) | 525.20 (+21.06%) | 433.80 | Mon 01 Jan 2024 |
| Ingersoll Rand | 4693.75 (-0.27%) | 4969.95 (+23.62%) | 4020.10 | Thu 18 Apr 2024 |
| Jupiter Wagons | 513.59 (+0.17%) | 525.50 (+21.08%) | 434.00 | Tue 23 Jan 2024 |
| Jyoti CNC Automation | 912.95 (+1.68%) | 934.00 (+10.4%) | 846.00 | Mon 01 Apr 2024 |
Top Small Cap Stocks That Created a New All Time High Today
Companies with Market Capital less than 5,000 Crores| Stock | Close | New All-Time High (ATH) | Previous ATH | Previous ATH Date |
|---|---|---|---|---|
| Ace Software Exports | 175.20 (+1.97%) | 175.20 (+16.58%) | 150.28 | Mon 01 Apr 2024 |
| AVONMORE | 130.55 (+3.03%) | 134.80 (+%) | Thu 01 Jan 1970 | |
| Balmer Lawrie Investments | 838.09 (+2.28%) | 855.00 (+%) | Thu 01 Jan 1970 | |
| B&A | 691.54 (+9.22%) | 708.95 (+%) | Thu 01 Jan 1970 | |
| BOMBCYC | 2131.19 (+20%) | 2131.19 (+%) | Thu 01 Jan 1970 |