Home / Tue 23 Jul 2024 Market Recap
23 Jul 2024: Nifty Ends at ₹24,476.4 (-0.14%), Britannia continued its bullish trend, closing higher for the 12th consecutive day!
Show Table of Contents
Table of Contents
- 1: Top Indices Performance Overview
- 2: Nifty 50 Performance Overview
- 2.1: Nifty 50 Top Gainers
- 2.2: Nifty 50 Top Losers
- 2.3: Nifty 50 Stocks To Watch for Tomorrow
- 2.3.1: Britannia (Bullish Pattern)
- 2.3.2: ➲ Adani Enterprises (Recent Performance: Bearish)
- 3: Nifty 500 Performance Overview
- 3.1: Nifty 500 Top Gainers
- 3.2: Nifty 500 Top Losers
- 3.3: Nifty 51 to 500 Stocks To Watch for Tomorrow
- 3.3.1: ➲ MphasiS (Looking Strong)
- 3.3.2: ➲ Timken India (Bearish Trend)
- 4: Top Stocks That Created a New All Time High Today
- 4.1: Top Large Cap Stocks That Created a New All Time High Today
- 4.2: Top Mid Cap Stocks That Created a New All Time High Today
- 4.3: Top Small Cap Stocks That Created a New All Time High Today
Top Indices Performance Overview
| Stock | Close | Range |
|---|---|---|
| NIFTY 50 | ₹24,476.4 (-0.14%) | ₹24,076.5 – ₹24,578.94 |
| NIFTY BANK | ₹51,757.14 (-1.01%) | ₹51,348.39 – ₹52,457.44 |
| NIFTY FIN SERVICE | ₹23,300.75 (-1.39%) | ₹23,114.09 – ₹23,708.9 |
| NIFTY IT | ₹40,025.39 (0.63%) | ₹39,084.5 – ₹40,193.05 |
| NIFTY AUTO | ₹25,269.3 (0.07%) | ₹24,477.84 – ₹25,458.19 |
| NIFTY ENERGY | ₹41,730.1 (-0.52%) | ₹40,332.14 – ₹42,191.44 |
Nifty 50 Performance Overview
The Nifty 50 kicked off the day at ₹24,564.55, showing a bit of a roller coaster ride throughout the session. It dipped to a low of ₹24,076.5 before climbing to a high of ₹24,578.94. At the closing bell, the index settled at ₹24,476.4, marking a slight decrease of -0.14% for the day.
Check out the table below to see the top gainers and losers that influenced the Nifty 50’s movements today.
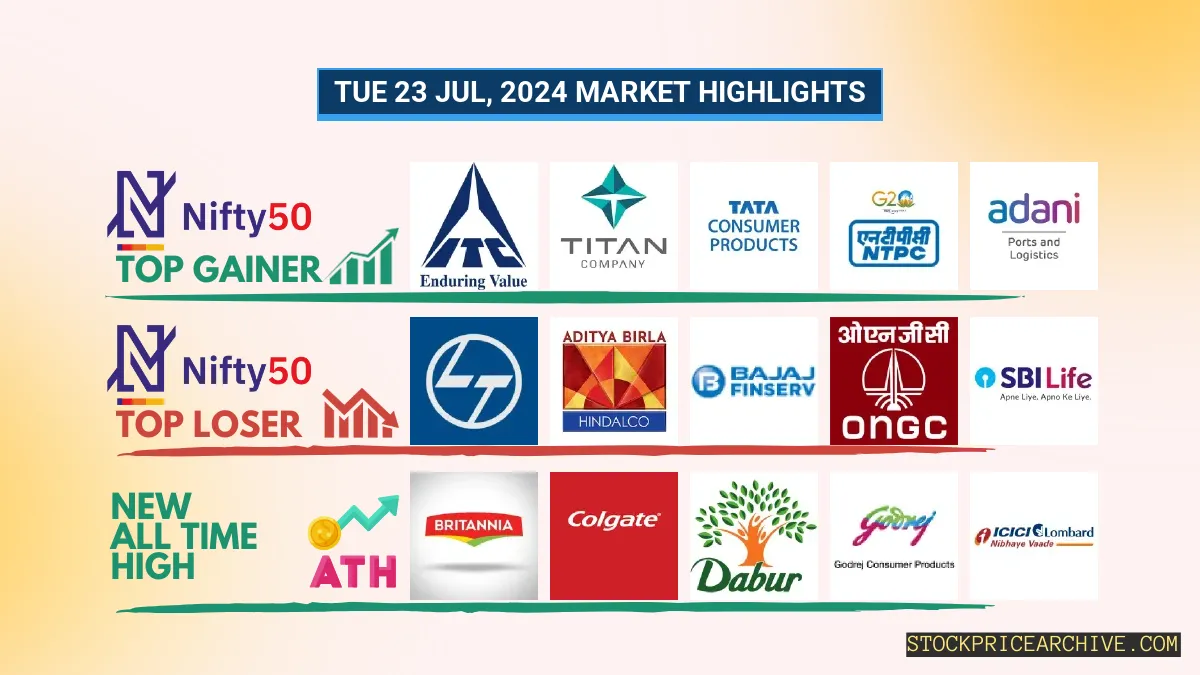
Nifty 50 Top Gainers
| Stock | Close | Range |
|---|---|---|
| ITC | ₹497.1 (6.55%) | ₹466.54 – ₹497.39 |
| TITAN | ₹3467 (6.53%) | ₹3,232.14 – ₹3,489.85 |
| Tata Consumer Products | ₹1,255.5 (4.2%) | ₹1,200.9 – ₹1261 |
| NTPC | ₹383.89 (2.78%) | ₹361.75 – ₹385.04 |
| Adani Ports | ₹1507 (2.7%) | ₹1,419.4 – ₹1,516.8 |
Nifty 50 Top Losers
| Stock | Close | Range |
|---|---|---|
| Larsen Toubro | ₹3,538.05 (-3.11%) | ₹3460 – ₹3714 |
| Hindalco | ₹652.34 (-2.97%) | ₹638.79 – ₹673.15 |
| Bajaj Finance | ₹6730 (-2.25%) | ₹6,624.39 – ₹6,938.7 |
| ONGC | ₹314.89 (-1.84%) | ₹297.5 – ₹321.39 |
| SBI Life Insurance | ₹1,594.84 (-1.63%) | ₹1,578.8 – ₹1638 |
Nifty 50 Stocks To Watch for Tomorrow
Britannia (Bullish Pattern)
- Performance Overview: Over the last 25 trading days, Britannia has closed higher on 20 days and lower on 5 days.
- Recent Trend: Britannia has been on a roll! It’s been on a 12-day winning streak, closing higher each day since Thursday, July 4th, 2024.
- Returns: If you had invested ₹10,000 in Britannia over the past 25 trading days, you would have seen a return of 9.81%, bringing your investment to ₹10,981.
- Financial Insight: In the past year, Britannia has generated a revenue of ₹16,769.26 Crore and achieved a profit of ₹2,139.8 Crore.
- As of Tuesday, July 23rd, 2024, Britannia has a Market Capital of ₹1,41,581.01 Crore.
- Summary: Britannia is exhibiting a strong bullish pattern, making it a stock worth watching. Investors might want to consider its price movements and explore both short-term and long-term growth potential. Checkout Britannia Target for Tomorrow and Britannia Targets for 2024 & 2025.
Britannia Financial Performance
| Metric | Value | Description |
|---|---|---|
| Market Capital | 1,41,581.01 Crore | Market valuation of Britannia’s shares. |
| Revenue (TTM) | 16,769.26 Crore | Total revenue generated by Britannia over the past twelve months. |
| Net Income (TTM) | +2,139.8 Crore | Net Profit or Loss after all the expenses over the past twelve months. |
| Operating Margin | 17.38% | Income from operations as a percentage of revenue, before taxes and interest. |
| Profit Margin | 12.76% | Net income as a percentage of revenue, after all expenses. |
| Revenue Growth (Quarterly) | +2.7% | Change in revenue compared to the previous quarter. |
| Earnings Growth (YOY Quarterly) | -3.6% | Change in earnings compared to the same quarter last year. |
| Debt-to-Equity (D/E) Ratio | 52.06 | Company’s total debt divided by total shareholder equity. |
| Total Debt | 2,064.95 Crore | Sum of Britannia’s current & long-term financial obligations. |
| Total Cash | 2,142.86 Crore | Total amount of liquid funds available to Britannia. |
| Beta | 0.53 | Beta is less than 1 indicating that the Britannia’s price is less volatile than the market. |
➲ Adani Enterprises (Recent Performance: Bearish)
- Performance Summary: Over the past 25 trading days, Adani Enterprises has closed lower 16 times and higher 9 times.
- Recent Trend: Adani Enterprises has been on a downward trend, closing lower for the past four consecutive days, since Tuesday, July 16th, 2024.
- Returns: In the last 25 trading days, Adani Enterprises has generated a negative return of 9.51%. This means an investment of ₹10,000 would have decreased to ₹9,049.
- Financial Snapshot: During the past 12 months, Adani Enterprises generated revenue of ₹96,420.98 Crore and recorded a profit of ₹3,104.19 Crore.
- As of Tuesday, July 23rd, 2024, Adani Enterprises has a Market Capitalization of ₹3,42,649.78 Crore.
- Overall: Adani Enterprises is currently experiencing a bearish phase. Investors might want to keep a close eye on the company’s performance, especially the Adani Enterprises Target for Tomorrow and the Adani Enterprises Targets for 2024 & 2025.
Adani Enterprises Financial Performance
| Metric | Value | Description |
|---|---|---|
| Market Capital | 3,42,649.78 Crore | Market valuation of Adani Enterprises’s shares. |
| Revenue (TTM) | 96,420.98 Crore | Total revenue generated by Adani Enterprises over the past twelve months. |
| Net Income (TTM) | +3,104.19 Crore | Net Profit or Loss after all the expenses over the past twelve months. |
| Operating Margin | 8.76% | Income from operations as a percentage of revenue, before taxes and interest. |
| Profit Margin | 3.36% | Net income as a percentage of revenue, after all expenses. |
| Revenue Growth (Quarterly) | -6.9% | Change in revenue compared to the previous quarter. |
| Earnings Growth (YOY Quarterly) | -37.6% | Change in earnings compared to the same quarter last year. |
| Debt-to-Equity (D/E) Ratio | 147.8 | Company’s total debt divided by total shareholder equity. |
| Total Debt | 65,310.14 Crore | Sum of Adani Enterprises’s current & long-term financial obligations. |
| Total Cash | 4,380.95 Crore | Total amount of liquid funds available to Adani Enterprises. |
| Beta | 0.93 | Beta is less than 1 indicating that the Adani Enterprises’s price is less volatile than the market. |
Nifty 500 Performance Overview
The Nifty 500 started the day at ₹23,017.15, showing its usual energetic spirit. It danced around throughout the session, hitting a low of ₹22,308.75 and a high of ₹23,030.84 before finally settling down at ₹22,864.84, a -0.34% dip for the day.
This movement was influenced by some top gainers and losers, which you can find in the table below.
Nifty 500 Top Gainers
| Stock | Close | Range |
|---|---|---|
| Teamlease Services | ₹3,268.69 (12.34%) | ₹2,857.64 – ₹3426 |
| Network18 Media & Investments | ₹85.98 (9.99%) | ₹75.78 – ₹85.98 |
| C.E. Info Systems | ₹2,457.89 (8.74%) | ₹2,241.75 – ₹2,524.89 |
| Asahi Glass | ₹696.2 (8.18%) | ₹642.9 – ₹704.75 |
| Borosil Renwables | ₹516 (7.54%) | ₹480.5 – ₹534.5 |
Nifty 500 Top Losers
| Stock | Close | Range |
|---|---|---|
| Ircon International | ₹295.14 (-7.47%) | ₹262.5 – ₹327.89 |
| RCF | ₹218.28 (-7.13%) | ₹208.71 – ₹245 |
| Fertilisers & Chemicals Travancore | ₹1,014.9 (-6.26%) | ₹982 – ₹1,114.69 |
| Manappuram Finance | ₹203 (-5.7%) | ₹200.5 – ₹216.67 |
| NIACL | ₹255.69 (-5.59%) | ₹239.49 – ₹271.6 |
Nifty 51 to 500 Stocks To Watch for Tomorrow
➲ MphasiS (Looking Strong)
- Recent Performance: In the past 25 trading sessions, MphasiS has closed higher 20 times and lower 5 times. That’s a pretty good track record!
- Hot Streak: MphasiS has been on an impressive 8-day winning streak, with no dips since Wednesday, July 10th, 2024.
- Returns: Over the past 25 trading days, MphasiS has delivered a solid 21.72% return. This means a ₹10,000 investment would be worth ₹12,172 today.
- Financial Highlights: In the last 12 months, MphasiS has generated a revenue of ₹13,278.51 Crore and a profit of ₹1,554.81 Crore. That’s a strong financial performance.
- As of Tuesday, July 23rd, 2024, MphasiS has a Market Capital of ₹54,412.39 Crore.
- Looking Ahead: MphasiS is showing a strong bullish pattern. Investors are keeping a close eye on its price movements, looking for both short-term and long-term growth opportunities. Check out MphasiS Target for Tomorrow and MphasiS Targets for 2024 & 2025 for potential insights.
MphasiS Financial Performance
| Metric | Value | Description |
|---|---|---|
| Market Capital | 54,412.39 Crore | Market valuation of MphasiS’s shares. |
| Revenue (TTM) | 13,278.51 Crore | Total revenue generated by MphasiS over the past twelve months. |
| Net Income (TTM) | +1,554.81 Crore | Net Profit or Loss after all the expenses over the past twelve months. |
| Operating Margin | 10.11% | Income from operations as a percentage of revenue, before taxes and interest. |
| Profit Margin | 11.7% | Net income as a percentage of revenue, after all expenses. |
| Revenue Growth (Quarterly) | +1.5% | Change in revenue compared to the previous quarter. |
| Earnings Growth (YOY Quarterly) | -3% | Change in earnings compared to the same quarter last year. |
| Debt-to-Equity (D/E) Ratio | 27.16 | Company’s total debt divided by total shareholder equity. |
| Total Debt | 2,388.58 Crore | Sum of MphasiS’s current & long-term financial obligations. |
| Total Cash | 3,407.02 Crore | Total amount of liquid funds available to MphasiS. |
| Beta | 0.74 | Beta is less than 1 indicating that the MphasiS’s price is less volatile than the market. |
➲ Timken India (Bearish Trend)
- Performance Snapshot: In the last 25 trading days, Timken India has ended the day lower 20 times and higher 5 times.
- Recent Trend: Timken India has been on a downward trend for 13 consecutive trading days, without a single day closing higher since Wednesday, July 3rd, 2024.
- Returns: Over the past 25 trading days, Timken India has yielded a -17% return. This means an investment of ₹10,000 would have decreased to ₹8,300 during this period.
- Financial Highlights: In the past 12 months, Timken India has generated revenue of ₹2,909.54 Crore and a profit of ₹392.14 Crore.
- As of Tuesday, July 23rd, 2024, Timken India has a Market Capitalization of ₹31,142.42 Crore.
- Summary: Timken India is currently experiencing a bearish trend. We recommend keeping a close eye on the stock, especially its short-term price target for tomorrow and price targets for 2024 and 2025.
Timken India Financial Performance
| Metric | Value | Description |
|---|---|---|
| Market Capital | 31,142.42 Crore | Market valuation of Timken India’s shares. |
| Revenue (TTM) | 2,909.54 Crore | Total revenue generated by Timken India over the past twelve months. |
| Net Income (TTM) | +392.14 Crore | Net Profit or Loss after all the expenses over the past twelve months. |
| Operating Margin | 19.7% | Income from operations as a percentage of revenue, before taxes and interest. |
| Profit Margin | 13.47% | Net income as a percentage of revenue, after all expenses. |
| Revenue Growth (Quarterly) | +11.89% | Change in revenue compared to the previous quarter. |
| Earnings Growth (YOY Quarterly) | +35.4% | Change in earnings compared to the same quarter last year. |
| Debt-to-Equity (D/E) Ratio | 1.04 | Company’s total debt divided by total shareholder equity. |
| Total Debt | 25.36 Crore | Sum of Timken India’s current & long-term financial obligations. |
| Total Cash | 491.85 Crore | Total amount of liquid funds available to Timken India. |
| Beta | 0.47 | Beta is less than 1 indicating that the Timken India’s price is less volatile than the market. |
Top Stocks That Created a New All Time High Today
Top Large Cap Stocks That Created a New All Time High Today
Companies with Market Capital more than 20,000 Crores| Stock | Close | New All-Time High (ATH) | Previous ATH | Previous ATH Date |
|---|---|---|---|---|
| Britannia | 5952.00 (+1.08%) | 6003.89 (+%) | Thu 01 Jan 1970 | |
| Colgate Palmolive | 3180.14 (+1.34%) | 3181.39 (+13.02%) | 2814.89 | Wed 03 Apr 2024 |
| Dabur India | 652.29 (+2.45%) | 662.25 (+%) | Thu 01 Jan 1970 | |
| Federal Bank | 198.19 (+2.72%) | 200.50 (+%) | Thu 01 Jan 1970 | |
| Glaxosmithkline | 2689.05 (+2.59%) | 2824.69 (+%) | Thu 01 Jan 1970 |
Top Mid Cap Stocks That Created a New All Time High Today
Companies with Market Capital between 5,000 Crores to 20,000 Crores| Stock | Close | New All-Time High (ATH) | Previous ATH | Previous ATH Date |
|---|---|---|---|---|
| Blue Jet Healthcare | 439.70 (+5.2%) | 455.00 (+%) | Thu 01 Jan 1970 | |
| CMS Info Systems | 537.79 (-0.04%) | 558.90 (+%) | Thu 01 Jan 1970 | |
| Dhanuka Agritech | 1674.00 (+0.64%) | 1822.50 (+30.56%) | 1395.90 | Mon 22 Apr 2024 |
| Gravita India | 1728.55 (+19.29%) | 1738.80 (+%) | Thu 01 Jan 1970 | |
| Maharashtra Scooters | 9398.00 (+0.2%) | 9499.95 (+%) | Thu 01 Jan 1970 |
Top Small Cap Stocks That Created a New All Time High Today
Companies with Market Capital less than 5,000 Crores| Stock | Close | New All-Time High (ATH) | Previous ATH | Previous ATH Date |
|---|---|---|---|---|
| Ace Software Exports | 327.60 (+1.99%) | 327.60 (+117.99%) | 150.28 | Mon 01 Apr 2024 |
| Ahmedabad Steelcraft | 141.35 (+1.98%) | 141.35 (+%) | Thu 01 Jan 1970 | |
| Antony Waste Handling | 694.34 (+3.82%) | 702.00 (+%) | Thu 01 Jan 1970 | |
| Bits | 5.72 (+1.96%) | 5.72 (+%) | Thu 01 Jan 1970 | |
| Ceenik Exports | 909.00 (-1.63%) | 942.50 (+84.37%) | 511.20 | Wed 24 Apr 2024 |