Home / Tue 18 Jun 2024 Market Recap
18 Jun 2024: Nifty Closes at ₹23,557.9 (+0.39%) | Apollo Hospitals & Bharat Electronics Shine, Maruti Suzuki & Finolex Industries Dip | Top Stocks To Watch
Show Table of Contents
Table of Contents
- 1: Top Indices Performance Overview
- 2: Nifty 50 Performance Overview
- 2.1: Nifty 50 Top Gainers
- 2.2: Nifty 50 Top Losers
- 2.3: Nifty 50 Stocks To Watch for Tomorrow
- 2.3.1: Apollo Hospitals: A Bullish Trend to Watch
- 2.3.2: ➲ Maruti Suzuki (Bearish Trend)
- 3: Nifty 500 Performance Overview
- 3.1: Nifty 500 Top Gainers
- 3.2: Nifty 500 Top Losers
- 3.3: Nifty 51 to 500 Stocks To Watch for Tomorrow
- 3.3.1: ➲ Bharat Electronics (Strong Bullish Trend)
- 3.3.2: ➲ Finolex Industries/Pipe (Bearish Trend)
- 4: Top Stocks That Created a New All Time High Today
- 4.1: Top Large Cap Stocks That Created a New All Time High Today
- 4.2: Top Mid Cap Stocks That Created a New All Time High Today
- 4.3: Top Small Cap Stocks That Created a New All Time High Today
Top Indices Performance Overview
| Stock | Close | Range |
|---|---|---|
| NIFTY 50 | ₹23,557.9 (0.39%) | ₹23,499.69 – ₹23,579.05 |
| NIFTY BANK | ₹50,440.89 (0.87%) | ₹49,900.19 – ₹50,562.14 |
| NIFTY FIN SERVICE | ₹22,595.9 (0.82%) | ₹22,356.4 – ₹22,632.94 |
| NIFTY IT | ₹34,827.5 (0.66%) | ₹34,665.39 – ₹34,917.39 |
| NIFTY AUTO | ₹25,715.19 (-0.03%) | ₹25,691.84 – ₹25,991.44 |
| NIFTY ENERGY | ₹41,303.89 (0.64%) | ₹41,093.14 – ₹41,343.55 |
Nifty 50 Performance Overview
The Nifty 50 started the day strong at ₹23,570.8, but didn’t stay there for long. The index took a bit of a dip, hitting a low of ₹23,499.69 before recovering and reaching a peak of ₹23,579.05. It ended the session on a positive note, closing at ₹23,557.9, up +0.39% for the day.
Take a look at the top gainers and losers for a deeper dive into today’s Nifty 50 performance.
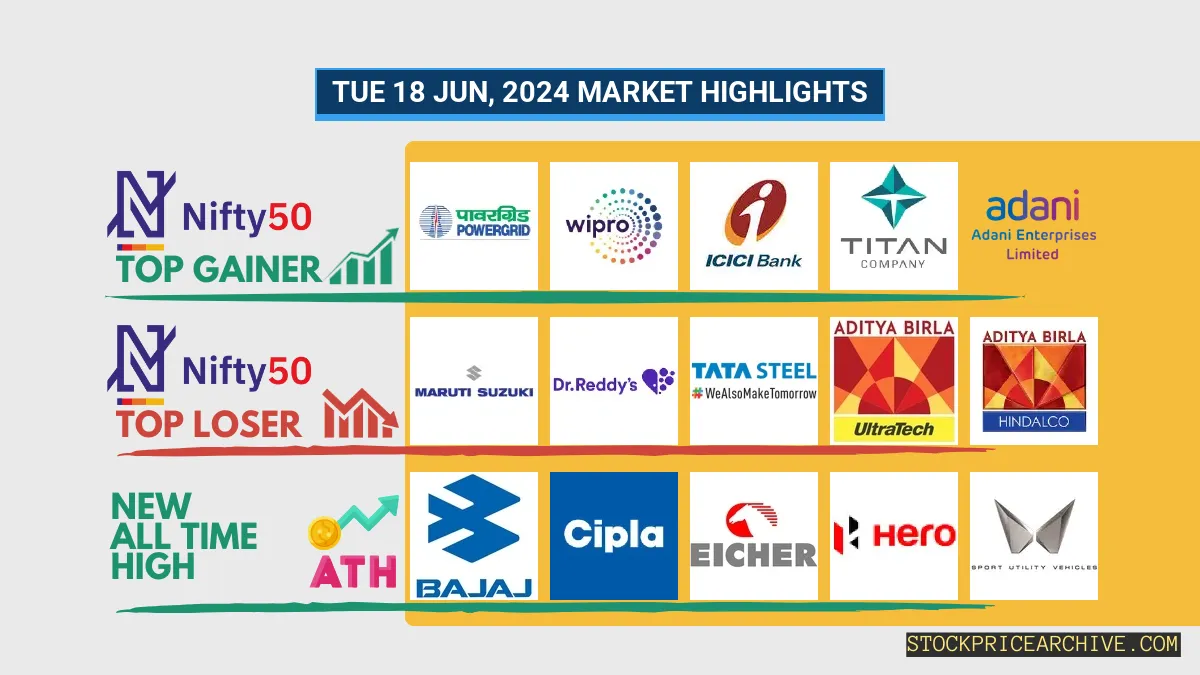
Nifty 50 Top Gainers
| Stock | Close | Range |
|---|---|---|
| Power Grid | ₹331.79 (3.2%) | ₹322 – ₹332.5 |
| WIPRO | ₹491.85 (3%) | ₹480.04 – ₹493 |
| ICICI BANK | ₹1,125.5 (1.79%) | ₹1,101.19 – ₹1,133.08 |
| TITAN | ₹3589 (1.66%) | ₹3538 – ₹3625 |
| Adani Enterprises | ₹3,310.94 (1.5%) | ₹3,287.19 – ₹3,344.6 |
Nifty 50 Top Losers
| Stock | Close | Range |
|---|---|---|
| Maruti Suzuki | ₹12,560.95 (-2.22%) | ₹12,542.04 – ₹12880 |
| Dr Reddy Lab | ₹5985 (-1.65%) | ₹5,980.04 – ₹6048 |
| Tata Steel | ₹181.12 (-1.11%) | ₹180.6 – ₹184.6 |
| UltraTech Cement | ₹11,119.04 (-1.11%) | ₹11,051.65 – ₹11,269.34 |
| Hindalco | ₹677.95 (-0.83%) | ₹677.79 – ₹688 |
Nifty 50 Stocks To Watch for Tomorrow
Apollo Hospitals: A Bullish Trend to Watch
- Performance Overview: Over the past 26 trading sessions, Apollo Hospitals has closed higher 17 times and lower 9 times.
- Recent Trend: This stock has been on a roll! It’s been closing higher for the past nine days, with no red days since Tuesday, June 4th, 2024.
- Returns: Apollo Hospitals has delivered a solid 6.65% return over the past 26 trading days. That means an investment of ₹10,000 would have grown to ₹10,665.
- Financial Snapshot: In the last 12 months, Apollo Hospitals generated impressive revenue of ₹19,059.19 Crore and a profit of ₹898.6 Crore.
- As of Tuesday, June 18th, 2024, Apollo Hospitals has a market capitalization of ₹88,877.81 Crore.
- The Bottom Line: Apollo Hospitals is displaying a strong bullish trend. It’s worth keeping an eye on its price movements to see what the future holds. For both short-term and long-term growth prospects, consider checking out these resources: Apollo Hospitals Target for Tomorrow and Apollo Hospitals Targets for 2024 & 2025.
Apollo Hospitals Financial Performance
| Metric | Value | Description |
|---|---|---|
| Market Capital | 88,877.81 Crore | Market valuation of Apollo Hospitals’s shares. |
| Revenue (TTM) | 19,059.19 Crore | Total revenue generated by Apollo Hospitals over the past twelve months. |
| Net Income (TTM) | +898.6 Crore | Net Profit or Loss after all the expenses over the past twelve months. |
| Operating Margin | 9.11% | Income from operations as a percentage of revenue, before taxes and interest. |
| Profit Margin | 4.71% | Net income as a percentage of revenue, after all expenses. |
| Revenue Growth (Quarterly) | +14.89% | Change in revenue compared to the previous quarter. |
| Earnings Growth (YOY Quarterly) | +75.59% | Change in earnings compared to the same quarter last year. |
| Debt-to-Equity (D/E) Ratio | 72.84 | Company’s total debt divided by total shareholder equity. |
| Total Debt | 5,332.6 Crore | Sum of Apollo Hospitals’s current & long-term financial obligations. |
| Total Cash | 1,617.79 Crore | Total amount of liquid funds available to Apollo Hospitals. |
| Beta | 0.56 | Beta is less than 1 indicating that the Apollo Hospitals’s price is less volatile than the market. |
➲ Maruti Suzuki (Bearish Trend)
- Performance Snapshot: Over the past 26 trading sessions, Maruti Suzuki has closed lower 15 times and higher 11 times.
- Recent Activity: Maruti Suzuki has been on a 4-day downward trend, closing lower each day since Tuesday, June 11th, 2024.
- Returns: Maruti Suzuki has generated a -0.93% return over the past 26 trading sessions. This means a ₹10,000 investment in Maruti Suzuki would have been worth ₹9,907 during this period.
- Financial Highlights: Over the past 12 months, Maruti Suzuki has generated revenue of ₹1,41,858.2 Crore and recorded a profit of ₹13,488.2 Crore.
- As of Tuesday, June 18th, 2024, Maruti Suzuki has a Market Capitalization of ₹4,03,856.94 Crore.
- Summary: Maruti Suzuki is currently experiencing a bearish trend. It’s wise for investors to monitor its performance closely, especially its potential direction in the near future. You can check out Maruti Suzuki’s Target for Tomorrow and Maruti Suzuki’s Targets for 2024 & 2025 to get a better understanding.
Maruti Suzuki Financial Performance
| Metric | Value | Description |
|---|---|---|
| Market Capital | 4,03,856.94 Crore | Market valuation of Maruti Suzuki’s shares. |
| Revenue (TTM) | 1,41,858.2 Crore | Total revenue generated by Maruti Suzuki over the past twelve months. |
| Net Income (TTM) | +13,488.2 Crore | Net Profit or Loss after all the expenses over the past twelve months. |
| Operating Margin | 10.19% | Income from operations as a percentage of revenue, before taxes and interest. |
| Profit Margin | 9.5% | Net income as a percentage of revenue, after all expenses. |
| Revenue Growth (Quarterly) | +20% | Change in revenue compared to the previous quarter. |
| Earnings Growth (YOY Quarterly) | +48% | Change in earnings compared to the same quarter last year. |
| Debt-to-Equity (D/E) Ratio | 0.13 | Company’s total debt divided by total shareholder equity. |
| Total Debt | 118.6 Crore | Sum of Maruti Suzuki’s current & long-term financial obligations. |
| Total Cash | 6,735.3 Crore | Total amount of liquid funds available to Maruti Suzuki. |
| Beta | 0.59 | Beta is less than 1 indicating that the Maruti Suzuki’s price is less volatile than the market. |
Nifty 500 Performance Overview
The Nifty 500 started the day at ₹22,318.09, showing a bit of a rollercoaster ride. It dipped to a low of ₹22,254.5 before climbing to a high of ₹22,338.09. The day ended on a positive note, closing at ₹22,330.84, up 0.52%.
This movement was influenced by strong performances from some stocks and weaker showings from others, which you can see in the table below.
Nifty 500 Top Gainers
| Stock | Close | Range |
|---|---|---|
| Fertilisers & Chemicals Travancore | ₹859.84 (10.25%) | ₹772.09 – ₹885 |
| Cochin Shipyard | ₹2,334.55 (9.99%) | ₹2,135.75 – ₹2,334.55 |
| MMTC | ₹83.83 (9.94%) | ₹75.56 – ₹85.82 |
| Metro Brands | ₹1255 (9.11%) | ₹1155 – ₹1,261.25 |
| Asahi Glass | ₹673 (8.53%) | ₹622.79 – ₹673 |
Nifty 500 Top Losers
| Stock | Close | Range |
|---|---|---|
| Chemplast Sanmar | ₹593 (-4.59%) | ₹591.7 – ₹623.59 |
| KNR Constructions | ₹372.04 (-4.29%) | ₹370 – ₹394.7 |
| kpil | ₹1168 (-4.28%) | ₹1157 – ₹1,254.94 |
| Gujarat Ambuja Exports | ₹142.66 (-3.83%) | ₹140.5 – ₹149.63 |
| Sumitomo Chemical India | ₹478.64 (-3.8%) | ₹476.29 – ₹510.75 |
Nifty 51 to 500 Stocks To Watch for Tomorrow
➲ Bharat Electronics (Strong Bullish Trend)
- Performance Overview: Over the last 26 trading days, Bharat Electronics has closed higher 21 times and lower 5 times.
- Recent Trend: Bharat Electronics has been on a roll, closing higher for the past 9 consecutive trading days – a strong sign of positive momentum! This streak started on Tuesday, June 4, 2024.
- Returns: In the past 26 trading sessions, Bharat Electronics has delivered impressive returns of 40.03%. That means a ₹10,000 investment in the stock would have grown to ₹14,003.
- Financial Insight: Over the past year, Bharat Electronics has generated revenue of ₹20,268.24 Crore, a significant figure! The company also generated a profit of ₹3,984.51 Crore during the same period, demonstrating its profitability.
- As of Tuesday, June 18, 2024, Bharat Electronics has a Market Capital of ₹2,26,383.88 Crore, reflecting its substantial size and market value.
- Summary: Bharat Electronics is displaying a robust bullish pattern, making it a stock worth watching. To stay informed about its short-term and long-term potential, you can check out the following resources: Checkout Bharat Electronics Target for Tomorrow and Bharat Electronics Targets for 2024 & 2025.
Bharat Electronics Financial Performance
| Metric | Value | Description |
|---|---|---|
| Market Capital | 2,26,383.88 Crore | Market valuation of Bharat Electronics’s shares. |
| Revenue (TTM) | 20,268.24 Crore | Total revenue generated by Bharat Electronics over the past twelve months. |
| Net Income (TTM) | +3,984.51 Crore | Net Profit or Loss after all the expenses over the past twelve months. |
| Operating Margin | 25.32% | Income from operations as a percentage of revenue, before taxes and interest. |
| Profit Margin | 19.65% | Net income as a percentage of revenue, after all expenses. |
| Revenue Growth (Quarterly) | +32.2% | Change in revenue compared to the previous quarter. |
| Earnings Growth (YOY Quarterly) | +30% | Change in earnings compared to the same quarter last year. |
| Debt-to-Equity (D/E) Ratio | 0.38 | Company’s total debt divided by total shareholder equity. |
| Total Debt | 62.51 Crore | Sum of Bharat Electronics’s current & long-term financial obligations. |
| Total Cash | 11,056.59 Crore | Total amount of liquid funds available to Bharat Electronics. |
| Beta | 0.49 | Beta is less than 1 indicating that the Bharat Electronics’s price is less volatile than the market. |
➲ Finolex Industries/Pipe (Bearish Trend)
- Performance Snapshot: Over the past 26 trading days, Finolex Industries/Pipe closed higher on 13 occasions and lower on 13 others. This suggests a relatively balanced performance in recent weeks.
- Current Trend: Finolex Industries/Pipe has been on a downward slide, closing lower for six consecutive trading days, starting from Friday, June 7th, 2024.
- Returns: During this period, Finolex Industries/Pipe delivered a total return of 22.14%. This means an initial investment of ₹10,000 would have grown to ₹12,214.
- Financial Highlights: In the last twelve months, Bharat Electronics generated a revenue of ₹4,317.43 Crore and recorded a profit of ₹473.59 Crore.
- As of Tuesday, June 18th, 2024, Bharat Electronics has a Market Capitalization of ₹20,528.92 Crore.
- Summary: Finolex Industries/Pipe is currently in a bearish phase, indicating a downward trend. We encourage investors to closely monitor its performance, particularly considering Finolex Industries/Pipe Target for Tomorrow and Finolex Industries/Pipe Targets for 2024 & 2025.
Finolex Industries/Pipe Financial Performance
| Metric | Value | Description |
|---|---|---|
| Market Capital | 20,528.92 Crore | Market valuation of Finolex Industries/Pipe’s shares. |
| Revenue (TTM) | 4,317.43 Crore | Total revenue generated by Finolex Industries/Pipe over the past twelve months. |
| Net Income (TTM) | +473.59 Crore | Net Profit or Loss after all the expenses over the past twelve months. |
| Operating Margin | 14.75% | Income from operations as a percentage of revenue, before taxes and interest. |
| Profit Margin | 10.96% | Net income as a percentage of revenue, after all expenses. |
| Revenue Growth (Quarterly) | +8.3% | Change in revenue compared to the previous quarter. |
| Earnings Growth (YOY Quarterly) | -1.4% | Change in earnings compared to the same quarter last year. |
| Debt-to-Equity (D/E) Ratio | 6.99 | Company’s total debt divided by total shareholder equity. |
| Total Debt | 393.95 Crore | Sum of Finolex Industries/Pipe’s current & long-term financial obligations. |
| Total Cash | 1,936.79 Crore | Total amount of liquid funds available to Finolex Industries/Pipe. |
| Beta | 0.73 | Beta is less than 1 indicating that the Finolex Industries/Pipe’s price is less volatile than the market. |
Top Stocks That Created a New All Time High Today
Top Large Cap Stocks That Created a New All Time High Today
Companies with Market Capital more than 20,000 Crores| Stock | Close | New All-Time High (ATH) | Previous ATH | Previous ATH Date |
|---|---|---|---|---|
| Bajaj Auto | 9920.00 (-0.42%) | 10036.84 (+%) | Thu 01 Jan 1970 | |
| Balkrishna Industries | 3343.60 (+3.17%) | 3361.94 (+%) | Thu 01 Jan 1970 | |
| BASF | 4972.00 (+0.38%) | 5089.79 (+%) | Thu 01 Jan 1970 | |
| Bharti Hexacom | 1157.00 (+7.39%) | 1174.50 (+%) | Thu 01 Jan 1970 | |
| Blue Star | 1729.09 (-0.42%) | 1797.90 (+%) | Thu 01 Jan 1970 |
Top Mid Cap Stocks That Created a New All Time High Today
Companies with Market Capital between 5,000 Crores to 20,000 Crores| Stock | Close | New All-Time High (ATH) | Previous ATH | Previous ATH Date |
|---|---|---|---|---|
| Aarti Pharmalabs | 642.84 (+6.05%) | 642.84 (+%) | Thu 01 Jan 1970 | |
| Astra Microwave Products | 1024.00 (+6.07%) | 1059.00 (+47.04%) | 720.20 | Tue 23 Apr 2024 |
| Aurionpro Solutions | 2820.00 (+4.69%) | 2828.14 (+5.35%) | 2684.45 | Mon 01 Apr 2024 |
| Azad Engineering | 1887.44 (+3.7%) | 1887.44 (+%) | Thu 01 Jan 1970 | |
| BEML | 4697.64 (-0.4%) | 4847.85 (+%) | Thu 01 Jan 1970 |
Top Small Cap Stocks That Created a New All Time High Today
Companies with Market Capital less than 5,000 Crores| Stock | Close | New All-Time High (ATH) | Previous ATH | Previous ATH Date |
|---|---|---|---|---|
| ACGL | 2461.55 (+1.06%) | 2498.80 (+%) | Thu 01 Jan 1970 | |
| ADC India Communications | 1529.44 (+8.23%) | 1550.00 (+%) | Thu 01 Jan 1970 | |
| Advait Infratech | 1849.00 (-2.64%) | 1950.00 (+17.28%) | 1662.60 | Mon 01 Apr 2024 |
| Amba Enterprises | 258.50 (+8.31%) | 264.50 (+%) | Thu 01 Jan 1970 | |
| Automotive Stampings | 1035.00 (+6.08%) | 1043.90 (+%) | Thu 01 Jan 1970 |