Home / Tue 28 May 2024 Market Recap
28 May 2024: Nifty 50 closed at ₹22,867.69 (-0.29%), Divis Lab +2.99 & Adani Ports -2.25% – Top Stocks To Watch!
Show Table of Contents
Table of Contents
- 1: Top Indices Performance Overview
- 2: Nifty 50 Performance Overview
- 2.1: Nifty 50 Top Gainers
- 2.2: Nifty 50 Top Losers
- 2.3: Nifty 50 Stocks To Watch for Tomorrow
- 2.3.1: ➲ Divis Lab (Bullish Pattern)
- 2.3.2: ➲ Power Grid (Trading Bearish)
- 3: Nifty 500 Performance Overview
- 3.1: Nifty 500 Top Gainers
- 3.2: Nifty 500 Top Losers
- 3.3: Nifty 51 to 500 Stocks To Watch for Tomorrow
- 3.3.1: ➲ Sumitomo Chemical India (Bullish Pattern)
- 3.3.2: ➲ Narayana Hrudayalaya (Bearish Pattern)
- 4: Top Stocks That Created a New All Time High Today
- 4.1: Top Large Cap Stocks That Created a New All Time High Today
- 4.2: Top Mid Cap Stocks That Created a New All Time High Today
- 4.3: Top Small Cap Stocks That Created a New All Time High Today
Top Indices Performance Overview
| Stock | Close | Range |
|---|---|---|
| NIFTY 50 | ₹22,867.69 (-0.29%) | ₹22,860.55 – ₹22,998.3 |
| NIFTY BANK | ₹49,060.1 (-0.45%) | ₹49,045.39 – ₹49509 |
| NIFTY FIN SERVICE | ₹21,955.84 (-0.05%) | ₹21,917.09 – ₹22,054.15 |
| NIFTY IT | ₹33,834.6 (-0.48%) | ₹33,802.25 – ₹34,134.89 |
| NIFTY AUTO | ₹23,810.4 (-0.28%) | ₹23,764.3 – ₹23,978.44 |
| NIFTY ENERGY | ₹40,734.35 (-1.36%) | ₹40,731.35 – ₹41,500.6 |
Nifty 50 Performance Overview
The Nifty 50 opened at ₹22,976.55 and fluctuated during the day. It reached a low of ₹22,860.55 and a high of ₹22,998.3 before closing at ₹22,867.69, a (-0.29%) change.
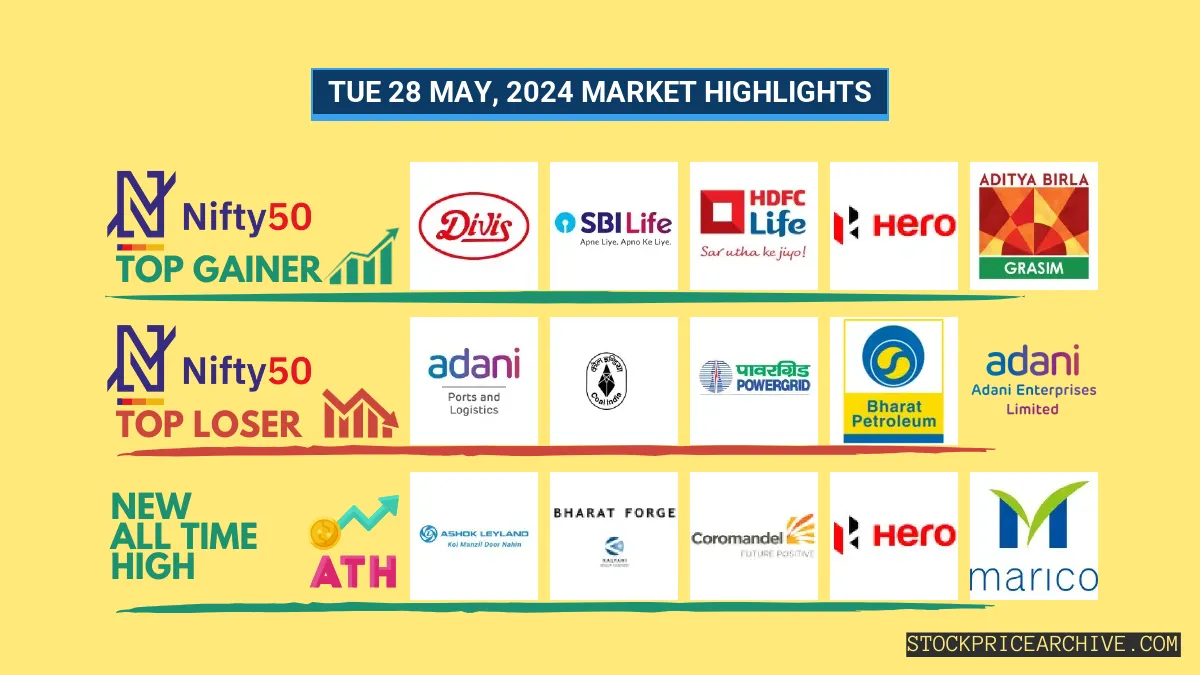
Nifty 50 Top Gainers
| Stock | Close | Range |
|---|---|---|
| Divis Lab | ₹4,382.75 (2.99%) | ₹4,245.6 – ₹4,400.1 |
| SBI Life Insurance | ₹1,450.84 (2.88%) | ₹1,405.9 – ₹1,454.94 |
| HDFC Life | ₹577.5 (2.34%) | ₹563.65 – ₹579.79 |
| Hero MotoCorp | ₹5185 (1.98%) | ₹5045 – ₹5225 |
| GRASIM | ₹2436 (1.89%) | ₹2,395.55 – ₹2,449.44 |
Nifty 50 Top Losers
| Stock | Close | Range |
|---|---|---|
| Adani Ports | ₹1,399.5 (-2.25%) | ₹1398 – ₹1,436.9 |
| Coal India | ₹486.39 (-1.64%) | ₹484.2 – ₹496 |
| Power Grid | ₹312.75 (-1.64%) | ₹312.04 – ₹319.04 |
| Bharat Petroleum | ₹645.65 (-1.59%) | ₹642.59 – ₹658.4 |
| Adani Enterprises | ₹3,236.85 (-1.59%) | ₹3,231.8 – ₹3,329.5 |
Nifty 50 Stocks To Watch for Tomorrow
➲ Divis Lab (Bullish Pattern)
- Performance Overview: For the past 26 trading sessions, Divis Lab has ended the day in green 17 times and in red 9 times.
- Recent Trend: Divis Lab is on a 7-day green streak, with no day closing in red since Fri 17 May 2024.
- Returns: Divis Lab has yielded a return of 18.78% over the last 26 trading sessions, meaning an investment of ₹10,000 would now be worth ₹11,878
- Financial Insights: Over the past 12 months, Divis Lab has generated revenue of ₹7,492.6 Crore and a profit of ₹1,383.37 Crore.
- As of Tue 28 May 2024, Divis Lab has a Market Capital of ₹1,09,436.93 Crore.
- Summary: Divis Lab shows a strong bullish pattern. Investors should keep an eye on its price movements for potential short-term and long-term growth opportunities. Check out Divis Lab Target for Tomorrow and Divis Lab Targets for 2024 & 2025.
Divis Lab Financial Performance
| Metric | Value | Description |
|---|---|---|
| Market Capital | 1,09,436.93 Crore | Market valuation of Divis Lab’s shares. |
| Revenue (TTM) | 7,492.6 Crore | Total revenue generated by Divis Lab over the past twelve months. |
| Net Income (TTM) | +1,383.37 Crore | Net Profit or Loss after all the expenses over the past twelve months. |
| Operating Margin | 21.24% | Income from operations as a percentage of revenue, before taxes and interest. |
| Profit Margin | 18.46% | Net income as a percentage of revenue, after all expenses. |
| Revenue Growth (Quarterly) | +8.6% | Change in revenue compared to the previous quarter. |
| Earnings Growth (YOY Quarterly) | +16.7% | Change in earnings compared to the same quarter last year. |
| Debt-to-Equity (D/E) Ratio | 0.03 | Company’s total debt divided by total shareholder equity. |
| Total Debt | 5 Crore | Sum of Divis Lab’s current & long-term financial obligations. |
| Total Cash | 3,611 Crore | Total amount of liquid funds available to Divis Lab. |
| Beta | 0.38 | Beta is less than 1 indicating that the Divis Lab’s price is less volatile than the market. |
➲ Power Grid (Trading Bearish)
- Performance Overview: In the last 26 trading sessions, Power Grid has closed in red more often, with 10 red days and 16 green days.
- Recent Trend: Power Grid has been on a 4-day red streak, without a single day closing in green since Wednesday, May 22, 2024.
- Returns: Power Grid delivered a 10.12% return in the last 26 trading sessions, which means an investment of ₹10,000 would have grown to ₹11,012.
- Financial Highlights: Over the past 12 months, Power Grid has generated a revenue of ₹45,843.1 Crore and a profit of ₹15,573.16 Crore.
- As of Tuesday, May 28, 2024, Power Grid has a Market Capitalization of ₹2,96,503.1 Crore.
- Outlook: Power Grid is currently experiencing a bearish phase. We recommend investors monitor it closely, particularly its short-term target for tomorrow and its targets for 2024 & 2025.
Power Grid Financial Performance
| Metric | Value | Description |
|---|---|---|
| Market Capital | 2,96,503.1 Crore | Market valuation of Power Grid’s shares. |
| Revenue (TTM) | 45,843.1 Crore | Total revenue generated by Power Grid over the past twelve months. |
| Net Income (TTM) | +15,573.16 Crore | Net Profit or Loss after all the expenses over the past twelve months. |
| Operating Margin | 57.1% | Income from operations as a percentage of revenue, before taxes and interest. |
| Profit Margin | 33.97% | Net income as a percentage of revenue, after all expenses. |
| Revenue Growth (Quarterly) | -2.3% | Change in revenue compared to the previous quarter. |
| Earnings Growth (YOY Quarterly) | -3.6% | Change in earnings compared to the same quarter last year. |
| Debt-to-Equity (D/E) Ratio | 145.82 | Company’s total debt divided by total shareholder equity. |
| Total Debt | 1,27,082.94 Crore | Sum of Power Grid’s current & long-term financial obligations. |
| Total Cash | 8,103.37 Crore | Total amount of liquid funds available to Power Grid. |
| Beta | 0.36 | Beta is less than 1 indicating that the Power Grid’s price is less volatile than the market. |
Nifty 500 Performance Overview
The Nifty 500 opened the day at ₹21,540.4 and experienced fluctuations throughout the session. It hit a low of ₹21,345.69 and reached a high of ₹21,557.59 before settling at a close of ₹21,363.34 (-0.61%).
The table below presents the top gainers and losers that influenced the Nifty 500’s movement today:
Nifty 500 Top Gainers
| Stock | Close | Range |
|---|---|---|
| 3M India | ₹34,255.05 (10.7%) | ₹30,295.65 – ₹34,531.55 |
| Prism Johnson | ₹156 (5.09%) | ₹146.69 – ₹159.05 |
| Brightcom Group | ₹10.5 (5%) | ₹10.5 – ₹10.5 |
| zfcvindia | ₹16986 (4.45%) | ₹15700 – ₹17,452.68 |
| Glaxosmithkline | ₹2457 (4.06%) | ₹2,371.94 – ₹2,498.89 |
Nifty 500 Top Losers
| Stock | Close | Range |
|---|---|---|
| Bharat Dynamics | ₹1,452.9 (-5.96%) | ₹1,431.25 – ₹1,544.84 |
| Elgi Equipments | ₹613.59 (-5.95%) | ₹609.09 – ₹636.25 |
| Affle | ₹1,188.44 (-5.12%) | ₹1,182.05 – ₹1260 |
| Housing & Urban Development Corp | ₹249.7 (-5.1%) | ₹248.8 – ₹264.64 |
| Borosil Renwables | ₹481 (-5.04%) | ₹479.75 – ₹506.5 |
Nifty 51 to 500 Stocks To Watch for Tomorrow
➲ Sumitomo Chemical India (Bullish Pattern)
- Performance Overview: In the last 26 trading sessions, Sumitomo Chemical India has been on a positive trajectory, closing in the green 14 times and in the red 12 times.
- Positive Momentum: Notably, Sumitomo Chemical India has been riding a 6-day green streak, with no red days since Saturday, May 18, 2024.
- Returns: Investors who invested in Sumitomo Chemical India during the last 26 trading sessions have seen a 9.49% return on their investment. This means that an investment of ₹10,000 would have grown to ₹10,949 during this period.
- Financial Performance: Over the past 12 months, Sumitomo Chemical India has shown strong financial performance, generating a revenue of ₹2,821.31 Crore and a profit of ₹331.96 Crore.
- As of Tuesday, May 28, 2024, Sumitomo Chemical India has a Market Capitalization of ₹21,977.39 Crore.
- Summary: Sumitomo Chemical India exhibits a robust bullish pattern, indicating potential for growth. Investors should monitor its price movements to identify opportunities for both short-term and long-term investment strategies.
Sumitomo Chemical India Financial Performance
| Metric | Value | Description |
|---|---|---|
| Market Capital | 21,977.39 Crore | Market valuation of Sumitomo Chemical India’s shares. |
| Revenue (TTM) | 2,821.31 Crore | Total revenue generated by Sumitomo Chemical India over the past twelve months. |
| Net Income (TTM) | +331.96 Crore | Net Profit or Loss after all the expenses over the past twelve months. |
| Operating Margin | 9.16% | Income from operations as a percentage of revenue, before taxes and interest. |
| Profit Margin | 11.76% | Net income as a percentage of revenue, after all expenses. |
| Revenue Growth (Quarterly) | -28.1% | Change in revenue compared to the previous quarter. |
| Earnings Growth (YOY Quarterly) | -39.5% | Change in earnings compared to the same quarter last year. |
| Debt-to-Equity (D/E) Ratio | 1.15 | Company’s total debt divided by total shareholder equity. |
| Total Debt | 29.06 Crore | Sum of Sumitomo Chemical India’s current & long-term financial obligations. |
| Total Cash | 1,406.99 Crore | Total amount of liquid funds available to Sumitomo Chemical India. |
| Beta | 0.41 | Beta is less than 1 indicating that the Sumitomo Chemical India’s price is less volatile than the market. |
➲ Narayana Hrudayalaya (Bearish Pattern)
- Performance Overview: In the past 26 trading sessions, Narayana Hrudayalaya has closed in red 15 times and in green 11 times.
- Recent Trend: Narayana Hrudayalaya has been on a 7-day red streak, without a single day closing in green since Friday, May 17th, 2024.
- Returns: Narayana Hrudayalaya gave a -3.89% returns in the last 26 trading sessions, meaning your investment of ₹10,000 would have become ₹9,611
- Financial Insight: Over the past 12 months, Narayana Hrudayalaya has generated a revenue of ₹4,968.79 Crore and created a profit of ₹771.69 Crore.
- As of Tuesday, May 28th, 2024, Narayana Hrudayalaya has a Market Capital of ₹25,443.35 Crore.
- Summary: Narayana Hrudayalaya is currently experiencing a bearish phase. We advise investors to keep a close watch, especially on Narayana Hrudayalaya Target for Tomorrow and Narayana Hrudayalaya Targets for 2024 & 2025.
Narayana Hrudayalaya Financial Performance
| Metric | Value | Description |
|---|---|---|
| Market Capital | 25,443.35 Crore | Market valuation of Narayana Hrudayalaya’s shares. |
| Revenue (TTM) | 4,968.79 Crore | Total revenue generated by Narayana Hrudayalaya over the past twelve months. |
| Net Income (TTM) | +771.69 Crore | Net Profit or Loss after all the expenses over the past twelve months. |
| Operating Margin | 17.92% | Income from operations as a percentage of revenue, before taxes and interest. |
| Profit Margin | 15.53% | Net income as a percentage of revenue, after all expenses. |
| Revenue Growth (Quarterly) | +6.7% | Change in revenue compared to the previous quarter. |
| Earnings Growth (YOY Quarterly) | +22.3% | Change in earnings compared to the same quarter last year. |
| Debt-to-Equity (D/E) Ratio | 42.83 | Company’s total debt divided by total shareholder equity. |
| Total Debt | 1,072.2 Crore | Sum of Narayana Hrudayalaya’s current & long-term financial obligations. |
| Total Cash | 871.9 Crore | Total amount of liquid funds available to Narayana Hrudayalaya. |
| Beta | 0.38 | Beta is less than 1 indicating that the Narayana Hrudayalaya’s price is less volatile than the market. |
Top Stocks That Created a New All Time High Today
Top Large Cap Stocks That Created a New All Time High Today
Companies with Market Capital more than 20,000 Crores| Stock | Close | New All-Time High (ATH) | Previous ATH | Previous ATH Date |
|---|---|---|---|---|
| Aegis Logistics | 750.20 (+0.74%) | 781.00 (+40.98%) | 553.95 | Thu 18 Apr 2024 |
| Ashok Leyland | 226.89 (+0.08%) | 230.75 (+%) | Thu 01 Jan 1970 | |
| Bharat Forge | 1564.44 (-0.49%) | 1599.75 (+%) | Thu 01 Jan 1970 | |
| Coromandel International | 1296.80 (+4.03%) | 1298.94 (+%) | Thu 01 Jan 1970 | |
| Exide | 508.79 (+2.92%) | 517.25 (+9.96%) | 470.39 | Tue 16 Apr 2024 |
Top Mid Cap Stocks That Created a New All Time High Today
Companies with Market Capital between 5,000 Crores to 20,000 Crores| Stock | Close | New All-Time High (ATH) | Previous ATH | Previous ATH Date |
|---|---|---|---|---|
| Amara Raja Batteries | 1243.59 (+1.52%) | 1276.05 (+13.12%) | 1128.00 | Tue 25 Aug 2015 |
| Arvind | 364.00 (+4.02%) | 390.00 (+17.19%) | 332.79 | Tue 23 Apr 2024 |
| DOMS Industries | 1953.90 (+5.63%) | 2035.00 (+10.23%) | 1846.00 | Mon 01 Apr 2024 |
| Happy Forgings | 1102.34 (+0.13%) | 1140.00 (+%) | Thu 01 Jan 1970 | |
| UCIL | 96.67 (+1.99%) | 96.67 (+%) | Thu 01 Jan 1970 |
Top Small Cap Stocks That Created a New All Time High Today
Companies with Market Capital less than 5,000 Crores| Stock | Close | New All-Time High (ATH) | Previous ATH | Previous ATH Date |
|---|---|---|---|---|
| Ace Software Exports | 197.10 (+1.99%) | 197.10 (+31.15%) | 150.28 | Mon 01 Apr 2024 |
| Ahmedabad Steelcraft | 66.88 (+4.99%) | 66.88 (+%) | Thu 01 Jan 1970 | |
| A.K. Spintex | 173.45 (+2.9%) | 176.00 (+%) | Thu 01 Jan 1970 | |
| AMBO AGRITEC LIMITED | 81.02 (+4.98%) | 81.02 (+%) | Thu 01 Jan 1970 | |
| Automotive Stampings | 872.00 (-2.74%) | 956.34 (+%) | Thu 01 Jan 1970 |