Home / Wed 29 May 2024 Market Recap
29 May 2024: Nifty 50 Closes at ₹22,705 (-0.81%), Divis Lab Surges on 8-Day Green Streak, ICICI Bank Dips – Explore Top Gainers & Losers
Show Table of Contents
Table of Contents
- 1: Top Indices Performance Overview
- 2: Nifty 50 Performance Overview
- 2.1: Nifty 50 Top Gainers
- 2.2: Nifty 50 Top Losers
- 2.3: Nifty 50 Stocks To Watch for Tomorrow
- 2.3.1: ➲ Divis Lab (Bullish Pattern)
- 2.3.2: ➲ ICICI BANK (Bearish Pattern)
- 3: Nifty 500 Performance Overview
- 3.1: Nifty 500 Top Gainers
- 3.2: Nifty 500 Top Losers
- 3.3: Nifty 51 to 500 Stocks To Watch for Tomorrow
- 3.3.1: ➲ Sumitomo Chemical India (Bullish Pattern)
- 3.3.2: ➲ Narayana Hrudayalaya (Bearish Pattern)
- 4: Top Stocks That Created a New All Time High Today
- 4.1: Top Large Cap Stocks That Created a New All Time High Today
- 4.2: Top Mid Cap Stocks That Created a New All Time High Today
- 4.3: Top Small Cap Stocks That Created a New All Time High Today
Top Indices Performance Overview
| Stock | Close | Range |
|---|---|---|
| NIFTY 50 | ₹22705 (-0.81%) | ₹22,687.09 – ₹22,824.05 |
| NIFTY BANK | ₹48,575.85 (-1.16%) | ₹48,402.55 – ₹48,999.3 |
| NIFTY FIN SERVICE | ₹21,640.3 (-1.56%) | ₹21,594.09 – ₹21,908.75 |
| NIFTY IT | ₹33,528.85 (-1.04%) | ₹33,515.14 – ₹33,875.39 |
| NIFTY AUTO | ₹23,741.59 (-0.31%) | ₹23,567.15 – ₹23,804.69 |
| NIFTY ENERGY | ₹40,594.35 (-0.5%) | ₹40,413.94 – ₹40834 |
Nifty 50 Performance Overview
The Nifty 50 commenced trading at ₹22,778.5 and experienced fluctuations throughout the session. It reached a maximum value of ₹22,824.05 and a minimum value of ₹22,687.09, before concluding at ₹22,705 (-0.81%).
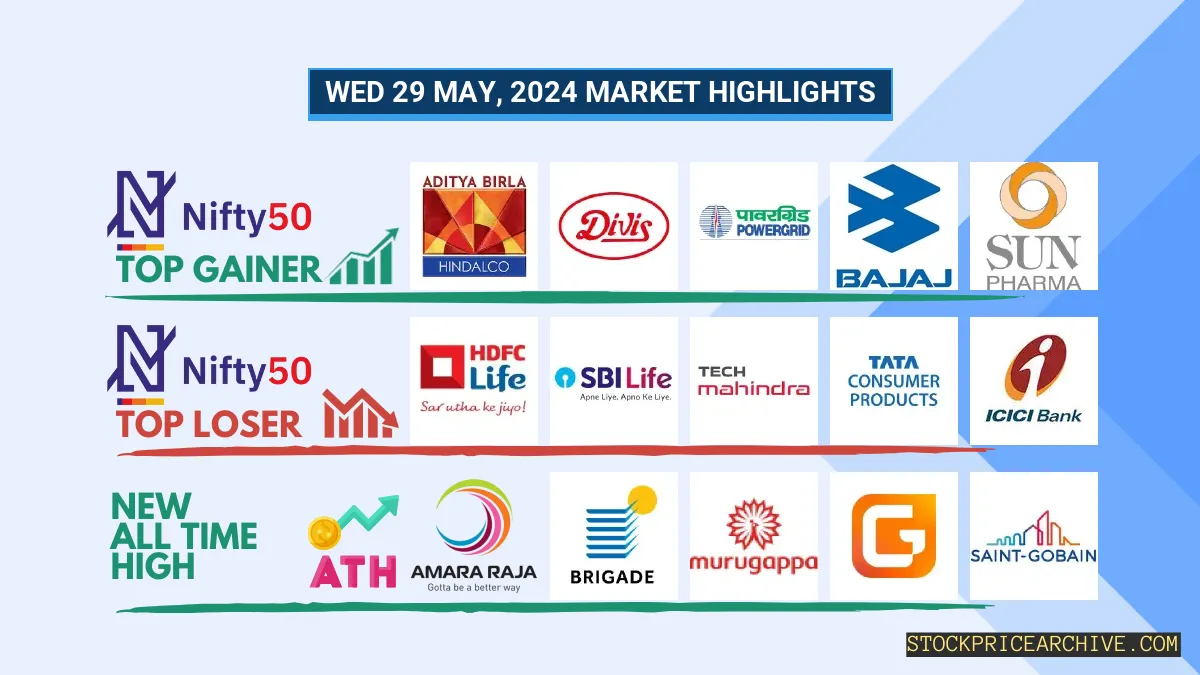
Nifty 50 Top Gainers
| Stock | Close | Range |
|---|---|---|
| Hindalco | ₹704.54 (3.41%) | ₹683.4 – ₹713.4 |
| Divis Lab | ₹4465 (1.65%) | ₹4360 – ₹4466 |
| Power Grid | ₹317.6 (1.53%) | ₹309.7 – ₹318.64 |
| Bajaj Auto | ₹9085 (1.05%) | ₹8,902.75 – ₹9,139.2 |
| Sun Pharma | ₹1,478.94 (0.95%) | ₹1,465.69 – ₹1495 |
Nifty 50 Top Losers
| Stock | Close | Range |
|---|---|---|
| HDFC Life | ₹561.7 (-2.9%) | ₹560.9 – ₹578.2 |
| SBI Life Insurance | ₹1,413.4 (-2.58%) | ₹1,406.59 – ₹1,447.65 |
| Tech Mahindra | ₹1,286.8 (-2.16%) | ₹1,284.3 – ₹1,313.44 |
| Tata Consumer Products | ₹1072 (-2.15%) | ₹1,068.25 – ₹1,089.05 |
| ICICI BANK | ₹1104 (-2.04%) | ₹1,098.58 – ₹1,123.5 |
Nifty 50 Stocks To Watch for Tomorrow
➲ Divis Lab (Bullish Pattern)
- Performance Overview: In the last 26 trading sessions, Divis Lab has closed in green 17 times and in red 9 times.
- Recent Trend: Divis Lab has been on a 8-day green streak, without a single day closing in red since Fri 17 May 2024.
- Returns: Divis Lab gave a 19.46% returns in the last 26 trading sessions, that means your investment of ₹10,000 would have become ₹11,945.99
- Financial Insight: Over the past 12 months, Divis Lab has generated a renvenue of ₹7,492.6 Crore and created a profit of ₹1,383.37 Crore.
- As of Wed 29 May 2024, Divis Lab has a Market Capital of ₹1,09,436.93 Crore.
- Summary: Divis Lab exhibits a robust bullish pattern. Investors should monitor its price movements targets for both short-term and long-term growth prospects: Checkout Divis Lab Target for Tomorrow and Divis Lab Targets for 2024 & 2025.
Divis Lab Financial Performance
| Metric | Value | Description |
|---|---|---|
| Market Capital | 1,09,436.93 Crore | Market valuation of Divis Lab’s shares. |
| Revenue (TTM) | 7,492.6 Crore | Total revenue generated by Divis Lab over the past twelve months. |
| Net Income (TTM) | +1,383.37 Crore | Net Profit or Loss after all the expenses over the past twelve months. |
| Operating Margin | 21.24% | Income from operations as a percentage of revenue, before taxes and interest. |
| Profit Margin | 18.46% | Net income as a percentage of revenue, after all expenses. |
| Revenue Growth (Quarterly) | +8.6% | Change in revenue compared to the previous quarter. |
| Earnings Growth (YOY Quarterly) | +16.7% | Change in earnings compared to the same quarter last year. |
| Debt-to-Equity (D/E) Ratio | 0.03 | Company’s total debt divided by total shareholder equity. |
| Total Debt | 5 Crore | Sum of Divis Lab’s current & long-term financial obligations. |
| Total Cash | 3,611 Crore | Total amount of liquid funds available to Divis Lab. |
| Beta | 0.38 | Beta is less than 1 indicating that the Divis Lab’s price is less volatile than the market. |
➲ ICICI BANK (Bearish Pattern)
- Performance Overview: In the last 26 trading sessions, ICICI BANK has closed in the red 14 times and in the green 12 times.
- Recent Trend: ICICI BANK has been on a 4-day red streak , without a single day closing in green since Thu 23 May 2024 .
- Returns: ICICI BANK gave a 0.36% returns in the last 26 trading sessions, that means your investment of ₹10,000 would have become ₹10,036
- Financial Insight: Over the past 12 months, ICICI BANK has generated a revenue of ₹1,58,217.15 Crore and created a profit of ₹44,256.36 Crore .
- As of Wed 29 May 2024, ICICI BANK has a Market Capital of ₹7,95,715.56 Crore .
- Summary: ICICI BANK is currently experiencing a bearish phase. We advise investors to keep a close watch, especially on ICICI BANK Target for Tomorrow and ICICI BANK Targets for 2024 & 2025.
ICICI BANK Financial Performance
| Metric | Value | Description |
|---|---|---|
| Market Capital | 7,95,715.56 Crore | Market valuation of ICICI BANK’s shares. |
| Revenue (TTM) | 1,58,217.15 Crore | Total revenue generated by ICICI BANK over the past twelve months. |
| Net Income (TTM) | +44,256.36 Crore | Net Profit or Loss after all the expenses over the past twelve months. |
| Operating Margin | 35.07% | Income from operations as a percentage of revenue, before taxes and interest. |
| Profit Margin | 27.97% | Net income as a percentage of revenue, after all expenses. |
| Revenue Growth (Quarterly) | +77.6% | Change in revenue compared to the previous quarter. |
| Earnings Growth (YOY Quarterly) | +18.5% | Change in earnings compared to the same quarter last year. |
| Debt-to-Equity (D/E) Ratio | 0.82 | Company’s total debt divided by total shareholder equity. |
| Total Debt | 2,07,427.99 Crore | Sum of ICICI BANK’s current & long-term financial obligations. |
| Total Cash | 1,62,768.9 Crore | Total amount of liquid funds available to ICICI BANK. |
| Beta | 0.81 | Beta is less than 1 indicating that the ICICI BANK’s price is less volatile than the market. |
Nifty 500 Performance Overview
The Nifty 500 commenced the trading day at ₹21,288.8. It oscillated between an intraday low of ₹21,243.75 and a high of ₹21,355.8 before closing at ₹21,252.19 (-0.64%).
The following table presents the top gainers and losers that significantly influenced the Nifty 500’s movement on that day.
Nifty 500 Top Gainers
| Stock | Close | Range |
|---|---|---|
| Campus | ₹293.79 (17.37%) | ₹252.1 – ₹300 |
| Mazagoan Dock Shipbuilders | ₹3375 (11.13%) | ₹2977 – ₹3,400.64 |
| Grindwell Norton | ₹2630 (9.97%) | ₹2,361.05 – ₹2630 |
| Sumitomo Chemical India | ₹488.5 (8.79%) | ₹449.85 – ₹497.89 |
| E.I.D. Parry | ₹687 (8.31%) | ₹634.59 – ₹693.5 |
Nifty 500 Top Losers
| Stock | Close | Range |
|---|---|---|
| MTAR Technologies | ₹1844 (-10.6%) | ₹1,799.94 – ₹1,905.15 |
| PNB Housing Finance | ₹735 (-6.71%) | ₹725 – ₹750.9 |
| Ujjivan Small Finance Bank | ₹50.4 (-5%) | ₹50 – ₹51.35 |
| EPL | ₹180 (-4.87%) | ₹180 – ₹188.3 |
| zfcvindia | ₹16,424.05 (-4.31%) | ₹16,281.29 – ₹16,958.93 |
Nifty 51 to 500 Stocks To Watch for Tomorrow
➲ Sumitomo Chemical India (Bullish Pattern)
- Performance Snapshot: Over the past 26 trading sessions, Sumitomo Chemical India has recorded 14 green closes and 12 red closes.
- Recent Trend: Sumitomo Chemical India has been on a remarkable 7-day green streak, with no red closes since Saturday, May 18, 2024.
- Returns: Sumitomo Chemical India has delivered a solid 18.56% return over the last 26 trading sessions. This means that a hypothetical investment of ₹10,000 would have grown to ₹11,856.
- Financial Performance: In the past 12 months, Sumitomo Chemical India has reported a revenue of ₹2,821.31 Crore and a profit of ₹331.96 Crore.
- As of Wednesday, May 29, 2024, Sumitomo Chemical India boasts a substantial Market Capitalization of ₹21,977.39 Crore.
- Summary: Sumitomo Chemical India presents a promising bullish pattern. Investors should keep a close eye on its price movements to identify potential opportunities for growth, both in the short and long term. Check out our detailed analysis for Sumitomo Chemical India’s Target for Tomorrow and Sumitomo Chemical India’s Targets for 2024 & 2025.
Sumitomo Chemical India Financial Performance
| Metric | Value | Description |
|---|---|---|
| Market Capital | 21,977.39 Crore | Market valuation of Sumitomo Chemical India’s shares. |
| Revenue (TTM) | 2,821.31 Crore | Total revenue generated by Sumitomo Chemical India over the past twelve months. |
| Net Income (TTM) | +331.96 Crore | Net Profit or Loss after all the expenses over the past twelve months. |
| Operating Margin | 9.16% | Income from operations as a percentage of revenue, before taxes and interest. |
| Profit Margin | 11.76% | Net income as a percentage of revenue, after all expenses. |
| Revenue Growth (Quarterly) | -28.1% | Change in revenue compared to the previous quarter. |
| Earnings Growth (YOY Quarterly) | -39.5% | Change in earnings compared to the same quarter last year. |
| Debt-to-Equity (D/E) Ratio | 1.15 | Company’s total debt divided by total shareholder equity. |
| Total Debt | 29.06 Crore | Sum of Sumitomo Chemical India’s current & long-term financial obligations. |
| Total Cash | 1,406.99 Crore | Total amount of liquid funds available to Sumitomo Chemical India. |
| Beta | 0.41 | Beta is less than 1 indicating that the Sumitomo Chemical India’s price is less volatile than the market. |
➲ Narayana Hrudayalaya (Bearish Pattern)
- Performance Overview: Recently, Narayana Hrudayalaya has had more red days (16) than green days (10) in the past 26 trading sessions.
- Recent Trend: Narayana Hrudayalaya has been in a bearish phase, marked by an 8-day red streak since Friday, May 17, 2024, without a single green day.
- Returns: Narayana Hrudayalaya’s performance has been disappointing, delivering negative returns of -8.65% over the last 26 trading sessions. This means that an investment of ₹10,000 would now be worth only ₹9,135.
- Financial Insight: In the past 12 months, Narayana Hrudayalaya has reported revenue of ₹4,968.79 Crore and a profit of ₹771.69 Crore.
- As of Wednesday, May 29, 2024, Narayana Hrudayalaya has a Market Capital of ₹25,443.35 Crore.
- Summary: Narayana Hrudayalaya is currently facing a downtrend. Investors should monitor the situation closely, particularly Narayana Hrudayalaya’s Target for Tomorrow and Targets for 2024 & 2025.
Narayana Hrudayalaya Financial Performance
| Metric | Value | Description |
|---|---|---|
| Market Capital | 25,443.35 Crore | Market valuation of Narayana Hrudayalaya’s shares. |
| Revenue (TTM) | 4,968.79 Crore | Total revenue generated by Narayana Hrudayalaya over the past twelve months. |
| Net Income (TTM) | +771.69 Crore | Net Profit or Loss after all the expenses over the past twelve months. |
| Operating Margin | 17.92% | Income from operations as a percentage of revenue, before taxes and interest. |
| Profit Margin | 15.53% | Net income as a percentage of revenue, after all expenses. |
| Revenue Growth (Quarterly) | +6.7% | Change in revenue compared to the previous quarter. |
| Earnings Growth (YOY Quarterly) | +22.3% | Change in earnings compared to the same quarter last year. |
| Debt-to-Equity (D/E) Ratio | 42.83 | Company’s total debt divided by total shareholder equity. |
| Total Debt | 1,072.2 Crore | Sum of Narayana Hrudayalaya’s current & long-term financial obligations. |
| Total Cash | 871.9 Crore | Total amount of liquid funds available to Narayana Hrudayalaya. |
| Beta | 0.38 | Beta is less than 1 indicating that the Narayana Hrudayalaya’s price is less volatile than the market. |
Top Stocks That Created a New All Time High Today
Top Large Cap Stocks That Created a New All Time High Today
Companies with Market Capital more than 20,000 Crores| Stock | Close | New All-Time High (ATH) | Previous ATH | Previous ATH Date |
|---|---|---|---|---|
| ARE&M | 1211.65 (-2.89%) | 1278.00 (+6.5%) | 1200.00 | Mon 01 Apr 2024 |
| Brigade Enterprises | 1241.00 (+1.28%) | 1331.44 (+%) | Thu 01 Jan 1970 | |
| CEBBCO | 566.79 (+2.34%) | 578.84 (+33.43%) | 433.80 | Mon 01 Jan 2024 |
| Glaxosmithkline | 2530.00 (+1.99%) | 2565.94 (+%) | Thu 01 Jan 1970 | |
| Grindwell Norton | 2630.00 (+9.97%) | 2630.00 (+%) | Thu 01 Jan 1970 |
Top Mid Cap Stocks That Created a New All Time High Today
Companies with Market Capital between 5,000 Crores to 20,000 Crores| Stock | Close | New All-Time High (ATH) | Previous ATH | Previous ATH Date |
|---|---|---|---|---|
| Ahluwalia Contracts | 1380.00 (+6.98%) | 1382.00 (+%) | Thu 01 Jan 1970 | |
| Amara Raja Batteries | 1211.84 (-2.46%) | 1277.69 (+13.27%) | 1128.00 | Tue 25 Aug 2015 |
| E.I.D. Parry | 687.00 (+8.3%) | 693.50 (+%) | Thu 01 Jan 1970 | |
| ITD Cementation | 392.00 (-2.83%) | 418.00 (+8.08%) | 386.75 | Wed 24 Apr 2024 |
| Redtape | 718.00 (-1%) | 770.00 (+4.54%) | 736.54 | Tue 09 Apr 2024 |
Top Small Cap Stocks That Created a New All Time High Today
Companies with Market Capital less than 5,000 Crores| Stock | Close | New All-Time High (ATH) | Previous ATH | Previous ATH Date |
|---|---|---|---|---|
| Ace Software Exports | 201.00 (+1.97%) | 201.00 (+33.75%) | 150.28 | Mon 01 Apr 2024 |
| Ahmedabad Steelcraft | 68.20 (+1.98%) | 68.20 (+%) | Thu 01 Jan 1970 | |
| Allsec Technologies | 1100.00 (+4%) | 1100.00 (+%) | Thu 01 Jan 1970 | |
| AMBO AGRITEC LIMITED | 79.00 (-2.5%) | 85.00 (+%) | Thu 01 Jan 1970 | |
| BRADYM | 1302.65 (-5%) | 1439.75 (+%) | Thu 01 Jan 1970 |