Home / Mon 15 Jul 2024 Market Recap
15 Jul 2024: Nifty Closes at ₹24,584.75 (+0.33%), Dr Reddy’s Lab & Deepak Nitrite Shine, ICICI Bank & Chalet Hotels Face Pressure
Show Table of Contents
Table of Contents
- 1: Top Indices Performance Overview
- 2: Nifty 50 Performance Overview
- 2.1: Nifty 50 Top Gainers
- 2.2: Nifty 50 Top Losers
- 2.3: Nifty 50 Stocks To Watch for Tomorrow
- 2.3.1: Dr Reddy’s Lab: A Look at the Recent Bullish Trend
- 2.3.2: ➲ ICICI BANK (Bearish Pattern)
- 3: Nifty 500 Performance Overview
- 3.1: Nifty 500 Top Gainers
- 3.2: Nifty 500 Top Losers
- 3.3: Nifty 51 to 500 Stocks To Watch for Tomorrow
- 3.3.1: Deepak Nitrite: A Bullish Stock Worth Watching
- 3.3.2: ➲ Chalet Hotels (Bearish Pattern)
- 4: Top Stocks That Created a New All Time High Today
- 4.1: Top Large Cap Stocks That Created a New All Time High Today
- 4.2: Top Mid Cap Stocks That Created a New All Time High Today
- 4.3: Top Small Cap Stocks That Created a New All Time High Today
Top Indices Performance Overview
| Stock | Close | Range |
|---|---|---|
| NIFTY 50 | ₹24,584.75 (0.33%) | ₹24,522.75 – ₹24,635.05 |
| NIFTY BANK | ₹52,484.39 (0.39%) | ₹52154 – ₹52,662.25 |
| NIFTY FIN SERVICE | ₹23,704.19 (0.42%) | ₹23,557.59 – ₹23,774.8 |
| NIFTY IT | ₹38,911.35 (-0.29%) | ₹38,831.64 – ₹39567 |
| NIFTY AUTO | ₹25,419.8 (1.09%) | ₹25,191.15 – ₹25,451.09 |
| NIFTY ENERGY | ₹43303 (1.06%) | ₹42,796.94 – ₹43,362.1 |
Nifty 50 Performance Overview
The Nifty 50 started the day at ₹24,597.80, showing some lively action throughout the session. It dipped to a low of ₹24,522.75 before reaching a peak of ₹24,635.05. By the closing bell, it settled at ₹24,584.75, a +0.33% gain for the day.
Take a look at the table below to see the top gainers and losers that played a role in today’s Nifty 50 movement.
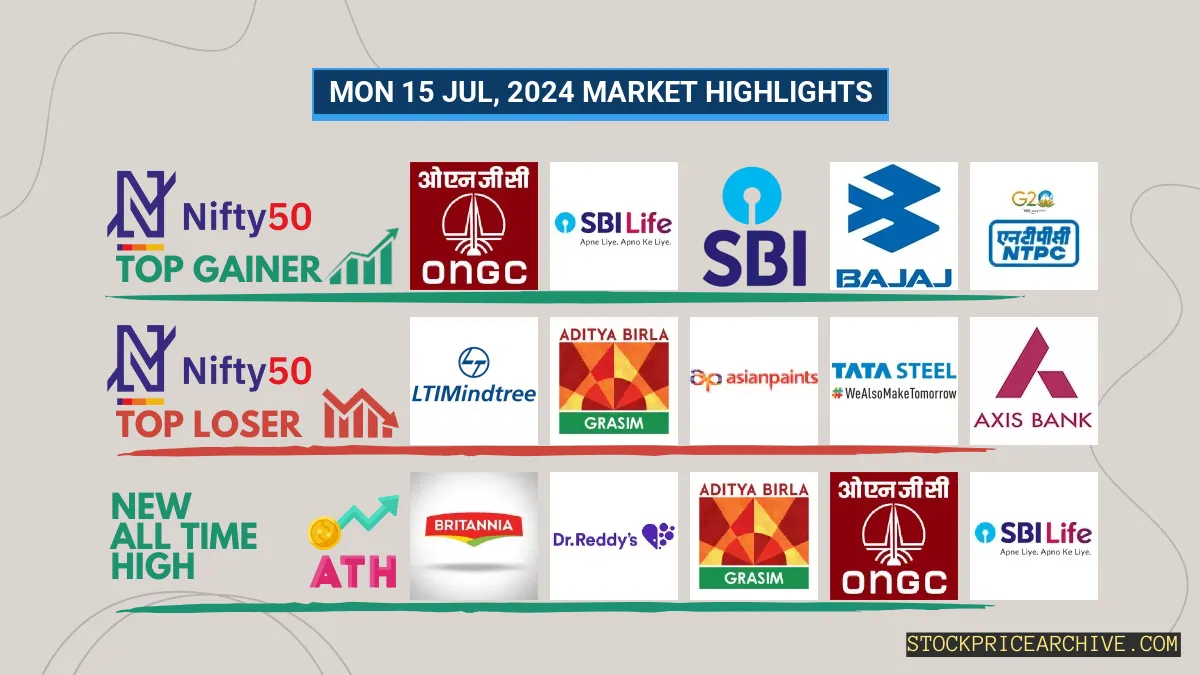
Nifty 50 Top Gainers
| Stock | Close | Range |
|---|---|---|
| ONGC | ₹322.85 (5.12%) | ₹308.64 – ₹323.64 |
| SBI Life Insurance | ₹1,613.44 (3.23%) | ₹1,557.9 – ₹1,620.9 |
| SBI | ₹882.45 (2.64%) | ₹859.7 – ₹887.34 |
| Bajaj Auto | ₹9,673.34 (2.57%) | ₹9,403.95 – ₹9,738.5 |
| NTPC | ₹385.54 (2.22%) | ₹376.89 – ₹388.95 |
Nifty 50 Top Losers
| Stock | Close | Range |
|---|---|---|
| LTIMindtree | ₹5,478.14 (-1.7%) | ₹5,460.54 – ₹5642 |
| GRASIM | ₹2,800.5 (-1.53%) | ₹2786 – ₹2,852.94 |
| Asian Paints | ₹2959 (-1.34%) | ₹2,932.55 – ₹2999 |
| Tata Steel | ₹166.75 (-1.16%) | ₹165.8 – ₹168.99 |
| Axis Bank | ₹1,307.44 (-0.75%) | ₹1305 – ₹1,324.4 |
Nifty 50 Stocks To Watch for Tomorrow
Dr Reddy’s Lab: A Look at the Recent Bullish Trend
- Performance Overview: Over the last 25 trading days, Dr Reddy’s Lab has closed higher than the previous day 19 times. This indicates a positive momentum for the stock.
- Recent Trend: Dr Reddy’s Lab has been on a roll, closing higher for the last 10 consecutive trading days, starting from Monday, July 1st, 2024.
- Returns: If you had invested ₹10,000 in Dr Reddy’s Lab during this period, you’d have seen a healthy 12.1% return, bringing your investment to ₹11,210.
- Financial Insight: Dr Reddy’s Lab has been doing well financially, generating a revenue of ₹27,916.39 Crore and a profit of ₹5,568.4 Crore over the last 12 months.
- As of Monday, July 15th, 2024, Dr Reddy’s Lab has a market capitalization of ₹1,09,852.05 Crore.
- Summary: Dr Reddy’s Lab is showing a strong bullish pattern. While past performance isn’t a guarantee of future results, the stock’s recent performance is promising. Keep an eye on its price movements and consider exploring both short-term and long-term growth opportunities. Checkout Dr Reddy’s Lab Target for Tomorrow and Dr Reddy’s Lab Targets for 2024 & 2025.
Dr Reddy Lab Financial Performance
| Metric | Value | Description |
|---|---|---|
| Market Capital | 1,09,852.05 Crore | Market valuation of Dr Reddy Lab’s shares. |
| Revenue (TTM) | 27,916.39 Crore | Total revenue generated by Dr Reddy Lab over the past twelve months. |
| Net Income (TTM) | +5,568.4 Crore | Net Profit or Loss after all the expenses over the past twelve months. |
| Operating Margin | 18.31% | Income from operations as a percentage of revenue, before taxes and interest. |
| Profit Margin | 19.94% | Net income as a percentage of revenue, after all expenses. |
| Revenue Growth (Quarterly) | +12.5% | Change in revenue compared to the previous quarter. |
| Earnings Growth (YOY Quarterly) | +36.29% | Change in earnings compared to the same quarter last year. |
| Debt-to-Equity (D/E) Ratio | 7.13 | Company’s total debt divided by total shareholder equity. |
| Total Debt | 2,002 Crore | Sum of Dr Reddy Lab’s current & long-term financial obligations. |
| Total Cash | 8,146.99 Crore | Total amount of liquid funds available to Dr Reddy Lab. |
| Beta | 0.34 | Beta is less than 1 indicating that the Dr Reddy Lab’s price is less volatile than the market. |
➲ ICICI BANK (Bearish Pattern)
- Performance Overview: In the last 25 trading sessions, ICICI BANK has closed lower 9 times and higher 16 times.
- Recent Trend: ICICI BANK has been on a 4-day losing streak, without a single day closing higher since Tuesday, July 9, 2024.
- Returns: ICICI BANK delivered a 10.2% return over the past 25 trading sessions, meaning an investment of ₹10,000 would have grown to ₹11,020.
- Financial Insight: Over the past 12 months, ICICI BANK has generated a revenue of ₹1,58,217.15 Crore and recorded a profit of ₹44,256.36 Crore.
- As of Monday, July 15, 2024, ICICI BANK has a Market Capital of ₹8,71,446.45 Crore.
- Summary: ICICI BANK is currently in a bearish phase. It’s wise to keep a close eye on the stock’s movement, particularly the ICICI BANK Target for Tomorrow and ICICI BANK Targets for 2024 & 2025.
ICICI BANK Financial Performance
| Metric | Value | Description |
|---|---|---|
| Market Capital | 8,71,446.45 Crore | Market valuation of ICICI BANK’s shares. |
| Revenue (TTM) | 1,58,217.15 Crore | Total revenue generated by ICICI BANK over the past twelve months. |
| Net Income (TTM) | +44,256.36 Crore | Net Profit or Loss after all the expenses over the past twelve months. |
| Operating Margin | 35.07% | Income from operations as a percentage of revenue, before taxes and interest. |
| Profit Margin | 27.97% | Net income as a percentage of revenue, after all expenses. |
| Revenue Growth (Quarterly) | +77.6% | Change in revenue compared to the previous quarter. |
| Earnings Growth (YOY Quarterly) | +18.5% | Change in earnings compared to the same quarter last year. |
| Debt-to-Equity (D/E) Ratio | 0.82 | Company’s total debt divided by total shareholder equity. |
| Total Debt | 2,07,427.99 Crore | Sum of ICICI BANK’s current & long-term financial obligations. |
| Total Cash | 1,62,768.9 Crore | Total amount of liquid funds available to ICICI BANK. |
| Beta | 0.86 | Beta is less than 1 indicating that the ICICI BANK’s price is less volatile than the market. |
Nifty 500 Performance Overview
The Nifty 500 opened the day at ₹23,188.8, showing a bit of a roller coaster ride throughout the session. It dipped to a low of ₹23,081.3 but climbed back up to a high of ₹23,234.3, before finally settling at a close of ₹23,209.84, (+0.49%) higher than where it started.
This movement was influenced by some strong performers and a few laggards, which we’ll explore further in the table below.
Nifty 500 Top Gainers
| Stock | Close | Range |
|---|---|---|
| Godfrey Phillips | ₹4,734.54 (16.69%) | ₹4100 – ₹4,821.29 |
| Indian Overseas Bank | ₹68.42 (7.46%) | ₹63.57 – ₹69.45 |
| MMTC | ₹95.2 (7.43%) | ₹86.5 – ₹98.5 |
| KSB | ₹5,036.7 (6.84%) | ₹4730 – ₹5300 |
| Lux Industries | ₹1,952.05 (6.63%) | ₹1,855.59 – ₹1969 |
Nifty 500 Top Losers
| Stock | Close | Range |
|---|---|---|
| Brightcom Group | ₹8.02 (-5.21%) | ₹8.02 – ₹8.02 |
| Sundaram Finance | ₹4250 (-4.52%) | ₹4215 – ₹4,458.7 |
| Brigade Enterprises | ₹1260 (-3.96%) | ₹1257 – ₹1,321.8 |
| Chalet Hotels | ₹789.9 (-3.93%) | ₹783 – ₹832.79 |
| Sobha | ₹1885 (-3.43%) | ₹1880 – ₹1,979.4 |
Nifty 51 to 500 Stocks To Watch for Tomorrow
Deepak Nitrite: A Bullish Stock Worth Watching
- Performance Overview: Deepak Nitrite has been on a roll lately! In the last 25 trading sessions, it closed higher 20 times, showing strong upward momentum.
- Recent Trend: In fact, it’s been an impressive 8-day green streak for Deepak Nitrite, with no red days since Wednesday, July 3rd, 2024.
- Returns: Over the past 25 trading sessions, this stock has delivered a solid 22.6% return. That means an initial investment of ₹10,000 would have grown to ₹12,260.
- Financial Insight: Deepak Nitrite has been generating impressive results. In the past 12 months, they generated ₹7,681.83 Crore in revenue and a profit of ₹810.9 Crore.
- As of Monday, July 15th, 2024, Deepak Nitrite has a Market Capital of ₹37,679.24 Crore, showcasing its strong position in the market.
- Summary: The overall picture for Deepak Nitrite is quite bullish. Its strong performance and positive financial results have put it on the radar of many investors. If you’re interested in exploring its potential, check out these resources for short-term and long-term targets: Deepak Nitrite Target for Tomorrow and Deepak Nitrite Targets for 2024 & 2025.
Deepak Nitrite Financial Performance
| Metric | Value | Description |
|---|---|---|
| Market Capital | 37,679.24 Crore | Market valuation of Deepak Nitrite’s shares. |
| Revenue (TTM) | 7,681.83 Crore | Total revenue generated by Deepak Nitrite over the past twelve months. |
| Net Income (TTM) | +810.9 Crore | Net Profit or Loss after all the expenses over the past twelve months. |
| Operating Margin | 11.97% | Income from operations as a percentage of revenue, before taxes and interest. |
| Profit Margin | 10.55% | Net income as a percentage of revenue, after all expenses. |
| Revenue Growth (Quarterly) | +8.4% | Change in revenue compared to the previous quarter. |
| Earnings Growth (YOY Quarterly) | +8.6% | Change in earnings compared to the same quarter last year. |
| Debt-to-Equity (D/E) Ratio | 5.93 | Company’s total debt divided by total shareholder equity. |
| Total Debt | 286.08 Crore | Sum of Deepak Nitrite’s current & long-term financial obligations. |
| Total Cash | 584.61 Crore | Total amount of liquid funds available to Deepak Nitrite. |
| Beta | 0.57 | Beta is less than 1 indicating that the Deepak Nitrite’s price is less volatile than the market. |
➲ Chalet Hotels (Bearish Pattern)
- Performance Overview: Over the past 25 trading sessions, Chalet Hotels has closed lower 16 times and higher 9 times.
- Recent Trend: Chalet Hotels has been on a 8-day losing streak, with no gains since Wednesday, July 3, 2024.
- Returns: Chalet Hotels has seen a -5.07% return over the last 25 trading sessions. This means an investment of ₹10,000 would be worth ₹9,493 today.
- Financial Insight: Over the past 12 months, Deepak Nitrite has generated a revenue of ₹1,417.25 Crore and a profit of ₹278.16 Crore.
- As of Monday, July 15, 2024, Deepak Nitrite has a Market Capital of ₹18,298.23 Crore.
- Summary: Chalet Hotels is currently in a bearish phase. We recommend investors keep a close watch on its performance, particularly its projected price for tomorrow and price targets for 2024 and 2025.
Chalet Hotels Financial Performance
| Metric | Value | Description |
|---|---|---|
| Market Capital | 18,298.23 Crore | Market valuation of Chalet Hotels’s shares. |
| Revenue (TTM) | 1,417.25 Crore | Total revenue generated by Chalet Hotels over the past twelve months. |
| Net Income (TTM) | +278.16 Crore | Net Profit or Loss after all the expenses over the past twelve months. |
| Operating Margin | 34.84% | Income from operations as a percentage of revenue, before taxes and interest. |
| Profit Margin | 19.62% | Net income as a percentage of revenue, after all expenses. |
| Revenue Growth (Quarterly) | +22.5% | Change in revenue compared to the previous quarter. |
| Earnings Growth (YOY Quarterly) | +124.5% | Change in earnings compared to the same quarter last year. |
| Debt-to-Equity (D/E) Ratio | 162.36 | Company’s total debt divided by total shareholder equity. |
| Total Debt | 3,005.18 Crore | Sum of Chalet Hotels’s current & long-term financial obligations. |
| Total Cash | 133.1 Crore | Total amount of liquid funds available to Chalet Hotels. |
| Beta | 0.35 | Beta is less than 1 indicating that the Chalet Hotels’s price is less volatile than the market. |
Top Stocks That Created a New All Time High Today
Top Large Cap Stocks That Created a New All Time High Today
Companies with Market Capital more than 20,000 Crores| Stock | Close | New All-Time High (ATH) | Previous ATH | Previous ATH Date |
|---|---|---|---|---|
| Apar Industries | 8825.25 (+1.79%) | 9099.00 (+15.91%) | 7850.00 | Wed 24 Apr 2024 |
| Aurobindo Pharma | 1375.55 (+3.67%) | 1409.90 (+%) | Thu 01 Jan 1970 | |
| Britannia | 5814.75 (+0.47%) | 5847.75 (+%) | Thu 01 Jan 1970 | |
| Colgate Palmolive | 3093.00 (+1.91%) | 3104.60 (+10.29%) | 2814.89 | Wed 03 Apr 2024 |
| Dr Reddy Lab | 6794.75 (+1.12%) | 6884.95 (+%) | Thu 01 Jan 1970 |
Top Mid Cap Stocks That Created a New All Time High Today
Companies with Market Capital between 5,000 Crores to 20,000 Crores| Stock | Close | New All-Time High (ATH) | Previous ATH | Previous ATH Date |
|---|---|---|---|---|
| Dodla Dairy | 1144.34 (+1.92%) | 1174.69 (+%) | Thu 01 Jan 1970 | |
| eMudhra | 870.00 (-2.75%) | 921.00 (+10.49%) | 833.50 | Fri 22 Mar 2024 |
| GMR Power And Urban Infra | 102.15 (-0.97%) | 107.50 (+%) | Thu 01 Jan 1970 | |
| Godrej Agrovet | 863.20 (+4.15%) | 876.70 (+%) | Thu 01 Jan 1970 | |
| HBL Power Systems | 632.20 (+10.51%) | 645.65 (+%) | Thu 01 Jan 1970 |
Top Small Cap Stocks That Created a New All Time High Today
Companies with Market Capital less than 5,000 Crores| Stock | Close | New All-Time High (ATH) | Previous ATH | Previous ATH Date |
|---|---|---|---|---|
| Ace Software Exports | 296.85 (+1.99%) | 296.85 (+97.53%) | 150.28 | Mon 01 Apr 2024 |
| Advait Infratech | 2052.05 (+4.8%) | 2052.05 (+23.42%) | 1662.60 | Mon 01 Apr 2024 |
| Abans Holdings | 554.40 (+4.92%) | 555.00 (+27.41%) | 435.60 | Wed 10 Apr 2024 |
| Ahmedabad Steelcraft | 128.10 (+1.99%) | 128.10 (+%) | Thu 01 Jan 1970 | |
| Almondz Global Securities | 156.50 (-1.44%) | 166.72 (+%) | Thu 01 Jan 1970 |