Home / Fri 10 May 2024 Market Recap
10 May 2024 Market Recap: Nifty 50 Climbs 0.39% to ₹22,054 with Bajaj Auto Bullish; Hind Zinc, TVS Holdings Hit Record Highs
Show Table of Contents
Table of Contents
- 1: Top Indices Performance Overview
- 2: Nifty 50 Performance Overview
- 2.1: Nifty 50 Top Gainers
- 2.2: Nifty 50 Top Losers
- 2.3: Nifty 50 Stocks To Watch for Tomorrow
- 2.3.1: ➲ Bajaj Auto (Bullish Pattern)
- 2.3.2: ➲ Cipla (Bearish Pattern)
- 3: Nifty 500 Performance Overview
- 3.1: Nifty 500 Top Gainers
- 3.2: Nifty 500 Top Losers
- 3.3: Nifty 51 to 500 Stocks To Watch for Tomorrow
- 3.3.1: ➲ Bajaj Holdings (Bullish Pattern)
- 3.3.2: ➲ Nuvoco Vistas Corporation (Bearish Pattern)
- 4: Top Stocks That Created a New All Time High Today
- 4.1: Top Large Cap Stocks That Created a New All Time High Today
- 4.2: Top Mid Cap Stocks That Created a New All Time High Today
- 4.3: Top Small Cap Stocks That Created a New All Time High Today
Top Indices Performance Overview
| Stock | Close | Range |
|---|---|---|
| NIFTY 50 | ₹22054 (0.39%) | ₹21,953.25 – ₹22,130.69 |
| NIFTY BANK | ₹47,440.85 (-0.16%) | ₹47,316.44 – ₹47,865.3 |
| NIFTY FIN SERVICE | ₹21,105.94 (-0.03%) | ₹21,019.44 – ₹21,269.69 |
| NIFTY IT | ₹32,948.64 (-0.6%) | ₹32,790.1 – ₹33,164.75 |
| NIFTY AUTO | ₹22,847.59 (0.92%) | ₹22,672.65 – ₹22898 |
| NIFTY ENERGY | ₹39,072.35 (1.45%) | ₹38,504.39 – ₹39,136.6 |
Nifty 50 Performance Overview
The Nifty 50 commenced trading at ₹21,987.34. During the session, it fluctuated within a range of ₹21,953.25 and ₹22,130.69. Ultimately, it closed the day at ₹22,054 (+0.39%).
Refer to the table below for the day’s top gainers and losers, stocks that significantly influenced the Nifty 50’s movement.
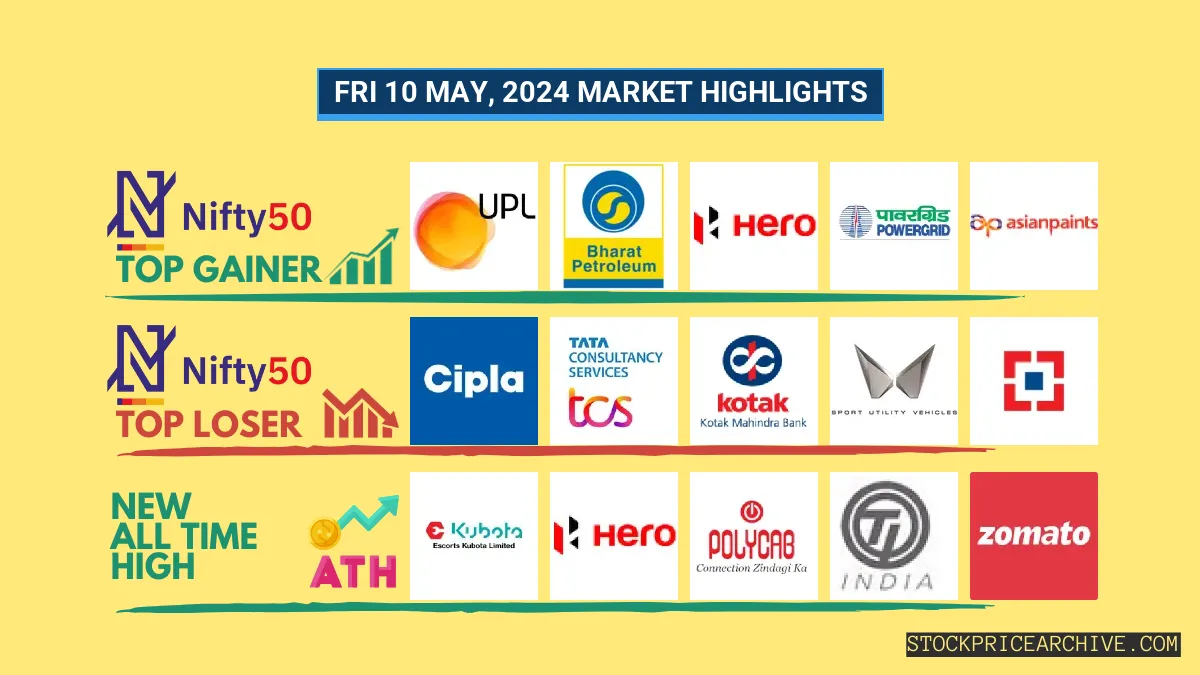
Nifty 50 Top Gainers
| Stock | Close | Range |
|---|---|---|
| UPL | ₹501.2 (7.53%) | ₹464.7 – ₹505 |
| Bharat Petroleum | ₹618.75 (4.58%) | ₹601.9 – ₹621.65 |
| Hero MotoCorp | ₹4,878.7 (2.47%) | ₹4,774.89 – ₹4,951.79 |
| Power Grid | ₹303.39 (2.23%) | ₹297 – ₹304.39 |
| Asian Paints | ₹2,769.94 (2.17%) | ₹2,673.3 – ₹2,792.6 |
Nifty 50 Top Losers
| Stock | Close | Range |
|---|---|---|
| Cipla | ₹1340 (-1.9%) | ₹1,318.44 – ₹1,396.44 |
| TCS | ₹3895 (-1.55%) | ₹3,885.05 – ₹3,973.6 |
| Kotak Mahindra Bank | ₹1,622.4 (-1.18%) | ₹1,616.15 – ₹1,652.75 |
| Mahindra & Mahindra | ₹2,193.39 (-1.03%) | ₹2183 – ₹2,231.6 |
| HDFC BANK | ₹1,439.84 (-0.76%) | ₹1,432.94 – ₹1,451.94 |
Nifty 50 Stocks To Watch for Tomorrow
➲ Bajaj Auto (Bullish Pattern)
- Performance Overview: In the past 24 trading sessions, Bajaj Auto has posted gains on 12 days and closed lower on 11 days.
- Recent Trend: Bajaj Auto has been on a 3-day winning streak, with no closing losses since Tuesday, May 7, 2024.
- Returns: Over the last 24 trading sessions, Bajaj Auto has delivered a -1.63% return. This means that an investment of ₹10,000 would now be worth ₹9,837.
- Financial Snapshot: Over the past 12 months, Bajaj Auto has reported revenue of ₹46,306.44 Crore and a profit of ₹7,708.24 Crore.
- As of Friday, May 10, 2024, Bajaj Auto has a Market Capitalization of ₹2,47,022.61 Crore.
- Outlook: Bajaj Auto exhibits a strong bullish pattern. Investors may want to consider monitoring its price movements for potential short-term and long-term growth opportunities: Checkout Bajaj Auto Target for Tomorrow and Bajaj Auto Targets for 2024 & 2025.
Bajaj Auto Financial Performance
| Metric | Value | Description |
|---|---|---|
| Market Capital | 2,47,022.61 Crore | Market valuation of Bajaj Auto’s shares. |
| Revenue (TTM) | 46,306.44 Crore | Total revenue generated by Bajaj Auto over the past twelve months. |
| Net Income (TTM) | +7,708.24 Crore | Net Profit or Loss after all the expenses over the past twelve months. |
| Operating Margin | 21.41% | Income from operations as a percentage of revenue, before taxes and interest. |
| Profit Margin | 16.64% | Net income as a percentage of revenue, after all expenses. |
| Revenue Growth (Quarterly) | +34.3% | Change in revenue compared to the previous quarter. |
| Earnings Growth (YOY Quarterly) | +18% | Change in earnings compared to the same quarter last year. |
| Debt-to-Equity (D/E) Ratio | 6.16 | Company’s total debt divided by total shareholder equity. |
| Total Debt | 1,785.9 Crore | Sum of Bajaj Auto’s current & long-term financial obligations. |
| Total Cash | 6,386.91 Crore | Total amount of liquid funds available to Bajaj Auto. |
| Beta | 0.9 | Beta is less than 1 indicating that the Bajaj Auto’s price is less volatile than the market. |
➲ Cipla (Bearish Pattern)
- Performance Overview: Over the past 24 trading sessions, Cipla has closed in the red 17 times, and in the green only 7 times.
- Recent Trend: For the past 5 trading sessions, Cipla has been on a continuous downward trend, closing in the red each day since Friday, May 3, 2024.
- Returns: In the last 24 trading sessions, Cipla has delivered negative returns of 9.4%. This means that an investment of ₹10,000 would now be worth approximately ₹9,060.
- Financial Insight: In the past 12 months, Cipla has generated revenue of ₹25,116.28 Crore and a profit of ₹3,708.16 Crore.
- As of Friday, May 10, 2024, Cipla has a Market Capital of ₹1,09,712.77 Crore.
- Summary: Cipla is currently experiencing a bearish phase. With this in mind, investors are advised to exercise caution and closely monitor the stock’s performance. Relevant Cipla targets can be found on our website: Target for Tomorrow and Targets for 2024 & 2025.
Cipla Financial Performance
| Metric | Value | Description |
|---|---|---|
| Market Capital | 1,09,712.77 Crore | Market valuation of Cipla’s shares. |
| Revenue (TTM) | 25,116.28 Crore | Total revenue generated by Cipla over the past twelve months. |
| Net Income (TTM) | +3,708.16 Crore | Net Profit or Loss after all the expenses over the past twelve months. |
| Operating Margin | 23.27% | Income from operations as a percentage of revenue, before taxes and interest. |
| Profit Margin | 14.76% | Net income as a percentage of revenue, after all expenses. |
| Revenue Growth (Quarterly) | +12% | Change in revenue compared to the previous quarter. |
| Earnings Growth (YOY Quarterly) | +31.8% | Change in earnings compared to the same quarter last year. |
| Debt-to-Equity (D/E) Ratio | 3.82 | Company’s total debt divided by total shareholder equity. |
| Total Debt | 960.88 Crore | Sum of Cipla’s current & long-term financial obligations. |
| Total Cash | 4,890.68 Crore | Total amount of liquid funds available to Cipla. |
| Beta | 0.36 | Beta is less than 1 indicating that the Cipla’s price is less volatile than the market. |
Nifty 500 Performance Overview
Nifty 500 commenced trading at ₹20,397.05, experiencing fluctuations throughout the day. It touched a low of ₹20,299.18 and a high of ₹20,481.84 before concluding the session at ₹20,474.3, registering a (+0.58%) gain.
The table below presents the top-performing and underperforming stocks that significantly influenced the Nifty 500’s movement.
Nifty 500 Top Gainers
| Stock | Close | Range |
|---|---|---|
| Hindustan Zinc | ₹529 (15.85%) | ₹460.95 – ₹539.65 |
| Vijaya Diagnostic Centre | ₹804.9 (10.71%) | ₹725.04 – ₹817.79 |
| Honeywell Automation | ₹46900 (8.64%) | ₹43,462.55 – ₹47,220.3 |
| Endurance Technologies | ₹2111 (7.7%) | ₹1,963.75 – ₹2119 |
| UPL | ₹501.2 (7.53%) | ₹464.7 – ₹505 |
Nifty 500 Top Losers
| Stock | Close | Range |
|---|---|---|
| IRB Infrastructure Developers | ₹63 (-4.41%) | ₹62.05 – ₹66.5 |
| Go Fashion | ₹950 (-4.07%) | ₹949.95 – ₹1001 |
| Home First Finance Company | ₹819.59 (-3.57%) | ₹816 – ₹863.95 |
| Birlasoft | ₹584.65 (-2.94%) | ₹577.59 – ₹606.45 |
| Bank of Baroda | ₹255 (-2.86%) | ₹248.5 – ₹266.6 |
Nifty 51 to 500 Stocks To Watch for Tomorrow
➲ Bajaj Holdings (Bullish Pattern)
- Performance at a Glance: Over the past 24 trading sessions, Bajaj Holdings has closed in green 13 times and in red 11 times.
- Current Trend: Bajaj Holdings has been on a 4-day green streak since Mon 06 May 2024.
- Returns: Bajaj Holdings delivered a 0.88% return in the last 24 trading sessions, meaning an investment of ₹10,000 would have grown to ₹10,088.
- Financial Health: In the past 12 months, Bajaj Holdings reported revenue of ₹1,713.46 Crore and a profit of ₹7,267.21 Crore.
- As of Fri 10 May 2024, Bajaj Holdings has a Market Capitalization of ₹93,464 Crore.
- Outlook: Bajaj Holdings displays a strong bullish pattern. Investors should keep an eye on its price movements for both short-term and long-term growth prospects: Checkout Bajaj Holdings Target for Tomorrow and Bajaj Holdings Targets for 2024 & 2025.
Bajaj Holdings Financial Performance
| Metric | Value | Description |
|---|---|---|
| Market Capital | 93,464 Crore | Market valuation of Bajaj Holdings’s shares. |
| Revenue (TTM) | 1,713.46 Crore | Total revenue generated by Bajaj Holdings over the past twelve months. |
| Net Income (TTM) | +7,267.21 Crore | Net Profit or Loss after all the expenses over the past twelve months. |
| Operating Margin | 96.43% | Income from operations as a percentage of revenue, before taxes and interest. |
| Profit Margin | 424.12% | Net income as a percentage of revenue, after all expenses. |
| Revenue Growth (Quarterly) | +1058.3% | Change in revenue compared to the previous quarter. |
| Earnings Growth (YOY Quarterly) | +100.8% | Change in earnings compared to the same quarter last year. |
| Debt-to-Equity (D/E) Ratio | 0.09 | Company’s total debt divided by total shareholder equity. |
| Total Debt | 62.56 Crore | Sum of Bajaj Holdings’s current & long-term financial obligations. |
| Total Cash | 53.96 Crore | Total amount of liquid funds available to Bajaj Holdings. |
| Beta | 0.61 | Beta is less than 1 indicating that the Bajaj Holdings’s price is less volatile than the market. |
➲ Nuvoco Vistas Corporation (Bearish Pattern)
- Performance Overview: Across the last 24 trading days, Nuvoco Vistas Corporation has closed in red 16 times and in green 8 times.
- Recent Trend: Nuvoco Vistas Corporation has been on a 11-day red streak, without a single day closing in green since Wednesday, April 24, 2024.
- Returns: Nuvoco Vistas Corporation has given a -5.12% return in the last 24 trading sessions, which means that an investment of ₹10,000 would have become ₹9,488
- Financial Insight: Over the past 12 months, Bajaj Holdings has generated revenue of ₹10,727.94 Crore and created a profit of ₹248.08 Crore.
- As of Friday, May 10, 2024, Bajaj Holdings has a Market Capital of ₹12,170.08 Crore.
- Summary: Nuvoco Vistas Corporation is currently experiencing a bearish phase. We advise investors to keep a close watch, especially on Nuvoco Vistas Corporation Target for Tomorrow and Nuvoco Vistas Corporation Targets for 2024 & 2025.
Nuvoco Vistas Corporation Financial Performance
| Metric | Value | Description |
|---|---|---|
| Market Capital | 12,170.08 Crore | Market valuation of Nuvoco Vistas Corporation’s shares. |
| Revenue (TTM) | 10,727.94 Crore | Total revenue generated by Nuvoco Vistas Corporation over the past twelve months. |
| Net Income (TTM) | +248.08 Crore | Net Profit or Loss after all the expenses over the past twelve months. |
| Operating Margin | 7.4% | Income from operations as a percentage of revenue, before taxes and interest. |
| Profit Margin | 2.31% | Net income as a percentage of revenue, after all expenses. |
| Revenue Growth (Quarterly) | -7.1% | Change in revenue compared to the previous quarter. |
| Debt-to-Equity (D/E) Ratio | 57.86 | Company’s total debt divided by total shareholder equity. |
| Total Debt | 5,124.01 Crore | Sum of Nuvoco Vistas Corporation’s current & long-term financial obligations. |
| Total Cash | 145.36 Crore | Total amount of liquid funds available to Nuvoco Vistas Corporation. |
| Beta | -0.01 | Beta is less than 1 indicating that the Nuvoco Vistas Corporation’s price is less volatile than the market. |
Top Stocks That Created a New All Time High Today
Top Large Cap Stocks That Created a New All Time High Today
Companies with Market Capital more than 20,000 Crores| Stock | Close | New All-Time High (ATH) | Previous ATH | Previous ATH Date |
|---|---|---|---|---|
| Escorts | 3553.19 (+3.13%) | 3581.19 (+%) | Thu 01 Jan 1970 | |
| Hero MotoCorp | 4878.70 (+2.38%) | 4951.79 (+%) | Thu 01 Jan 1970 | |
| Hindustan Zinc | 529.00 (+15.97%) | 539.65 (+30.19%) | 414.50 | Wed 10 Apr 2024 |
| Polycab India | 6185.00 (+6.57%) | 6362.95 (+%) | Thu 01 Jan 1970 | |
| Tube Investments of India | 4076.14 (+3.23%) | 4160.00 (+%) | Thu 01 Jan 1970 |
Top Mid Cap Stocks That Created a New All Time High Today
Companies with Market Capital between 5,000 Crores to 20,000 Crores| Stock | Close | New All-Time High (ATH) | Previous ATH | Previous ATH Date |
|---|---|---|---|---|
| CEBBCO | 482.85 (+13.34%) | 497.75 (+14.74%) | 433.80 | Mon 01 Jan 2024 |
| Jupiter Wagons | 484.75 (+15.34%) | 497.85 (+14.71%) | 434.00 | Tue 23 Jan 2024 |
| Kirloskar Brothers | 1435.00 (+6.87%) | 1452.75 (+9.85%) | 1322.44 | Wed 24 Apr 2024 |
| Netweb Technologies | 1960.00 (-1.26%) | 2034.94 (+%) | Thu 01 Jan 1970 | |
| TVS Holdings | 10177.00 (+4.69%) | 10479.90 (+%) | Thu 01 Jan 1970 |
Top Small Cap Stocks That Created a New All Time High Today
Companies with Market Capital less than 5,000 Crores| Stock | Close | New All-Time High (ATH) | Previous ATH | Previous ATH Date |
|---|---|---|---|---|
| Aayush Food and Herbs | 285.35 (+1.98%) | 285.35 (+17.74%) | 242.35 | Thu 25 Apr 2024 |
| ABIRAFN | 80.98 (+4.99%) | 80.98 (+62.7%) | 49.77 | Thu 25 Apr 2024 |
| Ace Software Exports | 161.94 (+1.98%) | 161.94 (+7.75%) | 150.28 | Mon 01 Apr 2024 |
| ASHSI | 64.87 (+4.64%) | 67.65 (+%) | Thu 01 Jan 1970 | |
| Bacil Pharma | 24.30 (+0.45%) | 24.66 (+23.98%) | 19.89 | Wed 24 Apr 2024 |