Home / Mon 06 May 2024 Market Recap
Top Stock Market Movers on 06 May 2024: Nifty 50 Slips, Britannia and Titan Fall, Ashok Leyland and Allcargo Logistics Steal the Show
Show Table of Contents
Table of Contents
- 1: Top Indices Performance Overview
- 2: Nifty 50 Performance Overview
- 2.1: Nifty 50 Top Gainers
- 2.2: Nifty 50 Top Losers
- 2.3: Nifty 50 Stocks To Watch for Tomorrow
- 2.3.1: ➲ GRASIM (Bullish Pattern)
- 2.3.2: ➲ Britannia (Bearish Pattern)
- 3: Nifty 500 Performance Overview
- 3.1: Nifty 500 Top Gainers
- 3.2: Nifty 500 Top Losers
- 3.3: Nifty 51 to 500 Stocks To Watch for Tomorrow
- 3.3.1: ➲ Ashok Leyland (Bullish Pattern)
- 3.3.2: ➲ Allcargo Logistics (Bearish Pattern)
- 4: Top Stocks That Created a New All Time High Today
- 4.1: Top Large Cap Stocks That Created a New All Time High Today
- 4.2: Top Mid Cap Stocks That Created a New All Time High Today
- 4.3: Top Small Cap Stocks That Created a New All Time High Today
Top Indices Performance Overview
| Stock | Close | Range |
|---|---|---|
| NIFTY 50 | ₹22,442.69 (-0.15%) | ₹22,409.44 – ₹22,588.8 |
| NIFTY BANK | ₹48,895.3 (-0.06%) | ₹48784 – ₹49,252.64 |
| NIFTY FIN SERVICE | ₹21,743.69 (-0.25%) | ₹21,707.05 – ₹21,890.75 |
| NIFTY IT | ₹33,244.55 (1.02%) | ₹32,997.89 – ₹33,434.35 |
| NIFTY AUTO | ₹22,530.69 (-0.05%) | ₹22,395.19 – ₹22,653.25 |
| NIFTY ENERGY | ₹39,919.55 (-1.61%) | ₹39,708.44 – ₹40,725.1 |
Nifty 50 Performance Overview
Nifty 50 Market Performance
The Nifty 50 commenced trading at ₹22,766.34. It fluctuated during the session, marking a low of ₹22,348.05 and a high of ₹22,794.69. Ultimately, it closed at ₹22,475.84, reflecting a loss of 0.77%.
Key factors that shaped today’s market movement will be discussed in subsequent reports.
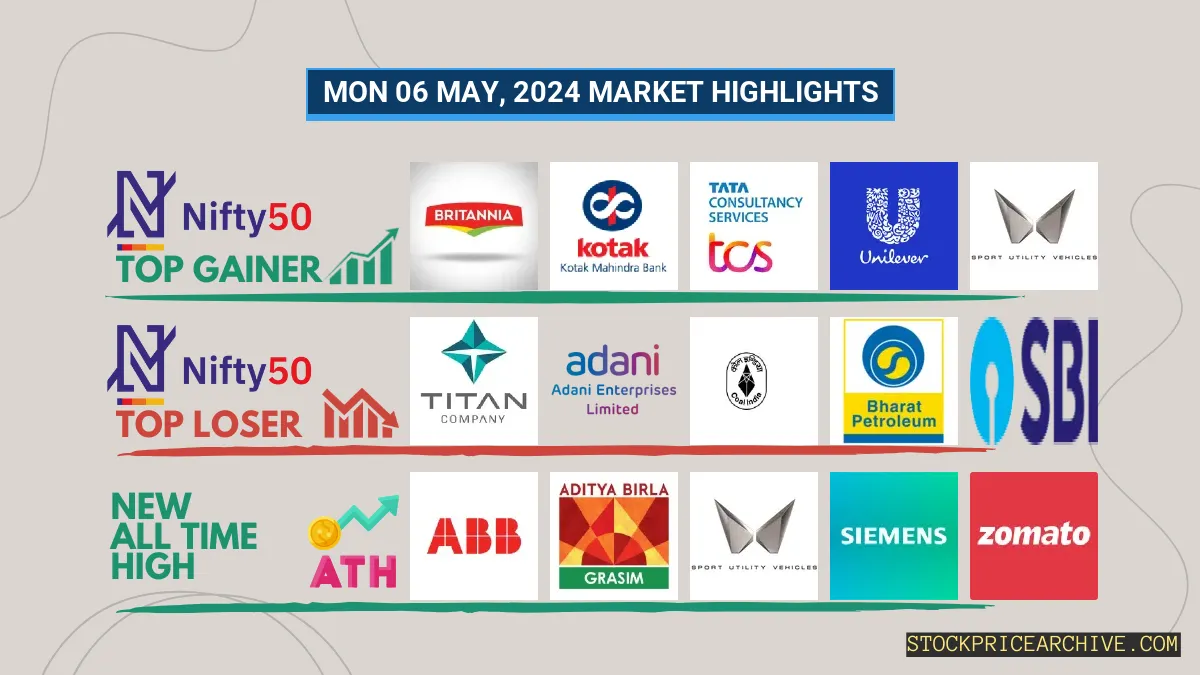
Nifty 50 Top Gainers
| Stock | Close | Range |
|---|---|---|
| Britannia | ₹5,064.89 (6.75%) | ₹4,814.5 – ₹5200 |
| Kotak Mahindra Bank | ₹1,624.3 (5.01%) | ₹1594 – ₹1633 |
| TCS | ₹3,921.05 (2.02%) | ₹3853 – ₹3,939.94 |
| Hindustan Unilever | ₹2,256.19 (1.76%) | ₹2212 – ₹2,261.5 |
| Mahindra & Mahindra | ₹2,224.94 (1.45%) | ₹2190 – ₹2240 |
Nifty 50 Top Losers
| Stock | Close | Range |
|---|---|---|
| TITAN | ₹3,280.14 (-7.19%) | ₹3257 – ₹3,488.8 |
| Adani Enterprises | ₹2,872.25 (-4.05%) | ₹2850 – ₹2,997.69 |
| Coal India | ₹460.35 (-3.01%) | ₹444.45 – ₹481.39 |
| Bharat Petroleum | ₹611 (-3%) | ₹606.15 – ₹632.5 |
| SBI | ₹807.79 (-2.85%) | ₹803 – ₹836 |
Nifty 50 Stocks To Watch for Tomorrow
➲ GRASIM (Bullish Pattern)
- Performance Overview: In the last 22 trading sessions, GRASIM has closed in the green 14 times and in the red 8 times.
- Recent Trend: GRASIM has been on a 4-day green streak, without a single day closing in the red since Fri 26 Apr 2024.
- Returns: GRASIM gave a 7.88% returns in the last 22 trading sessions, that means your investment of ₹10,000 would have become ₹10,788
- Financial Insight: GRASIM reported a net profit of ₹2,603.42 Crore in 2023-Q3 Income Statement.
- As of Fri 03 May 2024, GRASIM has a Market Capital of ₹1,58,918.6 Crore.
- Summary: GRASIM exhibits a robust bullish pattern. Investors should monitor its price movements targets for both short-term and long-term growth prospects: Checkout GRASIM Target for Tomorrow and GRASIM Targets for 2024 & 2025.
GRASIM Financial Performance
| Metric | Value | Description |
|---|---|---|
| Revenue Growth (Quarterly) | +11.6% | Change in revenue compared to the previous quarter. |
| Earnings Growth (YOY Quarterly) | -39.81% | Change in earnings compared to the same quarter last year. |
| Operating Margin | 17.67% | Income from operations as a percentage of revenue, before taxes and interest. |
| Profit Margin | 4.43% | Net income as a percentage of revenue, after all expenses. |
| Debt-to-Equity (D/E) Ratio | 93.15 | Company’s total debt divided by total shareholder equity. |
| Beta | 0.54 | Beta is less than 1 indicating that the GRASIM’s price is less volatile than the market. |
➲ Britannia (Bearish Pattern)
- Performance Overview: In the last 22 trading sessions, Britannia has closed in the red 14 times and in the green 8 times.
- Recent Trend: Britannia has been on a 5-day red streak, without a single day closing in the green since Thu 25 Apr 2024.
- Returns: Britannia gave a -3.76% returns in the last 22 trading sessions, that means your investment of ₹10,000 would have become ₹9,624
- Financial Insight: Britannia reported a net profit of 555.66 Crore in 2023-Q3 Income Statement.
- As of Fri 03 May 2024, Britannia has a Market Capital of ₹1,15,037.35 Crore.
- Summary: Britannia is currently experiencing a bearish phase. We advise investors to keep a close watch, especially on Britannia Target for Tomorrow and Britannia Targets for 2024 & 2025.
Britannia Financial Performance
| Metric | Value | Description |
|---|---|---|
| Revenue Growth (Quarterly) | +1.4% | Change in revenue compared to the previous quarter. |
| Earnings Growth (YOY Quarterly) | -40.31% | Change in earnings compared to the same quarter last year. |
| Operating Margin | 17.45% | Income from operations as a percentage of revenue, before taxes and interest. |
| Profit Margin | 12.96% | Net income as a percentage of revenue, after all expenses. |
| Debt-to-Equity (D/E) Ratio | 96.67 | Company’s total debt divided by total shareholder equity. |
| Beta | 0.48 | Beta is less than 1 indicating that the Britannia’s price is less volatile than the market. |
Nifty 500 Performance Overview
The Nifty 500 commenced its day at ₹21,193.44.
Throughout the trading session, it witnessed fluctuations, reaching a low of ₹20,830.65 and a high of ₹21,208.69. The index ultimately ended the day at ₹20,959.55, marking a drop of 0.59% from the previous close.
Here’s a closer look at the stocks that significantly influenced the Nifty 500’s movement today:
Nifty 500 Top Gainers
| Stock | Close | Range |
|---|---|---|
| Godrej Properties | ₹2,838.1 (10.44%) | ₹2,651.75 – ₹2850 |
| Brigade Enterprises | ₹1107 (8.46%) | ₹1,012.45 – ₹1,125.05 |
| EPL | ₹195.89 (7.99%) | ₹182.3 – ₹197 |
| Rainbow Childrens Medicare | ₹1,571.3 (7.32%) | ₹1,471.15 – ₹1649 |
| Britannia | ₹5,064.89 (6.75%) | ₹4,814.5 – ₹5200 |
Nifty 500 Top Losers
| Stock | Close | Range |
|---|---|---|
| Mangalore Refinery & Petrochemicals | ₹229.05 (-8.93%) | ₹228 – ₹256.5 |
| Power Finance Corporation | ₹437.79 (-8.88%) | ₹416.54 – ₹458.85 |
| REC | ₹516.59 (-7.39%) | ₹481.79 – ₹540.2 |
| TITAN | ₹3,280.14 (-7.19%) | ₹3257 – ₹3,488.8 |
| PNB | ₹127.1 (-6.41%) | ₹126.4 – ₹136.88 |
Nifty 51 to 500 Stocks To Watch for Tomorrow
➲ Ashok Leyland (Bullish Pattern)
- Performance Overview: In the past 22 trading sessions, Ashok Leyland has closed in green 15 times and in red 7 times.
- Recent Trend: Ashok Leyland has been on a 9-day green streak, without a single day closing in red since Fri 19 Apr 2024.
- Returns: Ashok Leyland gave a 16.93% returns in the last 22 trading sessions, that means your investment of ₹10,000 would have become ₹11,693
- Financial Insight: Ashok Leyland reported a net profit of ₹608.85 Crore in 2023-Q3 Income Statement.
- As of Fri 03 May 2024, Ashok Leyland has a Market Capital of ₹56,568.39 Crore.
- Summary: Ashok Leyland exhibits a robust bullish pattern. Investors should monitor its price movements targets for both short-term and long-term growth prospects: Checkout Ashok Leyland Target for Tomorrow and Ashok Leyland Targets for 2024 & 2025.
Ashok Leyland Financial Performance
| Metric | Value | Description |
|---|---|---|
| Revenue Growth (Quarterly) | +6.7% | Change in revenue compared to the previous quarter. |
| Earnings Growth (YOY Quarterly) | +75.59% | Change in earnings compared to the same quarter last year. |
| Operating Margin | 15.5% | Income from operations as a percentage of revenue, before taxes and interest. |
| Profit Margin | 5.24% | Net income as a percentage of revenue, after all expenses. |
| Debt-to-Equity (D/E) Ratio | 306.52 | Company’s total debt divided by total shareholder equity. |
| Beta | 0.86 | Beta is less than 1 indicating that the Ashok Leyland’s price is less volatile than the market. |
➲ Allcargo Logistics (Bearish Pattern)
- Performance Overview: In the last 22 trading sessions, Allcargo Logistics has closed in red 11 times and in green 11 times.
- Recent Trend: Allcargo Logistics has been on a 6-day red streak, without a single day closing in green since Wed 24 Apr 2024.
- Returns: Allcargo Logistics gave a -0.35% returns in the last 22 trading sessions, that means your investment of ₹10,000 would have become ₹9,965
- Financial Insight: Allcargo Logistics reported a net profit of 17.36 Crore in 2023-Q3 Income Statement.
- As of Fri 03 May 2024, Ashok Leyland has a Market Capital of ₹7,282.41 Crore.
- Summary: Allcargo Logistics is currently experiencing a bearish phase. We advise investors to keep a close watch, especially on Allcargo Logistics Target for Tomorrow and Allcargo Logistics Targets for 2024 & 2025.
Allcargo Logistics Financial Performance
| Metric | Value | Description |
|---|---|---|
| Revenue Growth (Quarterly) | +111.9% | Change in revenue compared to the previous quarter. |
| Earnings Growth (YOY Quarterly) | +298.3% | Change in earnings compared to the same quarter last year. |
| Operating Margin | 5.6% | Income from operations as a percentage of revenue, before taxes and interest. |
| Profit Margin | 1.64% | Net income as a percentage of revenue, after all expenses. |
| Debt-to-Equity (D/E) Ratio | 0.65 | Company’s total debt divided by total shareholder equity. |
| Beta | 0.8 | Beta is less than 1 indicating that the Allcargo Logistics’s price is less volatile than the market. |
Top Stocks That Created a New All Time High Today
Top Large Cap Stocks That Created a New All Time High Today
Companies with Market Capital more than 20,000 Crores| Stock | Close | New All-Time High (ATH) | Previous ATH | Previous ATH Date |
|---|---|---|---|---|
| ABB India | 6949.89 (+3.75%) | 7027.89 (+4.14%) | 6747.89 | Mon 08 Apr 2024 |
| Brigade Enterprises | 1107.00 (+8.46%) | 1125.05 (+%) | Thu 01 Jan 1970 | |
| CDSL | 2146.00 (+3.19%) | 2197.69 (+3.73%) | 2118.60 | Tue 23 Apr 2024 |
| Escorts | 3467.30 (-0.5%) | 3519.85 (+%) | Thu 01 Jan 1970 | |
| Fortis | 464.39 (+2.75%) | 470.50 (+%) | Thu 01 Jan 1970 |
Top Mid Cap Stocks That Created a New All Time High Today
Companies with Market Capital between 5,000 Crores to 20,000 Crores| Stock | Close | New All-Time High (ATH) | Previous ATH | Previous ATH Date |
|---|---|---|---|---|
| Arvind | 332.10 (-0.44%) | 340.00 (+2.16%) | 332.79 | Tue 23 Apr 2024 |
| BASF | 4260.00 (+4.86%) | 4374.95 (+%) | Thu 01 Jan 1970 | |
| Jindal Saw | 588.79 (+2.4%) | 598.00 (+%) | Thu 01 Jan 1970 | |
| Kirloskar Brothers | 1341.69 (-3.76%) | 1414.40 (+6.95%) | 1322.44 | Wed 24 Apr 2024 |
| Nava | 513.15 (-1.26%) | 544.40 (+%) | Thu 01 Jan 1970 |
Top Small Cap Stocks That Created a New All Time High Today
Companies with Market Capital less than 5,000 Crores| Stock | Close | New All-Time High (ATH) | Previous ATH | Previous ATH Date |
|---|---|---|---|---|
| Aayush Food and Herbs | 264.00 (+1.53%) | 264.00 (+8.93%) | 242.35 | Thu 25 Apr 2024 |
| ABIRAFN | 66.67 (+4.99%) | 66.67 (+33.95%) | 49.77 | Thu 25 Apr 2024 |
| A.K. Spintex | 161.35 (+1.54%) | 174.95 (+%) | Thu 01 Jan 1970 | |
| AMBO AGRITEC LIMITED | 43.15 (+18.87%) | 43.15 (+%) | Thu 01 Jan 1970 | |
| Auro Laboratories | 292.60 (+4.98%) | 292.60 (+39.53%) | 209.70 | Wed 24 Apr 2024 |