Home / Tue 07 May 2024 Market Recap
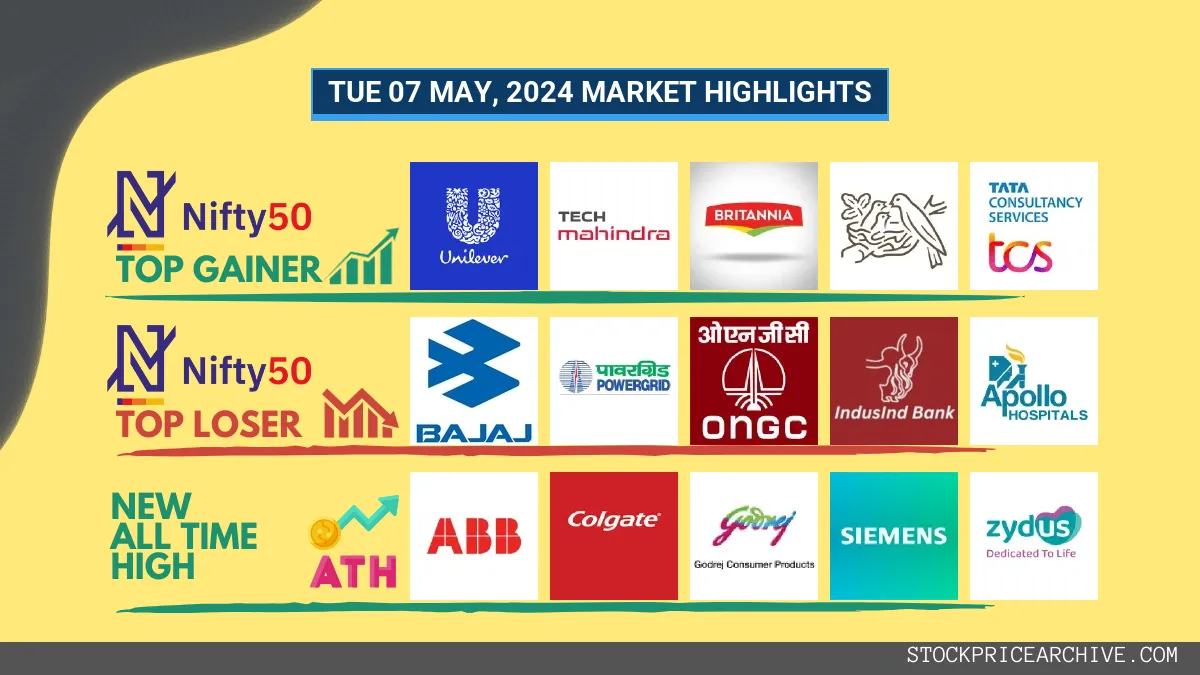
07 May 2024: Nifty 50 closed at ₹22,302.50, down 0.63% – Hindustan Unilever & CDSL Create New All-Time Highs
Show Table of Contents
Table of Contents
- 1: Top Indices Performance Overview
- 2: Nifty 50 Performance Overview
- 2.1: Nifty 50 Top Gainers
- 2.2: Nifty 50 Top Losers
- 2.3: Nifty 50 Stocks To Watch for Tomorrow
- 2.3.1: ➲ GRASIM (Bullish Pattern)
- 2.3.2: ➲ Britannia (Bearish Pattern)
- 3: Nifty 500 Performance Overview
- 3.1: Nifty 500 Top Gainers
- 3.2: Nifty 500 Top Losers
- 3.3: Nifty 51 to 500 Stocks To Watch for Tomorrow
- 3.3.1: ➲ Ashok Leyland (Bullish Pattern)
- 3.3.2: ➲ Allcargo Logistics (Bearish Pattern)
- 4: Top Stocks That Created a New All Time High Today
- 4.1: Top Large Cap Stocks That Created a New All Time High Today
- 4.2: Top Mid Cap Stocks That Created a New All Time High Today
- 4.3: Top Small Cap Stocks That Created a New All Time High Today
Top Indices Performance Overview
| Stock | Close | Range |
|---|---|---|
| NIFTY 50 | ₹22,302.5 (-0.63%) | ₹22,232.05 – ₹22,499.05 |
| NIFTY BANK | ₹48,275.6 (-1.27%) | ₹48,213.75 – ₹49,023.5 |
| NIFTY FIN SERVICE | ₹21,540.09 (-0.94%) | ₹21,511.9 – ₹21,806.44 |
| NIFTY IT | ₹33,479.3 (0.7%) | ₹32999 – ₹33,524.94 |
| NIFTY AUTO | ₹22114 (-1.85%) | ₹21,996.65 – ₹22,595.9 |
| NIFTY ENERGY | ₹39,035.25 (-2.22%) | ₹38,916.85 – ₹40,021.35 |
Nifty 50 Performance Overview
Nifty 50 Market Performance
The Nifty 50 commenced trading at ₹22,766.34. It fluctuated during the session, marking a low of ₹22,348.05 and a high of ₹22,794.69. Ultimately, it closed at ₹22,475.84, reflecting a loss of 0.77%.
Key factors that shaped today’s market movement will be discussed in subsequent reports.
Nifty 50 Top Gainers
| Stock | Close | Range |
|---|---|---|
| Hindustan Unilever | ₹2,379.39 (5.46%) | ₹2259 – ₹2,389.6 |
| Tech Mahindra | ₹1,293.58 (2.48%) | ₹1,256.9 – ₹1,294.8 |
| Britannia | ₹5,173.85 (2.15%) | ₹5,048.79 – ₹5,219.89 |
| Nestle India | ₹2508 (2.05%) | ₹2,459.55 – ₹2,528.35 |
| TCS | ₹3,978.94 (1.47%) | ₹3,913.5 – ₹3988 |
Nifty 50 Top Losers
| Stock | Close | Range |
|---|---|---|
| Bajaj Auto | ₹8,677.9 (-4.22%) | ₹8,642.54 – ₹9,074.95 |
| Power Grid | ₹295.64 (-3.66%) | ₹294.5 – ₹308.29 |
| ONGC | ₹273.6 (-3.03%) | ₹272.6 – ₹285 |
| IndusInd Bank | ₹1,452.55 (-3.01%) | ₹1448 – ₹1,502.65 |
| Apollo Hospitals | ₹5902 (-2.85%) | ₹5,856.39 – ₹6080 |
Nifty 50 Stocks To Watch for Tomorrow
➲ GRASIM (Bullish Pattern)
- Performance Overview: In the last 22 trading sessions, GRASIM has closed in the green 14 times and in the red 8 times.
- Recent Trend: GRASIM has been on a 4-day green streak, without a single day closing in the red since Fri 26 Apr 2024.
- Returns: GRASIM gave a 7.88% returns in the last 22 trading sessions, that means your investment of ₹10,000 would have become ₹10,788
- Financial Insight: GRASIM reported a net profit of ₹2,603.42 Crore in 2023-Q3 Income Statement.
- As of Fri 03 May 2024, GRASIM has a Market Capital of ₹1,58,918.6 Crore.
- Summary: GRASIM exhibits a robust bullish pattern. Investors should monitor its price movements targets for both short-term and long-term growth prospects: Checkout GRASIM Target for Tomorrow and GRASIM Targets for 2024 & 2025.
GRASIM Financial Performance
| Metric | Value | Description |
|---|---|---|
| Revenue Growth (Quarterly) | +11.6% | Change in revenue compared to the previous quarter. |
| Earnings Growth (YOY Quarterly) | -39.81% | Change in earnings compared to the same quarter last year. |
| Operating Margin | 17.67% | Income from operations as a percentage of revenue, before taxes and interest. |
| Profit Margin | 4.43% | Net income as a percentage of revenue, after all expenses. |
| Debt-to-Equity (D/E) Ratio | 93.15 | Company’s total debt divided by total shareholder equity. |
| Beta | 0.54 | Beta is less than 1 indicating that the GRASIM’s price is less volatile than the market. |
➲ Britannia (Bearish Pattern)
- Performance Overview: In the last 22 trading sessions, Britannia has closed in the red 14 times and in the green 8 times.
- Recent Trend: Britannia has been on a 5-day red streak, without a single day closing in the green since Thu 25 Apr 2024.
- Returns: Britannia gave a -3.76% returns in the last 22 trading sessions, that means your investment of ₹10,000 would have become ₹9,624
- Financial Insight: Britannia reported a net profit of 555.66 Crore in 2023-Q3 Income Statement.
- As of Fri 03 May 2024, Britannia has a Market Capital of ₹1,15,037.35 Crore.
- Summary: Britannia is currently experiencing a bearish phase. We advise investors to keep a close watch, especially on Britannia Target for Tomorrow and Britannia Targets for 2024 & 2025.
Britannia Financial Performance
| Metric | Value | Description |
|---|---|---|
| Revenue Growth (Quarterly) | +1.4% | Change in revenue compared to the previous quarter. |
| Earnings Growth (YOY Quarterly) | -40.31% | Change in earnings compared to the same quarter last year. |
| Operating Margin | 17.45% | Income from operations as a percentage of revenue, before taxes and interest. |
| Profit Margin | 12.96% | Net income as a percentage of revenue, after all expenses. |
| Debt-to-Equity (D/E) Ratio | 96.67 | Company’s total debt divided by total shareholder equity. |
| Beta | 0.48 | Beta is less than 1 indicating that the Britannia’s price is less volatile than the market. |
Nifty 500 Performance Overview
The Nifty 500 commenced its day at ₹21,193.44.
Throughout the trading session, it witnessed fluctuations, reaching a low of ₹20,830.65 and a high of ₹21,208.69. The index ultimately ended the day at ₹20,959.55, marking a drop of 0.59% from the previous close.
Here’s a closer look at the stocks that significantly influenced the Nifty 500’s movement today:
Nifty 500 Top Gainers
| Stock | Close | Range |
|---|---|---|
| Jyothy Labs | ₹457.04 (10.3%) | ₹411.95 – ₹459.89 |
| Marico | ₹582.09 (9.76%) | ₹559.59 – ₹586 |
| Godrej Consumer | ₹1,322.34 (7.5%) | ₹1,267.15 – ₹1350 |
| Hindustan Unilever | ₹2,379.39 (5.46%) | ₹2259 – ₹2,389.6 |
| Dabur India | ₹558.45 (5.16%) | ₹531.29 – ₹566.9 |
Nifty 500 Top Losers
| Stock | Close | Range |
|---|---|---|
| Rainbow Childrens Medicare | ₹1442 (-8.23%) | ₹1440 – ₹1,562.94 |
| SRF | ₹2,405.44 (-6.99%) | ₹2,388.75 – ₹2540 |
| Justdial | ₹1,028.4 (-6.2%) | ₹1,015.04 – ₹1100 |
| JSW Energy | ₹580 (-6.08%) | ₹580 – ₹620.65 |
| Ceat | ₹2,349.19 (-5.95%) | ₹2334 – ₹2,503.94 |
Nifty 51 to 500 Stocks To Watch for Tomorrow
➲ Ashok Leyland (Bullish Pattern)
- Performance Overview: In the past 22 trading sessions, Ashok Leyland has closed in green 15 times and in red 7 times.
- Recent Trend: Ashok Leyland has been on a 9-day green streak, without a single day closing in red since Fri 19 Apr 2024.
- Returns: Ashok Leyland gave a 16.93% returns in the last 22 trading sessions, that means your investment of ₹10,000 would have become ₹11,693
- Financial Insight: Ashok Leyland reported a net profit of ₹608.85 Crore in 2023-Q3 Income Statement.
- As of Fri 03 May 2024, Ashok Leyland has a Market Capital of ₹56,568.39 Crore.
- Summary: Ashok Leyland exhibits a robust bullish pattern. Investors should monitor its price movements targets for both short-term and long-term growth prospects: Checkout Ashok Leyland Target for Tomorrow and Ashok Leyland Targets for 2024 & 2025.
Ashok Leyland Financial Performance
| Metric | Value | Description |
|---|---|---|
| Revenue Growth (Quarterly) | +6.7% | Change in revenue compared to the previous quarter. |
| Earnings Growth (YOY Quarterly) | +75.59% | Change in earnings compared to the same quarter last year. |
| Operating Margin | 15.5% | Income from operations as a percentage of revenue, before taxes and interest. |
| Profit Margin | 5.24% | Net income as a percentage of revenue, after all expenses. |
| Debt-to-Equity (D/E) Ratio | 306.52 | Company’s total debt divided by total shareholder equity. |
| Beta | 0.86 | Beta is less than 1 indicating that the Ashok Leyland’s price is less volatile than the market. |
➲ Allcargo Logistics (Bearish Pattern)
- Performance Overview: In the last 22 trading sessions, Allcargo Logistics has closed in red 11 times and in green 11 times.
- Recent Trend: Allcargo Logistics has been on a 6-day red streak, without a single day closing in green since Wed 24 Apr 2024.
- Returns: Allcargo Logistics gave a -0.35% returns in the last 22 trading sessions, that means your investment of ₹10,000 would have become ₹9,965
- Financial Insight: Allcargo Logistics reported a net profit of 17.36 Crore in 2023-Q3 Income Statement.
- As of Fri 03 May 2024, Ashok Leyland has a Market Capital of ₹7,282.41 Crore.
- Summary: Allcargo Logistics is currently experiencing a bearish phase. We advise investors to keep a close watch, especially on Allcargo Logistics Target for Tomorrow and Allcargo Logistics Targets for 2024 & 2025.
Allcargo Logistics Financial Performance
| Metric | Value | Description |
|---|---|---|
| Revenue Growth (Quarterly) | +111.9% | Change in revenue compared to the previous quarter. |
| Earnings Growth (YOY Quarterly) | +298.3% | Change in earnings compared to the same quarter last year. |
| Operating Margin | 5.6% | Income from operations as a percentage of revenue, before taxes and interest. |
| Profit Margin | 1.64% | Net income as a percentage of revenue, after all expenses. |
| Debt-to-Equity (D/E) Ratio | 0.65 | Company’s total debt divided by total shareholder equity. |
| Beta | 0.8 | Beta is less than 1 indicating that the Allcargo Logistics’s price is less volatile than the market. |
Top Stocks That Created a New All Time High Today
Top Large Cap Stocks That Created a New All Time High Today
Companies with Market Capital more than 20,000 Crores| Stock | Close | New All-Time High (ATH) | Previous ATH | Previous ATH Date |
|---|---|---|---|---|
| ABB India | 6898.00 (-0.62%) | 7040.00 (+4.32%) | 6747.89 | Mon 08 Apr 2024 |
| Brigade Enterprises | 1093.90 (-1.46%) | 1153.90 (+%) | Thu 01 Jan 1970 | |
| CDSL | 2109.85 (-1.71%) | 2239.00 (+5.68%) | 2118.60 | Tue 23 Apr 2024 |
| CG Power | 570.65 (+4.45%) | 585.00 (+%) | Thu 01 Jan 1970 | |
| Colgate Palmolive | 2862.60 (+0.15%) | 2960.89 (+5.18%) | 2814.89 | Wed 03 Apr 2024 |
Top Mid Cap Stocks That Created a New All Time High Today
Companies with Market Capital between 5,000 Crores to 20,000 Crores| Stock | Close | New All-Time High (ATH) | Previous ATH | Previous ATH Date |
|---|---|---|---|---|
| Arvind | 360.00 (+8.1%) | 369.00 (+10.88%) | 332.79 | Tue 23 Apr 2024 |
| Finolex Industries/Pipe | 284.29 (+4.36%) | 286.50 (+8.19%) | 264.79 | Thu 04 Apr 2024 |
| Ingersoll Rand | 4086.00 (+2.12%) | 4111.00 (+2.26%) | 4020.10 | Thu 18 Apr 2024 |
| Netweb Technologies | 1923.94 (-0.43%) | 2001.59 (+%) | Thu 01 Jan 1970 | |
| Piccadily Agro Industries | 780.00 (+0.99%) | 810.00 (+47.54%) | 549.00 | Wed 24 Apr 2024 |
Top Small Cap Stocks That Created a New All Time High Today
Companies with Market Capital less than 5,000 Crores| Stock | Close | New All-Time High (ATH) | Previous ATH | Previous ATH Date |
|---|---|---|---|---|
| Aayush Food and Herbs | 269.20 (+1.96%) | 269.20 (+11.07%) | 242.35 | Thu 25 Apr 2024 |
| ABIRAFN | 70.00 (+4.99%) | 70.00 (+40.64%) | 49.77 | Thu 25 Apr 2024 |
| Allsec Technologies | 961.20 (+14.04%) | 1004.00 (+%) | Thu 01 Jan 1970 | |
| AMBO AGRITEC LIMITED | 47.46 (+9.98%) | 47.46 (+%) | Thu 01 Jan 1970 | |
| Auro Laboratories | 278.00 (-4.99%) | 307.20 (+46.49%) | 209.70 | Wed 24 Apr 2024 |