Home / Wed 22 May 2024 Market Recap
22 May 2024: Nifty 50 closes +0.41% at ₹22,621.44 with NTPC Leading the Charge! HDFC Life Slumps. Discover Top Stocks that Hit All-Time Highs!
Show Table of Contents
Table of Contents
- 1: Top Indices Performance Overview
- 2: Nifty 50 Performance Overview
- 2.1: Nifty 50 Top Gainers
- 2.2: Nifty 50 Top Losers
- 2.3: Nifty 50 Stocks To Watch for Tomorrow
- 2.3.1: ➲ NTPC (Bullish Pattern)
- 2.3.2: ➲ HDFC Life (Bearish Pattern)
- 3: Nifty 500 Performance Overview
- 3.1: Nifty 500 Top Gainers
- 3.2: Nifty 500 Top Losers
- 3.3: Nifty 51 to 500 Stocks To Watch for Tomorrow
- 3.3.1: ➲ Macrotech Developers (Bullish Pattern)
- 3.3.2: ➲ Brightcom Group (Bearish Pattern)
- 4: Top Stocks That Created a New All Time High Today
- 4.1: Top Large Cap Stocks That Created a New All Time High Today
- 4.2: Top Mid Cap Stocks That Created a New All Time High Today
- 4.3: Top Small Cap Stocks That Created a New All Time High Today
Top Indices Performance Overview
| Stock | Close | Range |
|---|---|---|
| NIFTY 50 | ₹22,621.44 (0.41%) | ₹22,485.44 – ₹22,626.44 |
| NIFTY BANK | ₹47,906.05 (-0.3%) | ₹47,443.25 – ₹48,102.3 |
| NIFTY FIN SERVICE | ₹21,370.15 (-0.32%) | ₹21,201.9 – ₹21,458.9 |
| NIFTY IT | ₹33,597.69 (0.65%) | ₹33,367.55 – ₹33,723.69 |
| NIFTY AUTO | ₹23317 (-0.16%) | ₹23,202.5 – ₹23,388.25 |
| NIFTY ENERGY | ₹41346 (0.91%) | ₹40,948.69 – ₹41,396.94 |
Nifty 50 Performance Overview
The Nifty 50 commenced trading at ₹22,569.9 this morning. It fluctuated throughout the session, reaching a low of ₹22,485.44 and a high of ₹22,626.44 before ending the day at ₹22,621.44, a gain of 0.41%.
The table below lists the stocks that significantly influenced the Nifty 50’s performance today, with the top gainers and losers.
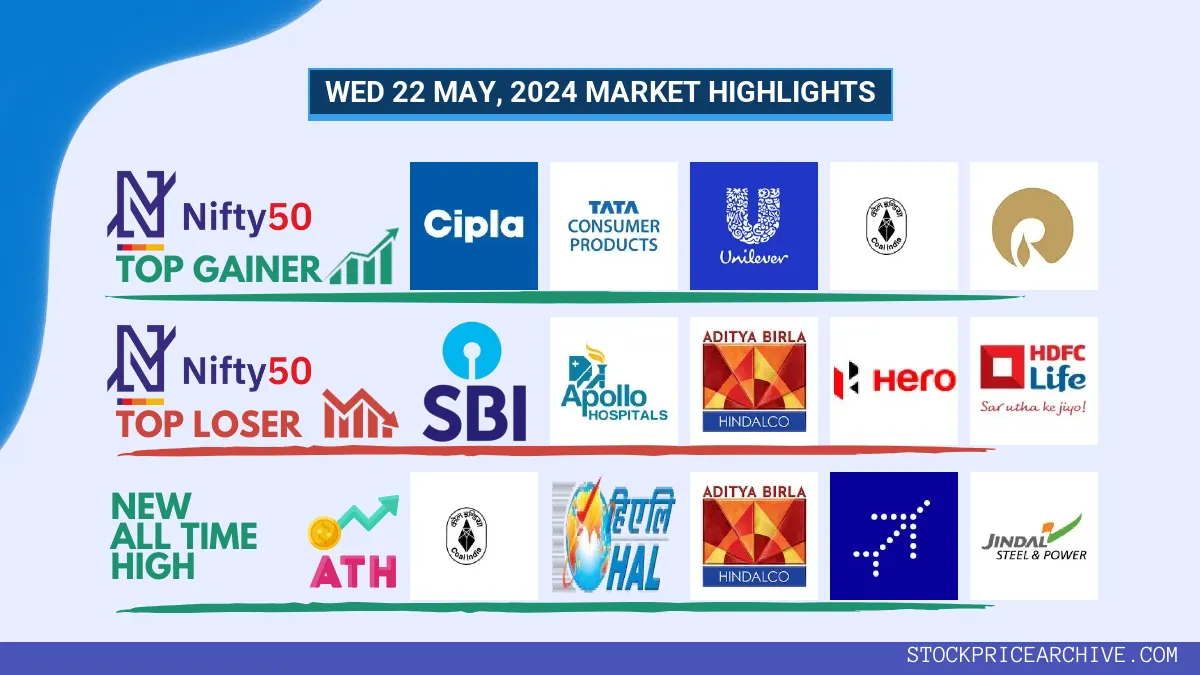
Nifty 50 Top Gainers
| Stock | Close | Range |
|---|---|---|
| Cipla | ₹1482 (2.75%) | ₹1,437.84 – ₹1,494.55 |
| Tata Consumer Products | ₹1121 (2.47%) | ₹1,093.94 – ₹1122 |
| Hindustan Unilever | ₹2,366.19 (2.4%) | ₹2,315.44 – ₹2374 |
| Coal India | ₹501.1 (2.13%) | ₹492.2 – ₹507.29 |
| Reliance Industries | ₹2920 (1.66%) | ₹2,877.05 – ₹2,937.25 |
Nifty 50 Top Losers
| Stock | Close | Range |
|---|---|---|
| SBI | ₹818.75 (-1.44%) | ₹813.59 – ₹826.4 |
| Apollo Hospitals | ₹5,870.95 (-1.3%) | ₹5845 – ₹5955 |
| Hindalco | ₹685.04 (-1.24%) | ₹677.4 – ₹696.5 |
| Hero MotoCorp | ₹4,996.75 (-1.13%) | ₹4,965.04 – ₹5,057.5 |
| HDFC Life | ₹560.75 (-0.86%) | ₹559.7 – ₹566.75 |
Nifty 50 Stocks To Watch for Tomorrow
➲ NTPC (Bullish Pattern)
- Performance Overview: In the last 25 trading sessions, NTPC has closed in green 15 times and in red 10 times.
- Recent Trend: NTPC has been on a 7-day green streak, without a single day closing in red since Monday, May 13, 2024.
- Returns: NTPC gave a 3.65% returns in the last 25 trading sessions, that means your investment of ₹10,000 would have become ₹10,365
- Financial Insight: Over the past 12 months, NTPC has generated revenue of ₹1,75,131.73 Crore and created a profit of ₹19,503.82 Crore.
- As of Wednesday, May 22, 2024, NTPC has a Market Capital of ₹3,54,364.81 Crore.
- Summary: NTPC exhibits a robust bullish pattern. Investors should monitor its price movements targets for both short-term and long-term growth prospects: Checkout NTPC Target for Tomorrow and NTPC Targets for 2024 & 2025.
NTPC Financial Performance
| Metric | Value | Description |
|---|---|---|
| Market Capital | 3,54,364.81 Crore | Market valuation of NTPC’s shares. |
| Revenue (TTM) | 1,75,131.73 Crore | Total revenue generated by NTPC over the past twelve months. |
| Net Income (TTM) | +19,503.82 Crore | Net Profit or Loss after all the expenses over the past twelve months. |
| Operating Margin | 17.02% | Income from operations as a percentage of revenue, before taxes and interest. |
| Profit Margin | 11.13% | Net income as a percentage of revenue, after all expenses. |
| Revenue Growth (Quarterly) | -4% | Change in revenue compared to the previous quarter. |
| Earnings Growth (YOY Quarterly) | +7.9% | Change in earnings compared to the same quarter last year. |
| Debt-to-Equity (D/E) Ratio | 140.99 | Company’s total debt divided by total shareholder equity. |
| Total Debt | 2,22,551.52 Crore | Sum of NTPC’s current & long-term financial obligations. |
| Total Cash | 7,888.13 Crore | Total amount of liquid funds available to NTPC. |
| Beta | 0.45 | Beta is less than 1 indicating that the NTPC’s price is less volatile than the market. |
➲ HDFC Life (Bearish Pattern)
- Performance Overview: In the recent 25 trading sessions, HDFC Life has closed in red 17 times and in green only 7 times, suggesting a bearish trend.
- Recent Trend: HDFC Life has been on a 3-day red streak, with no green days since Friday, May 17, 2024.
- Returns: HDFC Life has delivered negative returns of -7.93% over the last 25 trading sessions. An investment of ₹10,000 would now be worth approximately ₹9,207.
- Financial Insight: Over the past 12 months, HDFC Life has reported revenue of ₹1,01,966.28 Crore and a profit of ₹1,574.08 Crore.
- As of Wednesday, May 22, 2024, HDFC Life has a Market Capital of ₹1,22,615.81 Crore.
- Summary: HDFC Life is currently in a bearish phase. We encourage investors to monitor the stock’s performance, particularly its short-term targets and long-term targets for 2024 & 2025, to make informed trading decisions.
HDFC Life Financial Performance
| Metric | Value | Description |
|---|---|---|
| Market Capital | 1,22,615.81 Crore | Market valuation of HDFC Life’s shares. |
| Revenue (TTM) | 1,01,966.28 Crore | Total revenue generated by HDFC Life over the past twelve months. |
| Net Income (TTM) | +1,574.08 Crore | Net Profit or Loss after all the expenses over the past twelve months. |
| Operating Margin | 1.59% | Income from operations as a percentage of revenue, before taxes and interest. |
| Profit Margin | 1.54% | Net income as a percentage of revenue, after all expenses. |
| Revenue Growth (Quarterly) | +32.6% | Change in revenue compared to the previous quarter. |
| Earnings Growth (YOY Quarterly) | +13.7% | Change in earnings compared to the same quarter last year. |
| Debt-to-Equity (D/E) Ratio | 6.47 | Company’s total debt divided by total shareholder equity. |
| Total Debt | 950 Crore | Sum of HDFC Life’s current & long-term financial obligations. |
| Total Cash | 1,558.61 Crore | Total amount of liquid funds available to HDFC Life. |
| Beta | 0.75 | Beta is less than 1 indicating that the HDFC Life’s price is less volatile than the market. |
Nifty 500 Performance Overview
The Nifty 500 opened the session at ₹21,252.25. It swung between a low of ₹21,103.75 and a high of ₹21,261.69. It finally closed the day at ₹21,258.5, a gain of 0.33%.
The top gainers and losers that influenced the Nifty 500’s movement are listed below.
Nifty 500 Top Gainers
| Stock | Close | Range |
|---|---|---|
| PNC Infratech | ₹517.84 (13.1%) | ₹475 – ₹535.4 |
| General Insurance Corp | ₹379.39 (10.06%) | ₹348.1 – ₹384 |
| Finolex Cables | ₹1160 (9.62%) | ₹1,040.5 – ₹1171 |
| BEML | ₹4551 (8.94%) | ₹4,181.6 – ₹4680 |
| JBM Auto | ₹1928 (6.66%) | ₹1805 – ₹1,936.59 |
Nifty 500 Top Losers
| Stock | Close | Range |
|---|---|---|
| Gujarat State Fertilizers & Chemicals | ₹222 (-7.98%) | ₹220.55 – ₹226.8 |
| MEDANTA (Global Health) | ₹1243 (-6.91%) | ₹1,214.94 – ₹1333 |
| Rainbow Childrens Medicare | ₹1,254.5 (-5.53%) | ₹1,254.05 – ₹1,323.05 |
| BHEL | ₹302.39 (-5.27%) | ₹295.45 – ₹309.5 |
| Brightcom Group | ₹9.55 (-4.98%) | ₹9.55 – ₹9.55 |
Nifty 51 to 500 Stocks To Watch for Tomorrow
➲ Macrotech Developers (Bullish Pattern)
- Performance Overview: In the previous 25 trading sessions, Macrotech Developers closed in green 17 times and in red 8 times.
- Recent Trend: Macrotech Developers has been on a 10-day rising trend, with no single day closing in red since Wednesday, May 8, 2024..
- Returns: Macrotech Developers delivered a 9.76% return in the last 25 trading sessions, which means an investment of ₹10,000 would have grown to ₹10,976.
- Financial Performance: Over the past 12 months, Macrotech Developers generated a revenue of ₹10,316.1 Crore and a profit of ₹1,549.1 Crore.
- As of Wednesday, May 22, 2024, Macrotech Developers has a Market Capitalization of ₹1,19,340.08 Crore.
- Outlook: Macrotech Developers exhibits a strong bullish pattern. Investors should monitor its price movements to identify potential short-term and long-term growth opportunities.
Macrotech Developers Financial Performance
| Metric | Value | Description |
|---|---|---|
| Market Capital | 1,19,340.08 Crore | Market valuation of Macrotech Developers’s shares. |
| Revenue (TTM) | 10,316.1 Crore | Total revenue generated by Macrotech Developers over the past twelve months. |
| Net Income (TTM) | +1,549.1 Crore | Net Profit or Loss after all the expenses over the past twelve months. |
| Operating Margin | 23.13% | Income from operations as a percentage of revenue, before taxes and interest. |
| Profit Margin | 15.01% | Net income as a percentage of revenue, after all expenses. |
| Revenue Growth (Quarterly) | +23.4% | Change in revenue compared to the previous quarter. |
| Earnings Growth (YOY Quarterly) | -10.6% | Change in earnings compared to the same quarter last year. |
| Debt-to-Equity (D/E) Ratio | 43.9 | Company’s total debt divided by total shareholder equity. |
| Total Debt | 7,697.59 Crore | Sum of Macrotech Developers’s current & long-term financial obligations. |
| Total Cash | 4,642.19 Crore | Total amount of liquid funds available to Macrotech Developers. |
| Beta | 0.37 | Beta is less than 1 indicating that the Macrotech Developers’s price is less volatile than the market. |
➲ Brightcom Group (Bearish Pattern)
- Performance Overview: Over the past 25 trading days, Brightcom Group has concluded the session in the red 17 times, while green numbers have been observed only 5 times.
- Recent Trend: Currently, Brightcom Group is in a bearish streak that has spanned 6 trading sessions, without a single day ending in green since Tuesday, 14th May 2024.
- Returns: Regarding returns, Brightcom Group has yielded a -34.14% over the past 25 trading sessions. This means that an initial investment of ₹10,000 would have dwindled to around ₹6,586.
- Financial Snapshot: In the last 12 months, Brightcom Group has reported a revenue of ₹7,606.48 Crore and a profit of ₹1,415.23 Crore.
- As of Wednesday, 22nd May 2024, Brightcom Group has a Market Capitalization of ₹2,242.47 Crore.
- Summary: Brightcom Group is currently facing a bearish market trend. We recommend investors to monitor the situation closely, particularly with regard to the Brightcom Group Target for Tomorrow and Brightcom Group Targets for 2024 & 2025.
Brightcom Group Financial Performance
| Metric | Value | Description |
|---|---|---|
| Market Capital | 2,242.47 Crore | Market valuation of Brightcom Group’s shares. |
| Revenue (TTM) | 7,606.48 Crore | Total revenue generated by Brightcom Group over the past twelve months. |
| Net Income (TTM) | +1,415.23 Crore | Net Profit or Loss after all the expenses over the past twelve months. |
| Operating Margin | 26.37% | Income from operations as a percentage of revenue, before taxes and interest. |
| Profit Margin | 18.6% | Net income as a percentage of revenue, after all expenses. |
| Revenue Growth (Quarterly) | +14.2% | Change in revenue compared to the previous quarter. |
| Earnings Growth (YOY Quarterly) | +16% | Change in earnings compared to the same quarter last year. |
| Total Cash | 1,411.72 Crore | Total amount of liquid funds available to Brightcom Group. |
| Beta | 0.95 | Beta is less than 1 indicating that the Brightcom Group’s price is less volatile than the market. |
Top Stocks That Created a New All Time High Today
Top Large Cap Stocks That Created a New All Time High Today
Companies with Market Capital more than 20,000 Crores| Stock | Close | New All-Time High (ATH) | Previous ATH | Previous ATH Date |
|---|---|---|---|---|
| Adani Power | 694.29 (+2.09%) | 715.00 (+10.53%) | 646.84 | Thu 04 Apr 2024 |
| Aurobindo Pharma | 1225.00 (+0.55%) | 1231.40 (+%) | Thu 01 Jan 1970 | |
| Coal India | 501.10 (+2.12%) | 507.29 (+%) | Thu 01 Jan 1970 | |
| Cochin Shipyard | 1637.59 (-0.21%) | 1709.00 (+%) | Thu 01 Jan 1970 | |
| Dixon Technologies | 9293.00 (+1.84%) | 9480.00 (+18.75%) | 7983.00 | Fri 12 Apr 2024 |
Top Mid Cap Stocks That Created a New All Time High Today
Companies with Market Capital between 5,000 Crores to 20,000 Crores| Stock | Close | New All-Time High (ATH) | Previous ATH | Previous ATH Date |
|---|---|---|---|---|
| Aarti Pharmalabs | 601.95 (+3.88%) | 638.75 (+%) | Thu 01 Jan 1970 | |
| Astra Microwave Products | 780.29 (+2.36%) | 783.95 (+8.85%) | 720.20 | Tue 23 Apr 2024 |
| BEML | 4551.00 (+8.94%) | 4680.00 (+%) | Thu 01 Jan 1970 | |
| CEBBCO | 556.54 (+4.81%) | 566.25 (+30.53%) | 433.80 | Mon 01 Jan 2024 |
| CMS Info Systems | 449.00 (+3.04%) | 450.00 (+%) | Thu 01 Jan 1970 |
Top Small Cap Stocks That Created a New All Time High Today
Companies with Market Capital less than 5,000 Crores| Stock | Close | New All-Time High (ATH) | Previous ATH | Previous ATH Date |
|---|---|---|---|---|
| Ahmedabad Steelcraft | 55.04 (+4.99%) | 55.04 (+%) | Thu 01 Jan 1970 | |
| Alicon Castalloy | 1066.00 (+8.57%) | 1132.00 (+%) | Thu 01 Jan 1970 | |
| AMBO AGRITEC LIMITED | 66.67 (+4.99%) | 66.67 (+%) | Thu 01 Jan 1970 | |
| Arnold Holdings Ltd. | 46.50 (-2.99%) | 50.00 (+%) | Thu 01 Jan 1970 | |
| ATV Projects India | 28.58 (+1.74%) | 29.49 (+%) | Thu 01 Jan 1970 |