Home / Wed 08 May 2024 Market Recap
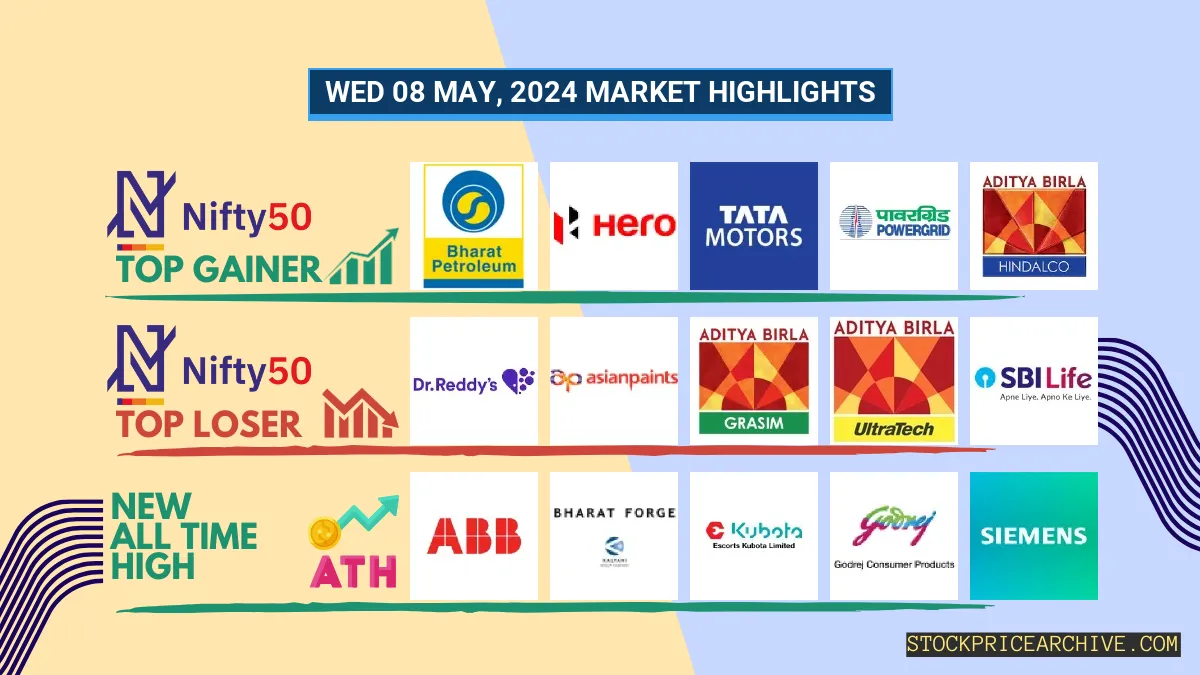
08 May 2024: Tata, TITAN Carve Distinct Paths; Oil India, Allcargo Present Watchlist Opportunities
Show Table of Contents
Table of Contents
- 1: Top Indices Performance Overview
- 2: Nifty 50 Performance Overview
- 2.1: Nifty 50 Top Gainers
- 2.2: Nifty 50 Top Losers
- 2.3: Nifty 50 Stocks To Watch for Tomorrow
- 2.3.1: ➲ Tata Consumer Products (Bullish Pattern)
- 2.3.2: ➲ TITAN (Bearish Pattern)
- 3: Nifty 500 Performance Overview
- 3.1: Nifty 500 Top Gainers
- 3.2: Nifty 500 Top Losers
- 3.3: Nifty 51 to 500 Stocks To Watch for Tomorrow
- 3.3.1: ➲ Oil India (Bullish Pattern)
- 3.3.2: ➲ Allcargo Logistics (Bearish Pattern)
- 4: Top Stocks That Created a New All Time High Today
- 4.1: Top Large Cap Stocks That Created a New All Time High Today
- 4.2: Top Mid Cap Stocks That Created a New All Time High Today
- 4.3: Top Small Cap Stocks That Created a New All Time High Today
Top Indices Performance Overview
| Stock | Close | Range |
|---|---|---|
| NIFTY 50 | ₹22,310.34 (0.03%) | ₹22,187.34 – ₹22,367.9 |
| NIFTY BANK | ₹48,021.1 (-0.55%) | ₹47,851.14 – ₹48,223.05 |
| NIFTY FIN SERVICE | ₹21,455.34 (-0.41%) | ₹21,396.69 – ₹21,526.9 |
| NIFTY IT | ₹33,329.6 (-0.43%) | ₹33,237.1 – ₹33,487.8 |
| NIFTY AUTO | ₹22,473.15 (1.62%) | ₹21,962.9 – ₹22,487.55 |
| NIFTY ENERGY | ₹39,652.69 (1.58%) | ₹38,923.44 – ₹39,916.5 |
Nifty 50 Performance Overview
The Nifty 50 opened the day at ₹22,243.09 and witnessed fluctuations throughout the session. It reached a low of ₹22,187.34 and a high of ₹22,367.9, before closing at ₹22,310.34 (+0.03%).Nifty 50 Top Gainers
| Stock | Close | Range |
|---|---|---|
| Bharat Petroleum | ₹621.95 (2.92%) | ₹604.04 – ₹624.29 |
| Hero MotoCorp | ₹4588 (2.48%) | ₹4,414.64 – ₹4660 |
| Tata Motors | ₹1,012.09 (2.38%) | ₹977 – ₹1015 |
| Power Grid | ₹302 (2.28%) | ₹292 – ₹302.85 |
| Hindalco | ₹633.95 (2.21%) | ₹615.45 – ₹634.4 |
Nifty 50 Top Losers
| Stock | Close | Range |
|---|---|---|
| Dr Reddy Lab | ₹6048 (-3.35%) | ₹5,953.35 – ₹6114 |
| Asian Paints | ₹2,848.69 (-2.21%) | ₹2821 – ₹2,900.1 |
| GRASIM | ₹2,372.6 (-2%) | ₹2371 – ₹2,423.6 |
| UltraTech Cement | ₹9,519.4 (-1.69%) | ₹9,501.4 – ₹9,674.95 |
| SBI Life Insurance | ₹1,426.75 (-1.62%) | ₹1423 – ₹1,465.94 |
Nifty 50 Stocks To Watch for Tomorrow
➲ Tata Consumer Products (Bullish Pattern)
- Performance Overview: In the last 24 trading sessions, Tata Consumer Products has closed in green 13 times and in red 11 times.
- Recent Trend: Tata Consumer Products has been on a 4-day green streak, without a single day closing in red since Thu 02 May 2024.
- Returns: Tata Consumer Products gave a 2.12% returns in the last 24 trading sessions, that means your investment of ₹10,000 would have become ₹10,212
- Financial Insight: Tata Consumer Products reported a net profit of ₹301.51 Crore in 2023-Q3 Income Statement.
- As of Wed 08 May 2024, Tata Consumer Products has a Market Capital of ₹1,05,864.55 Crore.
- Summary: Tata Consumer Products exhibits a robust bullish pattern. Investors should monitor its price movements targets for both short-term and long-term growth prospects: Checkout Tata Consumer Products Target for Tomorrow and Tata Consumer Products Targets for 2024 & 2025.
Tata Consumer Products Financial Performance
| Metric | Value | Description |
|---|---|---|
| Revenue Growth (Quarterly) | +8.5% | Change in revenue compared to the previous quarter. |
| Earnings Growth (YOY Quarterly) | -19.3% | Change in earnings compared to the same quarter last year. |
| Operating Margin | 13.08% | Income from operations as a percentage of revenue, before taxes and interest. |
| Profit Margin | 7.56% | Net income as a percentage of revenue, after all expenses. |
| Debt-to-Equity (D/E) Ratio | 19.94 | Company’s total debt divided by total shareholder equity. |
| Beta | 0.49 | Beta is less than 1 indicating that the Tata Consumer Products’s price is less volatile than the market. |
➲ TITAN (Bearish Pattern)
- Performance Overview: In the last 24 trading sessions, TITAN has closed in red 15 times and in green 9 times.
- Recent Trend: TITAN has been on a 6-day red streak, without a single day closing in green since Mon 29 Apr 2024.
- Returns: TITAN gave a -13.17% returns in the last 24 trading sessions, that means your investment of ₹10,000 would have become ₹8,683
- Financial Insight: TITAN reported a net profit of 1,053 Crore in 2023-Q3 Income Statement.
- As of Wed 08 May 2024, Tata Consumer Products has a Market Capital of ₹3,18,388.72 Crore.
- Summary: TITAN is currently experiencing a bearish phase. We advise investors to keep a close watch, especially on TITAN Target for Tomorrow and TITAN Targets for 2024 & 2025.
TITAN Financial Performance
| Metric | Value | Description |
|---|---|---|
| Revenue Growth (Quarterly) | +22% | Change in revenue compared to the previous quarter. |
| Earnings Growth (YOY Quarterly) | +16.5% | Change in earnings compared to the same quarter last year. |
| Operating Margin | 9.96% | Income from operations as a percentage of revenue, before taxes and interest. |
| Profit Margin | 7.05% | Net income as a percentage of revenue, after all expenses. |
| Debt-to-Equity (D/E) Ratio | 114.35 | Company’s total debt divided by total shareholder equity. |
| Beta | 0.46 | Beta is less than 1 indicating that the TITAN’s price is less volatile than the market. |
Nifty 500 Performance Overview
Nifty 500 commenced the trading day at ₹20,592.68, oscillating throughout the session. It plunged to a low of ₹20,516.75 and surged to a high of ₹20,768.4 before closing at ₹20,713.55, gaining 0.37%.
Top Gainers and Losers played a significant role in shaping the Nifty 500’s performance.
Nifty 500 Top Gainers
| Stock | Close | Range |
|---|---|---|
| Bharat Forge | ₹1435 (15.73%) | ₹1,209.15 – ₹1,443.34 |
| Balaji Amines | ₹2,307.35 (10.38%) | ₹2,070.64 – ₹2,400.05 |
| Capri Global | ₹232.5 (9.12%) | ₹213 – ₹237.3 |
| Ingersoll Rand | ₹4,421.39 (8.3%) | ₹4,060.3 – ₹4438 |
| Century Textile | ₹1,988.05 (7.85%) | ₹1,852.05 – ₹2,057.8 |
Nifty 500 Top Losers
| Stock | Close | Range |
|---|---|---|
| Sonata Software | ₹540.04 (-15.39%) | ₹530 – ₹569 |
| Rainbow Childrens Medicare | ₹1354 (-6.62%) | ₹1336 – ₹1448 |
| Jindal Saw | ₹533.45 (-6.08%) | ₹521.7 – ₹567 |
| Gujarat Fluorochemical | ₹3306 (-5.78%) | ₹3285 – ₹3,505.05 |
| Sterlite Technologies | ₹124.65 (-5.21%) | ₹123.1 – ₹133.75 |
Nifty 51 to 500 Stocks To Watch for Tomorrow
➲ Oil India (Bullish Pattern)
- Performance Overview: In the last 24 trading sessions, Oil India has closed in green 15 times and in red 9 times.
- Recent Trend: Oil India has been on a 5-day green streak, without a single day closing in red since Tue 30 Apr 2024.
- Returns: Oil India gave a 7.67% returns in the last 24 trading sessions, that means your investment of ₹10,000 would have become ₹10,767
- Financial Insight: Oil India reported a net profit of ₹2,607.66 Crore in 2023-Q3 Income Statement.
- As of Wed 08 May 2024, Oil India has a Market Capital of ₹68,209.39 Crore.
- Summary: Oil India exhibits a robust bullish pattern. Investors should monitor its price movements. Explore Oil India Target for Tomorrow and Oil India Targets for 2024 & 2025 for detailed insights.
Oil India Financial Performance
| Metric | Value | Description |
|---|---|---|
| Revenue Growth (Quarterly) | +3.4% | Change in revenue compared to the previous quarter. |
| Earnings Growth (YOY Quarterly) | +2.7% | Change in earnings compared to the same quarter last year. |
| Operating Margin | 29.82% | Income from operations as a percentage of revenue, before taxes and interest. |
| Profit Margin | 18.84% | Net income as a percentage of revenue, after all expenses. |
| Debt-to-Equity (D/E) Ratio | 51.06 | Company’s total debt divided by total shareholder equity. |
| Beta | 0.75 | Beta is less than 1 indicating that the Oil India’s price is less volatile than the market. |
➲ Allcargo Logistics (Bearish Pattern)
- Performance Overview: In the last 24 trading sessions, Allcargo Logistics has closed in red 14 times and in green 10 times.
- Recent Trend: Allcargo Logistics has been on a 9-day red streak, without a single day closing in green since Wed 24 Apr 2024.
- Returns: Allcargo Logistics gave a -6.89% returns in the last 24 trading sessions, that means your investment of ₹10,000 would have become ₹9,311
- Financial Insight: Allcargo Logistics reported a net profit of 17.36 Crore in 2023-Q3 Income Statement.
- As of Wed 08 May 2024, Allcargo Logistics has a Market Capital of ₹7,282.41 Crore.
- Summary: Allcargo Logistics is currently experiencing a bearish phase. Investors should closely monitor Allcargo Logistics Target for Tomorrow and Allcargo Logistics Targets for 2024 & 2025.
Allcargo Logistics Financial Performance
| Metric | Value | Description |
|---|---|---|
| Revenue Growth (Quarterly) | +111.9% | Change in revenue compared to the previous quarter. |
| Earnings Growth (YOY Quarterly) | +298.3% | Change in earnings compared to the same quarter last year. |
| Operating Margin | 5.6% | Income from operations as a percentage of revenue, before taxes and interest. |
| Profit Margin | 1.64% | Net income as a percentage of revenue, after all expenses. |
| Debt-to-Equity (D/E) Ratio | 0.65 | Company’s total debt divided by total shareholder equity. |
| Beta | 0.8 | Beta is less than 1 indicating that the Allcargo Logistics’s price is less volatile than the market. |
Top Stocks That Created a New All Time High Today
Top Large Cap Stocks That Created a New All Time High Today
Companies with Market Capital more than 20,000 Crores| Stock | Close | New All-Time High (ATH) | Previous ATH | Previous ATH Date |
|---|---|---|---|---|
| ABB India | 7170.04 (+4.08%) | 7216.75 (+6.94%) | 6747.89 | Mon 08 Apr 2024 |
| Bharat Forge | 1435.00 (+15.73%) | 1443.34 (+%) | Thu 01 Jan 1970 | |
| Century Textile | 1988.05 (+7.85%) | 2057.80 (+5.94%) | 1942.25 | Mon 22 Apr 2024 |
| Escorts | 3536.94 (+2.79%) | 3570.00 (+%) | Thu 01 Jan 1970 | |
| Godrej Consumer | 1349.80 (+2.07%) | 1372.00 (+%) | Thu 01 Jan 1970 |
Top Mid Cap Stocks That Created a New All Time High Today
Companies with Market Capital between 5,000 Crores to 20,000 Crores| Stock | Close | New All-Time High (ATH) | Previous ATH | Previous ATH Date |
|---|---|---|---|---|
| Arvind | 362.95 (+0.81%) | 389.95 (+17.17%) | 332.79 | Tue 23 Apr 2024 |
| Finolex Industries/Pipe | 276.00 (-2.8%) | 287.79 (+8.68%) | 264.79 | Thu 04 Apr 2024 |
| Ingersoll Rand | 4421.39 (+8.3%) | 4438.00 (+10.39%) | 4020.10 | Thu 18 Apr 2024 |
| Netweb Technologies | 1943.69 (+0.54%) | 2004.90 (+%) | Thu 01 Jan 1970 |
Top Small Cap Stocks That Created a New All Time High Today
Companies with Market Capital less than 5,000 Crores| Stock | Close | New All-Time High (ATH) | Previous ATH | Previous ATH Date |
|---|---|---|---|---|
| Aayush Food and Herbs | 274.35 (+1.98%) | 274.35 (+13.2%) | 242.35 | Thu 25 Apr 2024 |
| ABIRAFN | 73.45 (+4.98%) | 73.45 (+47.57%) | 49.77 | Thu 25 Apr 2024 |
| Ace Software Exports | 155.69 (+1.99%) | 155.69 (+3.59%) | 150.28 | Mon 01 Apr 2024 |
| Allsec Technologies | 1021.29 (+6.64%) | 1044.75 (+%) | Thu 01 Jan 1970 | |
| AMBO AGRITEC LIMITED | 52.20 (+9.98%) | 52.20 (+%) | Thu 01 Jan 1970 |