Home / Tue 21 May 2024 Market Recap
21 May 2024: Nifty 50 Closes Flat at ₹22,508.05 (+0.02%) with Tata Steel & Infosys Leading the Charge, Macrotech Developers Hits a New High!
Show Table of Contents
Table of Contents
- 1: Top Indices Performance Overview
- 2: Nifty 50 Performance Overview
- 2.1: Nifty 50 Top Gainers
- 2.2: Nifty 50 Top Losers
- 2.3: Nifty 50 Stocks To Watch for Tomorrow
- 2.3.1: ➲ Tata Steel (Bullish Pattern)
- 2.3.2: ➲ Infosys (Bearish Pattern)
- 3: Nifty 500 Performance Overview
- 3.1: Nifty 500 Top Gainers
- 3.2: Nifty 500 Top Losers
- 3.3: Nifty 51 to 500 Stocks To Watch for Tomorrow
- 3.3.1: ➲ Macrotech Developers (Bullish Pattern)
- 3.3.2: ➲ Brightcom Group (Bearish Pattern)
- 4: Top Stocks That Created a New All Time High Today
- 4.1: Top Large Cap Stocks That Created a New All Time High Today
- 4.2: Top Mid Cap Stocks That Created a New All Time High Today
- 4.3: Top Small Cap Stocks That Created a New All Time High Today
Top Indices Performance Overview
| Stock | Close | Range |
|---|---|---|
| NIFTY 50 | ₹22,508.05 (0.02%) | ₹22,444.44 – ₹22,589.59 |
| NIFTY BANK | ₹47,989.85 (-0.44%) | ₹47,961.19 – ₹48,259.25 |
| NIFTY FIN SERVICE | ₹21,416.59 (-0.4%) | ₹21,409.4 – ₹21,495.3 |
| NIFTY IT | ₹33,392.69 (-0.14%) | ₹33193 – ₹33,453.25 |
| NIFTY AUTO | ₹23,346.15 (0.02%) | ₹23,216.44 – ₹23,420.5 |
| NIFTY ENERGY | ₹40,946.94 (1.27%) | ₹40,343.8 – ₹41,190.25 |
Nifty 50 Performance Overview
The Nifty 50 opened the day at ₹22,512.84. Throughout the session, it experienced fluctuations, hitting a low of ₹22,470.05 and reaching a high of ₹22,520.25, before finally settling at a close of ₹22,502 (+0.15%).
The below table contains the top gainers and losers stocks that influenced the today’s Nifty 50 movement.
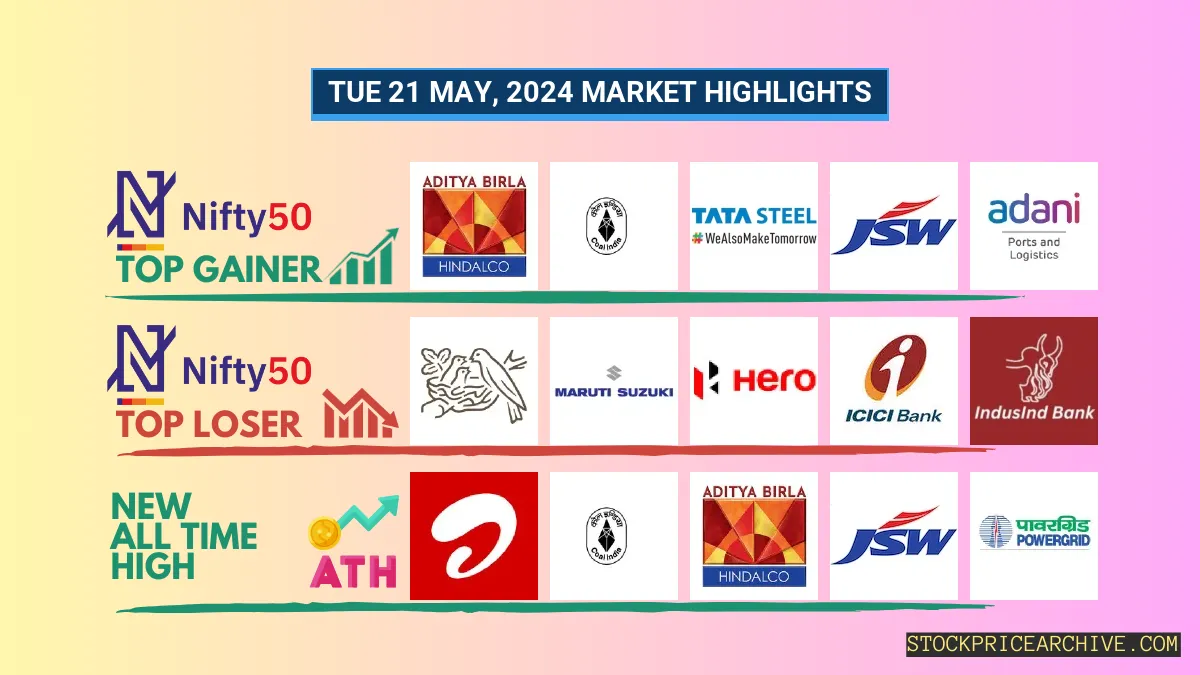
Nifty 50 Top Gainers
| Stock | Close | Range |
|---|---|---|
| Hindalco | ₹692.5 (4.87%) | ₹665 – ₹695.34 |
| Coal India | ₹490.79 (4.49%) | ₹470.1 – ₹493.89 |
| Tata Steel | ₹174.1 (3.69%) | ₹168.1 – ₹175.2 |
| JSW Steel | ₹922.4 (3.54%) | ₹891.15 – ₹928.95 |
| Adani Ports | ₹1,382.59 (3.16%) | ₹1333 – ₹1,398.8 |
Nifty 50 Top Losers
| Stock | Close | Range |
|---|---|---|
| Nestle India | ₹2464 (-1.62%) | ₹2,432.05 – ₹2,478.05 |
| Maruti Suzuki | ₹12,450.04 (-1.29%) | ₹12444 – ₹12,678.84 |
| Hero MotoCorp | ₹5,044.29 (-1.29%) | ₹5,034.5 – ₹5120 |
| ICICI BANK | ₹1119 (-1.04%) | ₹1,118.65 – ₹1,132.58 |
| IndusInd Bank | ₹1,402.8 (-1.03%) | ₹1,401.5 – ₹1,420.75 |
Nifty 50 Stocks To Watch for Tomorrow
➲ Tata Steel (Bullish Pattern)
- Performance Overview: In the past 24 trading sessions, Tata Steel has closed in the green 14 times and in the red 9 times.
- Recent Trend: Tata Steel has been on a 7-day green streak, without a single day closing in the red since Thu 09 May 2024.
- Returns: Tata Steel gave a 3.76% return in the last 24 trading sessions, that means your investment of ₹10,000 would have become ₹10,376.
- Financial Insight: Over the past 12 months, Tata Steel has generated a revenue of ₹2,33,444.99 Crore and created a profit of ₹3,344.06 Crore.
- As of Sat 18 May 2024, Tata Steel has a Market Capital of ₹2,08,911.37 Crore.
- Summary: Tata Steel exhibits a strong bullish pattern. Investors should monitor its price movements and consider it for both short-term and long-term growth prospects: Checkout Tata Steel Target for Tomorrow and Tata Steel Targets for 2024 & 2025.
Tata Steel Financial Performance
| Metric | Value | Description |
|---|---|---|
| Market Capital | 2,08,911.37 Crore | Market valuation of Tata Steel’s shares. |
| Revenue (TTM) | 2,33,444.99 Crore | Total revenue generated by Tata Steel over the past twelve months. |
| Net Income (TTM) | -3,344.06 Crore | Net Profit or Loss after all the expenses over the past twelve months. |
| Operating Margin | 6.94% | Income from operations as a percentage of revenue, before taxes and interest. |
| Profit Margin | -1.44% | Net income as a percentage of revenue, after all expenses. |
| Revenue Growth (Quarterly) | -3.1% | Change in revenue compared to the previous quarter. |
| Debt-to-Equity (D/E) Ratio | 98.81 | Company’s total debt divided by total shareholder equity. |
| Total Debt | 89,722.95 Crore | Sum of Tata Steel’s current & long-term financial obligations. |
| Total Cash | 12,590.13 Crore | Total amount of liquid funds available to Tata Steel. |
| Beta | 1.32 | Beta is greater than 1 indicating that the Tata Steel’s price is more volatile than the market. |
➲ Infosys (Bearish Pattern)
- Performance Overview: Over the past 24 trading sessions, Infosys has closed in the red 13 times and in the green 11 times.
- Recent Trend: Infosys has been on a 2-day red streak, without a single day closing in green since Thursday, May 16, 2024.
- Returns: Infosys delivered -2.46% returns in the last 24 trading sessions, meaning your investment of ₹10,000 would have dropped to ₹9,754.
- Financial Insight: In the past 12 months, Infosys has generated a revenue of ₹1,54,624.34 Crore and created a profit of ₹26,381.6 Crore.
- As of Saturday, May 18, 2024, Infosys has a Market Capital of ₹5,98,028.32 Crore.
- Summary: Infosys is currently in a bearish phase. We encourage investors to monitor the stock closely, particularly in relation to its Infosys Target for Tomorrow and Infosys Targets for 2024 & 2025.
Infosys Financial Performance
| Metric | Value | Description |
|---|---|---|
| Market Capital | 5,98,028.32 Crore | Market valuation of Infosys’s shares. |
| Revenue (TTM) | 1,54,624.34 Crore | Total revenue generated by Infosys over the past twelve months. |
| Net Income (TTM) | +26,381.6 Crore | Net Profit or Loss after all the expenses over the past twelve months. |
| Operating Margin | 20.08% | Income from operations as a percentage of revenue, before taxes and interest. |
| Profit Margin | 17.06% | Net income as a percentage of revenue, after all expenses. |
| Revenue Growth (Quarterly) | +0.2% | Change in revenue compared to the previous quarter. |
| Earnings Growth (YOY Quarterly) | +28.9% | Change in earnings compared to the same quarter last year. |
| Debt-to-Equity (D/E) Ratio | 9.44 | Company’s total debt divided by total shareholder equity. |
| Total Debt | 8,346.81 Crore | Sum of Infosys’s current & long-term financial obligations. |
| Total Cash | 27,664.44 Crore | Total amount of liquid funds available to Infosys. |
| Beta | 0.54 | Beta is less than 1 indicating that the Infosys’s price is less volatile than the market. |
Nifty 500 Performance Overview
The Nifty 500 began the day at ₹21,131.44. It fluctuated, reaching a low of ₹21,115.8 and a high of ₹21,156.44, before closing at ₹21,144.44, a 0.37% gain.
The following table shows the top gainers and losers that impacted the Nifty 500’s movement today:
Nifty 500 Top Gainers
| Stock | Close | Range |
|---|---|---|
| Hindustan Zinc | ₹743.59 (19.99%) | ₹626.59 – ₹743.59 |
| Rail Vikas Nigam | ₹339.5 (13.27%) | ₹302.14 – ₹345.5 |
| SJVN | ₹148.3 (10.1%) | ₹133.55 – ₹150.85 |
| Housing & Urban Development Corp | ₹269.1 (10.01%) | ₹240.39 – ₹273.95 |
| Cochin Shipyard | ₹1,625.3 (9.51%) | ₹1435 – ₹1,695.15 |
Nifty 500 Top Losers
| Stock | Close | Range |
|---|---|---|
| Delhivery | ₹390 (-10.32%) | ₹384.35 – ₹430.79 |
| Triveni Turbine | ₹594 (-7.02%) | ₹588 – ₹637.45 |
| Aptus Value Housing Finance | ₹298.6 (-5.51%) | ₹294.14 – ₹306.75 |
| Trident | ₹38.29 (-5.46%) | ₹37.04 – ₹38.29 |
| Godfrey Phillips | ₹3,936.55 (-5.4%) | ₹3,905.05 – ₹4129 |
Nifty 51 to 500 Stocks To Watch for Tomorrow
➲ Macrotech Developers (Bullish Pattern)
- Performance Overview: In the last 24 trading sessions, Macrotech Developers has closed in the green for 15 sessions and in red for 9 sessions.
- Recent Trend: Macrotech Developers has been on a promising 8-day green streak, without a single day closing in red since Wednesday, May 08, 2024.
- Returns: Macrotech Developers generated a noteworthy return of 5.9% in the last 24 trading sessions. This means that a hypothetical investment of ₹10,000 would have grown to ₹10,590 during this period.
- Financial Insights: Macrotech Developers had a successful financial year, generating a revenue of ₹10,316.1 Crore and a profit of ₹1,549.1 Crore in the past 12 months.
- As of Saturday, May 18, 2024, Macrotech Developers has a Market Capital of ₹1,19,340.08 Crore.
- Summary: Macrotech Developers exhibits a strong bullish pattern. Investors should consider it for short-term and long-term growth prospects. For more insights, check out Macrotech Developers’ Target for Tomorrow and Macrotech Developers’ Targets for 2024 & 2025.
Macrotech Developers Financial Performance
| Metric | Value | Description |
|---|---|---|
| Market Capital | 1,19,340.08 Crore | Market valuation of Macrotech Developers’s shares. |
| Revenue (TTM) | 10,316.1 Crore | Total revenue generated by Macrotech Developers over the past twelve months. |
| Net Income (TTM) | +1,549.1 Crore | Net Profit or Loss after all the expenses over the past twelve months. |
| Operating Margin | 23.13% | Income from operations as a percentage of revenue, before taxes and interest. |
| Profit Margin | 15.01% | Net income as a percentage of revenue, after all expenses. |
| Revenue Growth (Quarterly) | +23.4% | Change in revenue compared to the previous quarter. |
| Earnings Growth (YOY Quarterly) | -10.6% | Change in earnings compared to the same quarter last year. |
| Debt-to-Equity (D/E) Ratio | 43.9 | Company’s total debt divided by total shareholder equity. |
| Total Debt | 7,697.59 Crore | Sum of Macrotech Developers’s current & long-term financial obligations. |
| Total Cash | 4,642.19 Crore | Total amount of liquid funds available to Macrotech Developers. |
| Beta | 0.37 | Beta is less than 1 indicating that the Macrotech Developers’s price is less volatile than the market. |
➲ Brightcom Group (Bearish Pattern)
- Performance Overview: Over the past 24 trading sessions, Brightcom Group has closed in the red 16 times and in the green 5 times.
- Recent Trend: Brightcom Group has been on a 4-day red streak. It has not closed in the green since Tuesday, May 14, 2024.
- Returns: Brightcom Group has delivered a negative return of -32.38% over the last 24 trading sessions. This means your investment of ₹10,000 would now be worth ₹6,761.99
- Financial Insight: Over the past 12 months, Brightcom Group has generated a revenue of ₹7,606.48 Crore and a profit of ₹1,415.23 Crore.
- As of Saturday, May 18, 2024, Brightcom Group has a Market Capital of ₹2,242.47 Crore.
- Summary: Brightcom Group is currently experiencing a bearish trend. Investors should monitor the stock closely, particularly its Target for Tomorrow and Targets for 2024 & 2025.
Brightcom Group Financial Performance
| Metric | Value | Description |
|---|---|---|
| Market Capital | 2,242.47 Crore | Market valuation of Brightcom Group’s shares. |
| Revenue (TTM) | 7,606.48 Crore | Total revenue generated by Brightcom Group over the past twelve months. |
| Net Income (TTM) | +1,415.23 Crore | Net Profit or Loss after all the expenses over the past twelve months. |
| Operating Margin | 26.37% | Income from operations as a percentage of revenue, before taxes and interest. |
| Profit Margin | 18.6% | Net income as a percentage of revenue, after all expenses. |
| Revenue Growth (Quarterly) | +14.2% | Change in revenue compared to the previous quarter. |
| Earnings Growth (YOY Quarterly) | +16% | Change in earnings compared to the same quarter last year. |
| Total Cash | 1,411.72 Crore | Total amount of liquid funds available to Brightcom Group. |
| Beta | 0.95 | Beta is less than 1 indicating that the Brightcom Group’s price is less volatile than the market. |
Top Stocks That Created a New All Time High Today
Top Large Cap Stocks That Created a New All Time High Today
Companies with Market Capital more than 20,000 Crores| Stock | Close | New All-Time High (ATH) | Previous ATH | Previous ATH Date |
|---|---|---|---|---|
| ABB India | 8589.84 (+1.97%) | 8596.54 (+27.39%) | 6747.89 | Mon 08 Apr 2024 |
| Adani Power | 679.79 (+7.1%) | 691.75 (+6.94%) | 646.84 | Thu 04 Apr 2024 |
| Alkem Labs | 5333.89 (-1.92%) | 5578.79 (+%) | Thu 01 Jan 1970 | |
| Ashok Leyland | 211.10 (+0.23%) | 211.89 (+%) | Thu 01 Jan 1970 | |
| Aurobindo Pharma | 1217.00 (+1.21%) | 1226.69 (+%) | Thu 01 Jan 1970 |
Top Mid Cap Stocks That Created a New All Time High Today
Companies with Market Capital between 5,000 Crores to 20,000 Crores| Stock | Close | New All-Time High (ATH) | Previous ATH | Previous ATH Date |
|---|---|---|---|---|
| ASK Automotive | 315.79 (-3.64%) | 334.60 (+%) | Thu 01 Jan 1970 | |
| Astra Microwave Products | 763.95 (+0.55%) | 779.00 (+8.16%) | 720.20 | Tue 23 Apr 2024 |
| BEML | 4190.00 (+0.73%) | 4240.50 (+%) | Thu 01 Jan 1970 | |
| CEBBCO | 531.00 (+2.87%) | 541.70 (+24.87%) | 433.80 | Mon 01 Jan 2024 |
| CMS Info Systems | 434.70 (+2.28%) | 440.00 (+%) | Thu 01 Jan 1970 |
Top Small Cap Stocks That Created a New All Time High Today
Companies with Market Capital less than 5,000 Crores| Stock | Close | New All-Time High (ATH) | Previous ATH | Previous ATH Date |
|---|---|---|---|---|
| Ace Software Exports | 178.64 (-1.98%) | 185.85 (+23.66%) | 150.28 | Mon 01 Apr 2024 |
| Allsec Technologies | 1088.69 (+3.3%) | 1096.40 (+%) | Thu 01 Jan 1970 | |
| AMBO AGRITEC LIMITED | 63.50 (+4.99%) | 63.50 (+%) | Thu 01 Jan 1970 | |
| Arnold Holdings Ltd. | 48.80 (+4.99%) | 48.80 (+%) | Thu 01 Jan 1970 | |
| ATV Projects India | 28.09 (+4.97%) | 28.09 (+%) | Thu 01 Jan 1970 |
![19 Jul 2024: Nifty 50 Closes at ₹24,530.9 (-1.09%), ITC [Bullish] closing higher for the past 6 days, HDFC Bank [Bearish] closing lower for the past 4 days](https://stockpricearchive.com/wp-content/uploads/2024/07/fri-19-jul-2024-market-highlights-440x264.webp)