Home / Fri 14 Jun 2024 Market Recap
14 Jun 2024: Nifty 50 Closes at ₹23,455.50 (+0.24%): Apollo Hospitals +2.78%. Nifty 500 at ₹22,200.59 (+0.57%): BEML up +16.59%
Show Table of Contents
Table of Contents
- 1: Top Indices Performance Overview
- 2: Nifty 50 Performance Overview
- 2.1: Nifty 50 Top Gainers
- 2.2: Nifty 50 Top Losers
- 2.3: Nifty 50 Stocks To Watch for Tomorrow
- 2.3.1: ➲ Apollo Hospitals (Bullish Pattern)
- 2.3.2: ➲ Hindustan Unilever (Bearish Pattern)
- 3: Nifty 500 Performance Overview
- 3.1: Nifty 500 Top Gainers
- 3.2: Nifty 500 Top Losers
- 3.3: Nifty 51 to 500 Stocks To Watch for Tomorrow
- 3.3.1: ➲ Aditya Birla Capital (Bullish Pattern)
- 3.3.2: ➲ ARE&M (Bearish Pattern)
- 4: Top Stocks That Created a New All Time High Today
- 4.1: Top Large Cap Stocks That Created a New All Time High Today
- 4.2: Top Mid Cap Stocks That Created a New All Time High Today
- 4.3: Top Small Cap Stocks That Created a New All Time High Today
Top Indices Performance Overview
| Stock | Close | Range |
|---|---|---|
| NIFTY 50 | ₹23,455.5 (0.24%) | ₹23,334.25 – ₹23,490.4 |
| NIFTY BANK | ₹49,981.5 (0.27%) | ₹49,693.35 – ₹50,102.6 |
| NIFTY FIN SERVICE | ₹22,400.84 (0.46%) | ₹22,250.44 – ₹22,446.59 |
| NIFTY IT | ₹34,598.55 (-0.87%) | ₹34,568.85 – ₹35,035.69 |
| NIFTY AUTO | ₹25,690.94 (1.17%) | ₹25,348.5 – ₹25,773.59 |
| NIFTY ENERGY | ₹41,020.39 (0.18%) | ₹40,728.3 – ₹41,097.19 |
Nifty 50 Performance Overview
Nifty 50 Market Movement
The Nifty 50 opened the day at ₹23,443.09 and experienced fluctuations throughout the session, hitting a low of ₹23,334.25 and reaching a high of ₹23,490.40. Finally, it settled at a close of ₹23,455.50, reflecting a gain of 0.24%.
The table below lists the top gainers and losers that influenced today’s Nifty 50 movement.
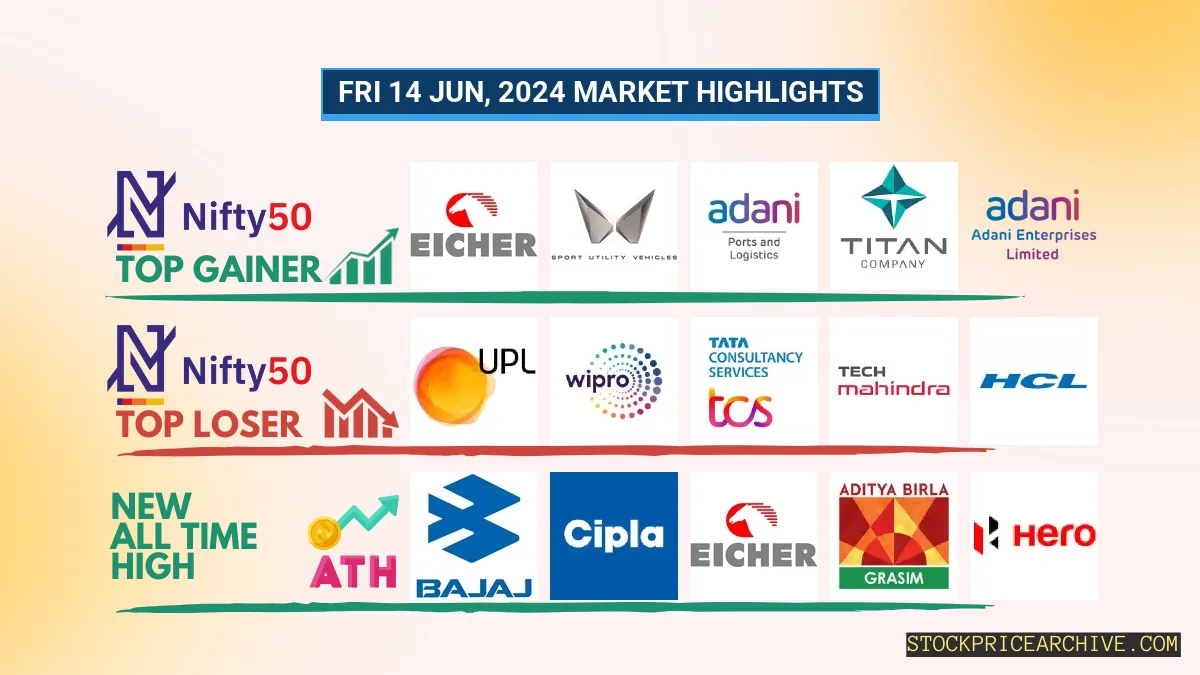
Nifty 50 Top Gainers
| Stock | Close | Range |
|---|---|---|
| Eicher Motors | ₹4,935.1 (2.78%) | ₹4,801.5 – ₹4945 |
| Mahindra & Mahindra | ₹2924 (2.17%) | ₹2,865.19 – ₹2,945.35 |
| Adani Ports | ₹1,430.69 (1.86%) | ₹1,395.44 – ₹1442 |
| TITAN | ₹3,532.44 (1.73%) | ₹3479 – ₹3535 |
| Adani Enterprises | ₹3,268.39 (1.35%) | ₹3,221.1 – ₹3275 |
Nifty 50 Top Losers
| Stock | Close | Range |
|---|---|---|
| UPL | ₹549.75 (-1.43%) | ₹549.7 – ₹559.79 |
| WIPRO | ₹476.95 (-1.18%) | ₹476.2 – ₹485.6 |
| TCS | ₹3,833.3 (-1.16%) | ₹3828 – ₹3889 |
| Tech Mahindra | ₹1373 (-1.15%) | ₹1,364.09 – ₹1,395.75 |
| HCL | ₹1,431.19 (-0.9%) | ₹1,424.55 – ₹1446 |
Nifty 50 Stocks To Watch for Tomorrow
➲ Apollo Hospitals (Bullish Pattern)
- Performance Overview: In the last 27 trading sessions, Apollo Hospitals has closed positive 17 times and negative 10 times.
- Recent Trend: Apollo Hospitals has been on a hot streak, notching up eight consecutive green days, with its last close in the red zone on Tue 04 Jun 2024.
- Returns: Investors have enjoyed a solid 5.5% return over the past 27 trading sessions, turning a hypothetical investment of ₹10,000 into a healthy ₹10,550.
- Financial Snapshot: Apollo Hospitals has achieved impressive financial results in the past year, with revenue hitting ₹19,059.19 Crore and profits reaching ₹898.6 Crore.
- As of Fri 14 Jun 2024, Apollo Hospitals boasts a substantial Market Capitalization of ₹86,303.34 Crore.
- Summary: Apollo Hospitals is flashing a strong bullish signal, presenting exciting opportunities for investors. For both short-term and long-term gains, check out: Apollo Hospitals’ Tomorrow Target and Apollo Hospitals’ Targets for 2024 & 2025.
Apollo Hospitals Financial Performance
| Metric | Value | Description |
|---|---|---|
| Market Capital | 86,303.34 Crore | Market valuation of Apollo Hospitals’s shares. |
| Revenue (TTM) | 19,059.19 Crore | Total revenue generated by Apollo Hospitals over the past twelve months. |
| Net Income (TTM) | +898.6 Crore | Net Profit or Loss after all the expenses over the past twelve months. |
| Operating Margin | 9.11% | Income from operations as a percentage of revenue, before taxes and interest. |
| Profit Margin | 4.71% | Net income as a percentage of revenue, after all expenses. |
| Revenue Growth (Quarterly) | +14.89% | Change in revenue compared to the previous quarter. |
| Earnings Growth (YOY Quarterly) | +75.59% | Change in earnings compared to the same quarter last year. |
| Debt-to-Equity (D/E) Ratio | 72.84 | Company’s total debt divided by total shareholder equity. |
| Total Debt | 5,332.6 Crore | Sum of Apollo Hospitals’s current & long-term financial obligations. |
| Total Cash | 1,617.79 Crore | Total amount of liquid funds available to Apollo Hospitals. |
| Beta | 0.56 | Beta is less than 1 indicating that the Apollo Hospitals’s price is less volatile than the market. |
➲ Hindustan Unilever (Bearish Pattern)
- Performance Overview: In the past 27 trading sessions, Hindustan Unilever has closed in the red 16 times and in the green 11 times.
- Recent Trend: Hindustan Unilever has been on a 5-day red streak, without a single day closing in green since Fri 07 Jun 2024.
- Returns: Hindustan Unilever gave a 5.65% return in the last 27 trading sessions, meaning an investment of ₹10,000 would have become ₹10,565.
- Financial Highlights: Over the past 12 months, Hindustan Unilever has generated revenue of ₹61,895.99 Crore and a profit of ₹10,276.99 Crore.
- As of Fri 14 Jun 2024, Hindustan Unilever has a Market Capital of ₹6,05,700.54 Crore.
- Summary: Hindustan Unilever is currently experiencing a bearish phase. Investors should monitor the stock closely, particularly Hindustan Unilever Target for Tomorrow and Hindustan Unilever Targets for 2024 & 2025.
Hindustan Unilever Financial Performance
| Metric | Value | Description |
|---|---|---|
| Market Capital | 6,05,700.54 Crore | Market valuation of Hindustan Unilever’s shares. |
| Revenue (TTM) | 61,895.99 Crore | Total revenue generated by Hindustan Unilever over the past twelve months. |
| Net Income (TTM) | +10,276.99 Crore | Net Profit or Loss after all the expenses over the past twelve months. |
| Operating Margin | 20.92% | Income from operations as a percentage of revenue, before taxes and interest. |
| Profit Margin | 16.6% | Net income as a percentage of revenue, after all expenses. |
| Revenue Growth (Quarterly) | -1.66% | Change in revenue compared to the previous quarter. |
| Earnings Growth (YOY Quarterly) | -1.6% | Change in earnings compared to the same quarter last year. |
| Debt-to-Equity (D/E) Ratio | 2.88 | Company’s total debt divided by total shareholder equity. |
| Total Debt | 1,484 Crore | Sum of Hindustan Unilever’s current & long-term financial obligations. |
| Total Cash | 11,888.99 Crore | Total amount of liquid funds available to Hindustan Unilever. |
| Beta | 0.07 | Beta is less than 1 indicating that the Hindustan Unilever’s price is less volatile than the market. |
Nifty 500 Performance Overview
The Nifty 500 opened the day at ₹22,148.25. Throughout the session, it experienced fluctuations, hitting a low of ₹22,054.75 and reaching a high of ₹22,229.25, before finally settling at a close of ₹22,200.59 (+0.57%).
The below table containing the top gainers and losers stocks that influenced the today’s Nifty 500 movement.
Nifty 500 Top Gainers
| Stock | Close | Range |
|---|---|---|
| BEML | ₹4698 (16.59%) | ₹4 – ₹4784 |
| Mazagoan Dock Shipbuilders | ₹3863 (13.95%) | ₹3355 – ₹3990 |
| Chemplast Sanmar | ₹621.5 (11.81%) | ₹562.75 – ₹633.9 |
| SKF India | ₹6910 (11.46%) | ₹6210 – ₹6,983.6 |
| JK Paper | ₹489.85 (9.8%) | ₹448.1 – ₹498 |
Nifty 500 Top Losers
| Stock | Close | Range |
|---|---|---|
| Usha Martin | ₹401 (-3.33%) | ₹400.2 – ₹414.89 |
| Epigral | ₹1,335.15 (-3.24%) | ₹1,329.09 – ₹1,382.8 |
| Zensar Technolgies | ₹694.84 (-2.94%) | ₹694.09 – ₹721.79 |
| V-Guard Industries | ₹399.35 (-2.65%) | ₹397 – ₹413.7 |
| Aegis Logistics | ₹815 (-2.55%) | ₹814.7 – ₹839 |
Nifty 51 to 500 Stocks To Watch for Tomorrow
➲ Aditya Birla Capital (Bullish Pattern)
- Highlights: Over the past 27 trading sessions, Aditya Birla Capital has closed in green 18 times and in red only 8 times, resulting in a 9.72% return on investment.
- Recent Trend: The stock is currently on an 8-day green streak, without a single day of loss since Tuesday, 4th June 2024.
- Financial Performance: In the last 12 months, Aditya Birla Capital generated a revenue of ₹25,591.03 Crore and a profit of ₹3,334.97 Crore.
- As of Friday, 14th June 2024, the company has a Market Capital of ₹60,580.46 Crore.
- Outlook: Aditya Birla Capital’s strong bullish pattern and consistent growth indicate positive prospects for both short-term and long-term investments. Consider exploring Aditya Birla Capital Target for Tomorrow and Aditya Birla Capital Targets for 2024 & 2025 for more insights.
Aditya Birla Capital Financial Performance
| Metric | Value | Description |
|---|---|---|
| Market Capital | 60,580.46 Crore | Market valuation of Aditya Birla Capital’s shares. |
| Revenue (TTM) | 25,591.03 Crore | Total revenue generated by Aditya Birla Capital over the past twelve months. |
| Net Income (TTM) | +3,334.97 Crore | Net Profit or Loss after all the expenses over the past twelve months. |
| Operating Margin | 17.29% | Income from operations as a percentage of revenue, before taxes and interest. |
| Profit Margin | 13.03% | Net income as a percentage of revenue, after all expenses. |
| Revenue Growth (Quarterly) | +33.8% | Change in revenue compared to the previous quarter. |
| Earnings Growth (YOY Quarterly) | +104.6% | Change in earnings compared to the same quarter last year. |
| Debt-to-Equity (D/E) Ratio | 384.93 | Company’s total debt divided by total shareholder equity. |
| Total Debt | 1,10,236.83 Crore | Sum of Aditya Birla Capital’s current & long-term financial obligations. |
| Total Cash | 3,939.16 Crore | Total amount of liquid funds available to Aditya Birla Capital. |
| Beta | 1 | Beta is greater than 1 indicating that the Aditya Birla Capital’s price is more volatile than the market. |
➲ ARE&M (Bearish Pattern)
- Performance Overview: Over the past 27 trading sessions, ARE&M has closed in the red 15 times and in the green 12 times. This indicates a slightly bearish trend.
- Recent Trend: ARE&M has been on a concerning 5-day red streak, without a single day closing in the green since Friday, June 7, 2024. This signals a continuation of the bearish momentum.
- Returns: Despite the recent downturn, ARE&M has managed to generate an impressive 18.28% return over the last 27 trading sessions. This means that an investment of ₹10,000 would have grown to ₹11,828.
- Financial Insight: In the past 12 months, Aditya Birla Capital, the parent company of ARE&M, has achieved significant financial success. The company generated a revenue of ₹11,708.43 Crore and a profit of ₹934.38 Crore. This strong financial performance indicates that ARE&M has a solid underlying business.
- As of Friday, June 14, 2024, Aditya Birla Capital has a Market Capitalization of ₹25,388.31 Crore, which reflects the overall value of the company.
- Summary: ARE&M is currently facing a bearish phase. We advise investors to monitor the situation closely, particularly by following ARE&M Target for Tomorrow and ARE&M Targets for 2024 & 2025.
ARE&M Financial Performance
| Metric | Value | Description |
|---|---|---|
| Market Capital | 25,388.31 Crore | Market valuation of ARE&M’s shares. |
| Revenue (TTM) | 11,708.43 Crore | Total revenue generated by ARE&M over the past twelve months. |
| Net Income (TTM) | +934.38 Crore | Net Profit or Loss after all the expenses over the past twelve months. |
| Operating Margin | 9.86% | Income from operations as a percentage of revenue, before taxes and interest. |
| Profit Margin | 7.98% | Net income as a percentage of revenue, after all expenses. |
| Revenue Growth (Quarterly) | +19.7% | Change in revenue compared to the previous quarter. |
| Earnings Growth (YOY Quarterly) | +64.8% | Change in earnings compared to the same quarter last year. |
| Debt-to-Equity (D/E) Ratio | 2.3 | Company’s total debt divided by total shareholder equity. |
| Total Debt | 156.68 Crore | Sum of ARE&M’s current & long-term financial obligations. |
| Total Cash | 470.88 Crore | Total amount of liquid funds available to ARE&M. |
| Beta | 0.91 | Beta is less than 1 indicating that the ARE&M’s price is less volatile than the market. |
Top Stocks That Created a New All Time High Today
Top Large Cap Stocks That Created a New All Time High Today
Companies with Market Capital more than 20,000 Crores| Stock | Close | New All-Time High (ATH) | Previous ATH | Previous ATH Date |
|---|---|---|---|---|
| ABB India | 9020.00 (+6.78%) | 9145.00 (+35.52%) | 6747.89 | Mon 08 Apr 2024 |
| Ambuja Cements | 677.20 (+1.91%) | 689.00 (+6.56%) | 646.54 | Wed 24 Apr 2024 |
| Apar Industries | 8376.00 (-1.6%) | 8740.00 (+11.33%) | 7850.00 | Wed 24 Apr 2024 |
| Ashok Leyland | 239.84 (+1.28%) | 242.69 (+%) | Thu 01 Jan 1970 | |
| Bajaj Auto | 9961.75 (+0.38%) | 9995.00 (+%) | Thu 01 Jan 1970 |
Top Mid Cap Stocks That Created a New All Time High Today
Companies with Market Capital between 5,000 Crores to 20,000 Crores| Stock | Close | New All-Time High (ATH) | Previous ATH | Previous ATH Date |
|---|---|---|---|---|
| ASK Automotive | 349.20 (+2.01%) | 358.39 (+%) | Thu 01 Jan 1970 | |
| Azad Engineering | 1797.59 (+5%) | 1797.59 (+%) | Thu 01 Jan 1970 | |
| Bikaji Foods | 725.54 (+1.51%) | 739.40 (+%) | Thu 01 Jan 1970 | |
| E.I.D. Parry | 728.00 (+1.05%) | 749.90 (+%) | Thu 01 Jan 1970 | |
| Great Eastern Shipping | 1215.80 (+2.3%) | 1241.00 (+13.12%) | 1097.00 | Wed 24 Apr 2024 |
Top Small Cap Stocks That Created a New All Time High Today
Companies with Market Capital less than 5,000 Crores| Stock | Close | New All-Time High (ATH) | Previous ATH | Previous ATH Date |
|---|---|---|---|---|
| 20 Microns | 189.53 (+4.59%) | 203.00 (+%) | Thu 01 Jan 1970 | |
| Ace Software Exports | 254.64 (+1.98%) | 254.64 (+69.44%) | 150.28 | Mon 01 Apr 2024 |
| ACGL | 2456.94 (+3.07%) | 2470.00 (+%) | Thu 01 Jan 1970 | |
| Amba Enterprises | 238.64 (+15.79%) | 243.00 (+%) | Thu 01 Jan 1970 | |
| Agarwal Industrial | 1137.90 (+5.2%) | 1180.00 (+%) | Thu 01 Jan 1970 |