Home / Mon 22 Jul 2024 Market Recap
22 Jul 2024: Nifty closed at ₹24,515.9 (-0.07%), Britannia & Karur Vysya Bank show bullish trends, while Adani Enterprises & Timken India signal bearish signs.
Show Table of Contents
Table of Contents
- 1: Top Indices Performance Overview
- 2: Nifty 50 Performance Overview
- 2.1: Nifty 50 Top Gainers
- 2.2: Nifty 50 Top Losers
- 2.3: Nifty 50 Stocks To Watch for Tomorrow
- 2.3.1: Britannia (Bullish Pattern)
- 2.3.2: ➲ Adani Enterprises (Bearish Trend)
- 3: Nifty 500 Performance Overview
- 3.1: Nifty 500 Top Gainers
- 3.2: Nifty 500 Top Losers
- 3.3: Nifty 51 to 500 Stocks To Watch for Tomorrow
- 3.3.1: Karur Vysya Bank (Bullish Pattern)
- 3.3.2: ➲ Timken India (Looking Bearish)
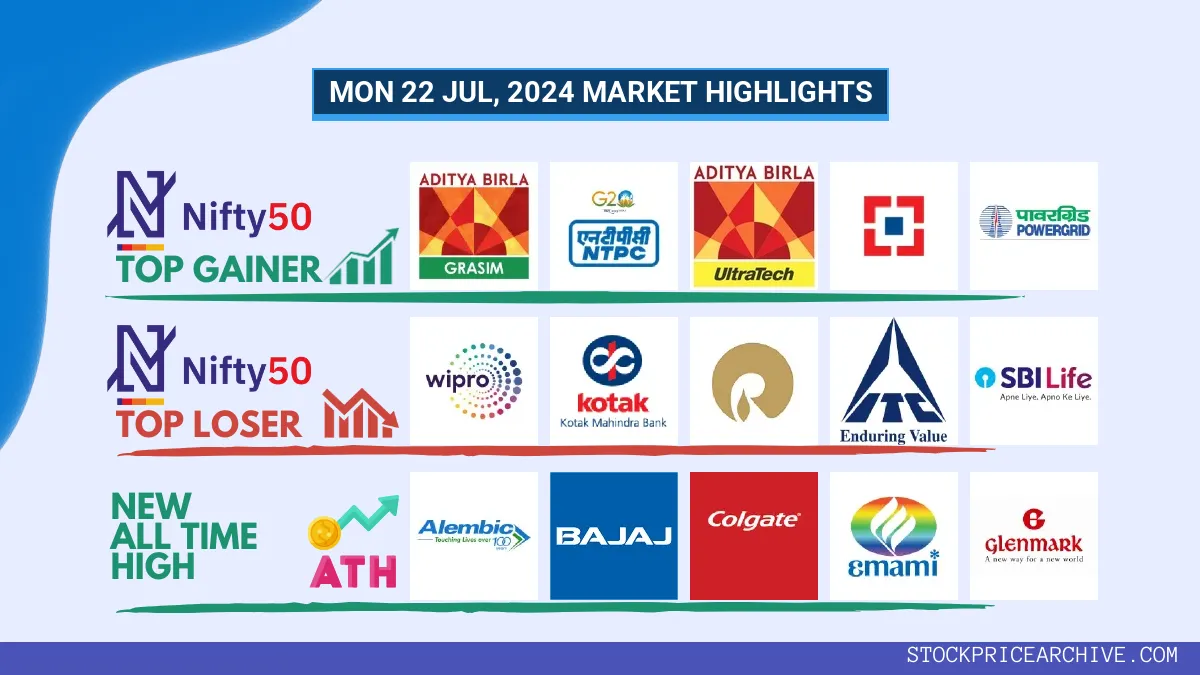
- 4: Top Stocks That Created a New All Time High Today
- 4.1: Top Large Cap Stocks That Created a New All Time High Today
- 4.2: Top Mid Cap Stocks That Created a New All Time High Today
- 4.3: Top Small Cap Stocks That Created a New All Time High Today
Top Indices Performance Overview
| Stock | Close | Range |
|---|---|---|
| NIFTY 50 | ₹24,515.9 (-0.07%) | ₹24,362.3 – ₹24,595.19 |
| NIFTY BANK | ₹52,328.6 (0.12%) | ₹51,874.55 – ₹52427 |
| NIFTY FIN SERVICE | ₹23,648.94 (0.22%) | ₹23,454.05 – ₹23,717.5 |
| NIFTY IT | ₹39,773.14 (-0.38%) | ₹39,418.44 – ₹39,945.5 |
| NIFTY AUTO | ₹25,250.75 (1.15%) | ₹24,689.8 – ₹25,292.9 |
| NIFTY ENERGY | ₹41,945.5 (-0.28%) | ₹41,467.55 – ₹42,226.39 |
Nifty 50 Performance Overview
The Nifty 50 started the day at ₹24,447.65. It saw a range of activity throughout the trading session, with a low of ₹24,362.3 and a high of ₹24,595.19. The index ultimately closed at ₹24,515.9, a slight dip of -0.07% from its opening value.
Let’s take a look at the key factors that shaped the Nifty 50’s performance today:
Nifty 50 Top Gainers
| Stock | Close | Range |
|---|---|---|
| GRASIM | ₹2,811.55 (2.49%) | ₹2702 – ₹2822 |
| NTPC | ₹373.7 (2.48%) | ₹362.35 – ₹377.25 |
| UltraTech Cement | ₹11,515.7 (2.28%) | ₹11,231.29 – ₹11570 |
| HDFC BANK | ₹1,641.94 (2.15%) | ₹1,612.65 – ₹1651 |
| Power Grid | ₹338.75 (1.97%) | ₹329.5 – ₹339.39 |
Nifty 50 Top Losers
| Stock | Close | Range |
|---|---|---|
| WIPRO | ₹505.35 (-9.31%) | ₹501.54 – ₹525.95 |
| Kotak Mahindra Bank | ₹1,757.55 (-3.52%) | ₹1,748.9 – ₹1821 |
| Reliance Industries | ₹3,004.8 (-3.4%) | ₹2,998.55 – ₹3075 |
| ITC | ₹466.29 (-1.74%) | ₹465.85 – ₹479.45 |
| SBI Life Insurance | ₹1,621.15 (-1.62%) | ₹1,618.65 – ₹1,647.69 |
Nifty 50 Stocks To Watch for Tomorrow
Britannia (Bullish Pattern)
- Performance Overview: Britannia closed higher than the previous day’s close in 19 out of the last 24 trading sessions, demonstrating a strong upward trend.
- Recent Trend: Britannia has been on a roll, closing higher for 11 consecutive days, starting from Thursday, July 4th, 2024.
- Returns: Britannia has delivered a solid 8.63% return over the past 24 trading sessions. This means if you had invested ₹10,000 during that period, your investment would have grown to ₹10,863.
- Financial Insight: In the last 12 months, Britannia has generated a revenue of ₹16,769.26 Crore and earned a profit of ₹2,139.8 Crore, indicating a healthy financial performance.
- As of Monday, July 22nd, 2024, Britannia has a Market Capital of ₹1,41,581.01 Crore, reflecting its strong position in the market.
- Summary: Britannia is showing a strong bullish pattern, making it an attractive prospect for investors. To learn more about the potential short-term and long-term growth of Britannia, check out these resources: Britannia Target for Tomorrow and Britannia Targets for 2024 & 2025.
Britannia Financial Performance
| Metric | Value | Description |
|---|---|---|
| Market Capital | 1,41,581.01 Crore | Market valuation of Britannia’s shares. |
| Revenue (TTM) | 16,769.26 Crore | Total revenue generated by Britannia over the past twelve months. |
| Net Income (TTM) | +2,139.8 Crore | Net Profit or Loss after all the expenses over the past twelve months. |
| Operating Margin | 17.38% | Income from operations as a percentage of revenue, before taxes and interest. |
| Profit Margin | 12.76% | Net income as a percentage of revenue, after all expenses. |
| Revenue Growth (Quarterly) | +2.7% | Change in revenue compared to the previous quarter. |
| Earnings Growth (YOY Quarterly) | -3.6% | Change in earnings compared to the same quarter last year. |
| Debt-to-Equity (D/E) Ratio | 52.06 | Company’s total debt divided by total shareholder equity. |
| Total Debt | 2,064.95 Crore | Sum of Britannia’s current & long-term financial obligations. |
| Total Cash | 2,142.86 Crore | Total amount of liquid funds available to Britannia. |
| Beta | 0.53 | Beta is less than 1 indicating that the Britannia’s price is less volatile than the market. |
➲ Adani Enterprises (Bearish Trend)
- Performance Overview: Over the past 24 trading days, Adani Enterprises has closed lower 15 times and higher 9 times.
- Recent Trend: Adani Enterprises has been on a downward trend for the past 3 days, with no gains since Tuesday, July 16, 2024.
- Returns: If you had invested ₹10,000 in Adani Enterprises over the last 24 trading days, your investment would have decreased to ₹9,066, representing a loss of 9.34%.
- Financial Insight: Over the past year, Britannia has generated a revenue of ₹96,420.98 Crore and earned a profit of ₹3,104.19 Crore.
- As of Monday, July 22, 2024, Britannia has a Market Capitalization of ₹3,42,649.78 Crore.
- Summary: Adani Enterprises is currently experiencing a bearish phase. We suggest investors stay informed and keep a close watch on future price movements. For insights on potential price targets, check out Adani Enterprises Target for Tomorrow and Adani Enterprises Targets for 2024 & 2025.
Adani Enterprises Financial Performance
| Metric | Value | Description |
|---|---|---|
| Market Capital | 3,42,649.78 Crore | Market valuation of Adani Enterprises’s shares. |
| Revenue (TTM) | 96,420.98 Crore | Total revenue generated by Adani Enterprises over the past twelve months. |
| Net Income (TTM) | +3,104.19 Crore | Net Profit or Loss after all the expenses over the past twelve months. |
| Operating Margin | 8.76% | Income from operations as a percentage of revenue, before taxes and interest. |
| Profit Margin | 3.36% | Net income as a percentage of revenue, after all expenses. |
| Revenue Growth (Quarterly) | -6.9% | Change in revenue compared to the previous quarter. |
| Earnings Growth (YOY Quarterly) | -37.6% | Change in earnings compared to the same quarter last year. |
| Debt-to-Equity (D/E) Ratio | 147.8 | Company’s total debt divided by total shareholder equity. |
| Total Debt | 65,310.14 Crore | Sum of Adani Enterprises’s current & long-term financial obligations. |
| Total Cash | 4,380.95 Crore | Total amount of liquid funds available to Adani Enterprises. |
| Beta | 0.93 | Beta is less than 1 indicating that the Adani Enterprises’s price is less volatile than the market. |
Nifty 500 Performance Overview
The Nifty 500 kicked off the day at ₹22,761.5, but it wasn’t a straight shot to the finish line. The index danced around, reaching a low of ₹22,668.4 and a high of ₹23,000.69, before settling at a close of ₹22,948.5 (+0.41%). This slight gain was influenced by the day’s top gainers and losers, which you can find in the table below.
Nifty 500 Top Gainers
| Stock | Close | Range |
|---|---|---|
| RCF | ₹234.8 (9.7%) | ₹210.75 – ₹242 |
| NBCC | ₹185.39 (7.87%) | ₹168.75 – ₹186.75 |
| Indian Hotels | ₹620.34 (7.34%) | ₹573.09 – ₹631.45 |
| Fertilisers & Chemicals Travancore | ₹1080 (6.36%) | ₹996.2 – ₹1104 |
| Chalet Hotels | ₹811.79 (6.05%) | ₹753.65 – ₹826 |
Nifty 500 Top Losers
| Stock | Close | Range |
|---|---|---|
| WIPRO | ₹505.35 (-9.31%) | ₹501.54 – ₹525.95 |
| Phoenix Mills | ₹3715 (-6.24%) | ₹3606 – ₹3950 |
| Tejas Networks | ₹1319 (-6.14%) | ₹1305 – ₹1,405.19 |
| Raymond | ₹1,986.3 (-5%) | ₹1,986.3 – ₹2050 |
| Brightcom Group | ₹7.62 (-4.99%) | ₹7.62 – ₹7.62 |
Nifty 51 to 500 Stocks To Watch for Tomorrow
Karur Vysya Bank (Bullish Pattern)
- Performance Overview: In the last 24 trading sessions, Karur Vysya Bank has closed in green 12 times and in red 12 times, showing some volatility.
- Recent Trend: Karur Vysya Bank has been on a 7-day green streak, closing higher each day since Wednesday, July 10th, 2024. This indicates positive momentum.
- Returns: Karur Vysya Bank delivered a 2.79% return over the past 24 trading sessions. This means an investment of ₹10,000 would have grown to ₹10,279.
- Financial Insight: Over the past 12 months, Karur Vysya Bank has generated a revenue of ₹4,738.94 Crore and a profit of ₹1,604.81 Crore. These strong financial results suggest a healthy business.
- As of Monday, July 22nd, 2024, Karur Vysya Bank has a Market Capital of ₹16,890.96 Crore.
- Summary: Karur Vysya Bank is showing a strong bullish pattern. Investors should keep an eye on its price movements and consider both short-term and long-term growth prospects. Checkout Karur Vysya Bank Target for Tomorrow and Karur Vysya Bank Targets for 2024 & 2025.
Karur Vysya Bank Financial Performance
| Metric | Value | Description |
|---|---|---|
| Market Capital | 16,890.96 Crore | Market valuation of Karur Vysya Bank’s shares. |
| Revenue (TTM) | 4,738.94 Crore | Total revenue generated by Karur Vysya Bank over the past twelve months. |
| Net Income (TTM) | +1,604.81 Crore | Net Profit or Loss after all the expenses over the past twelve months. |
| Operating Margin | 43.09% | Income from operations as a percentage of revenue, before taxes and interest. |
| Profit Margin | 33.86% | Net income as a percentage of revenue, after all expenses. |
| Revenue Growth (Quarterly) | +33% | Change in revenue compared to the previous quarter. |
| Earnings Growth (YOY Quarterly) | +35% | Change in earnings compared to the same quarter last year. |
| Debt-to-Equity (D/E) Ratio | 0.24 | Company’s total debt divided by total shareholder equity. |
| Total Debt | 2,478.34 Crore | Sum of Karur Vysya Bank’s current & long-term financial obligations. |
| Total Cash | 5,658.56 Crore | Total amount of liquid funds available to Karur Vysya Bank. |
| Beta | 0.91 | Beta is less than 1 indicating that the Karur Vysya Bank’s price is less volatile than the market. |
➲ Timken India (Looking Bearish)
- Performance Overview: In the last 24 trading days, Timken India has closed lower 19 times and higher 5 times. That means it has had a tough couple of weeks.
- Recent Trend: Timken India has been on a downward trend, closing lower for 12 straight days, since Wednesday, July 3rd, 2024.
- Returns: Investing ₹10,000 in Timken India over the past 24 trading days would have yielded ₹8,329, a loss of 16.71%.
- Financial Insight: Over the past 12 months, Timken India has generated revenue of ₹2,909.54 Crore and profits of ₹392.14 Crore.
- As of Monday, July 22nd, 2024, Timken India has a Market Capital of ₹31,142.42 Crore.
- Summary: Timken India is currently in a bearish phase. Investors should pay close attention to its performance, especially the potential for a rebound. You can check out our Timken India Target for Tomorrow and Timken India Targets for 2024 & 2025 for more insight.
Timken India Financial Performance
| Metric | Value | Description |
|---|---|---|
| Market Capital | 31,142.42 Crore | Market valuation of Timken India’s shares. |
| Revenue (TTM) | 2,909.54 Crore | Total revenue generated by Timken India over the past twelve months. |
| Net Income (TTM) | +392.14 Crore | Net Profit or Loss after all the expenses over the past twelve months. |
| Operating Margin | 19.7% | Income from operations as a percentage of revenue, before taxes and interest. |
| Profit Margin | 13.47% | Net income as a percentage of revenue, after all expenses. |
| Revenue Growth (Quarterly) | +11.89% | Change in revenue compared to the previous quarter. |
| Earnings Growth (YOY Quarterly) | +35.4% | Change in earnings compared to the same quarter last year. |
| Debt-to-Equity (D/E) Ratio | 1.04 | Company’s total debt divided by total shareholder equity. |
| Total Debt | 25.36 Crore | Sum of Timken India’s current & long-term financial obligations. |
| Total Cash | 491.85 Crore | Total amount of liquid funds available to Timken India. |
| Beta | 0.47 | Beta is less than 1 indicating that the Timken India’s price is less volatile than the market. |
Top Stocks That Created a New All Time High Today
Top Large Cap Stocks That Created a New All Time High Today
Companies with Market Capital more than 20,000 Crores| Stock | Close | New All-Time High (ATH) | Previous ATH | Previous ATH Date |
|---|---|---|---|---|
| Alembic Pharma | 1119.09 (+3.58%) | 1165.00 (+%) | Thu 01 Jan 1970 | |
| Bajaj Holdings | 9979.00 (+2.72%) | 10075.00 (+%) | Thu 01 Jan 1970 | |
| Colgate Palmolive | 3138.05 (+0.54%) | 3171.44 (+12.66%) | 2814.89 | Wed 03 Apr 2024 |
| Emami | 799.50 (-0.04%) | 844.65 (+%) | Thu 01 Jan 1970 | |
| Glenmark Pharma | 1428.00 (+1.06%) | 1436.65 (+%) | Thu 01 Jan 1970 |
Top Mid Cap Stocks That Created a New All Time High Today
Companies with Market Capital between 5,000 Crores to 20,000 Crores| Stock | Close | New All-Time High (ATH) | Previous ATH | Previous ATH Date |
|---|---|---|---|---|
| CMS Info Systems | 538.00 (+3.18%) | 547.70 (+%) | Thu 01 Jan 1970 | |
| Dodla Dairy | 1245.30 (+7.28%) | 1346.09 (+%) | Thu 01 Jan 1970 | |
| India Cements | 352.54 (+1.58%) | 358.50 (+%) | Thu 01 Jan 1970 | |
| National Fertilizers | 159.71 (+9.94%) | 165.33 (+%) | Thu 01 Jan 1970 | |
| Power Mech Projects | 6110.10 (+1.03%) | 6189.95 (+%) | Thu 01 Jan 1970 |
Top Small Cap Stocks That Created a New All Time High Today
Companies with Market Capital less than 5,000 Crores| Stock | Close | New All-Time High (ATH) | Previous ATH | Previous ATH Date |
|---|---|---|---|---|
| Ace Software Exports | 321.20 (+1.98%) | 321.20 (+113.73%) | 150.28 | Mon 01 Apr 2024 |
| Ahmedabad Steelcraft | 138.60 (+1.98%) | 138.60 (+%) | Thu 01 Jan 1970 | |
| Almondz Global Securities | 172.64 (+2.74%) | 175.60 (+%) | Thu 01 Jan 1970 | |
| Antony Waste Handling | 668.75 (+13.49%) | 699.00 (+%) | Thu 01 Jan 1970 | |
| Bits | 5.61 (+2%) | 5.61 (+%) | Thu 01 Jan 1970 |