Home / Tue 16 Jul 2024 Market Recap
16 Jul 2024: Nifty Closed at ₹24,601.09 (+0.05%), HDFC Life has been on a 10-day green streak, Coal India rose +3.01%, While Axis Bank & Chalet Hotels Dip
Show Table of Contents
Table of Contents
- 1: Top Indices Performance Overview
- 2: Nifty 50 Performance Overview
- 2.1: Nifty 50 Top Gainers
- 2.2: Nifty 50 Top Losers
- 2.3: Nifty 50 Stocks To Watch for Tomorrow
- 2.3.1: HDFC Life (Bullish Pattern)
- 2.3.2: ➲ Axis Bank (Bearish Trend)
- 3: Nifty 500 Performance Overview
- 3.1: Nifty 500 Top Gainers
- 3.2: Nifty 500 Top Losers
- 3.3: Nifty 51 to 500 Stocks To Watch for Tomorrow
- 3.3.1: ➲ Lux Industries (Bullish Pattern)
- 3.3.2: ➲ Chalet Hotels (Bearish Pattern)
- 4: Top Stocks That Created a New All Time High Today
- 4.1: Top Large Cap Stocks That Created a New All Time High Today
- 4.2: Top Mid Cap Stocks That Created a New All Time High Today
- 4.3: Top Small Cap Stocks That Created a New All Time High Today
Top Indices Performance Overview
| Stock | Close | Range |
|---|---|---|
| NIFTY 50 | ₹24,601.09 (0.05%) | ₹24,588.3 – ₹24,661.05 |
| NIFTY BANK | ₹52,399.94 (-0.11%) | ₹52,333.1 – ₹52,617.89 |
| NIFTY FIN SERVICE | ₹23,650.94 (-0.18%) | ₹23,628.9 – ₹23,759.9 |
| NIFTY IT | ₹39,110.05 (0.51%) | ₹38,731.5 – ₹39280 |
| NIFTY AUTO | ₹25,466.44 (0.18%) | ₹25,430.94 – ₹25,586.65 |
| NIFTY ENERGY | ₹43,181.44 (-0.29%) | ₹43,146.89 – ₹43,655.44 |
Nifty 50 Performance Overview
The Nifty 50 started the day at ₹24,618.94. It traded within a range of ₹24,588.3 (low) to ₹24,661.05 (high) before finishing the session at ₹24,601.09, a slight gain of +0.05%.
This movement was influenced by a mix of top gainers and losers which are detailed in the table below.
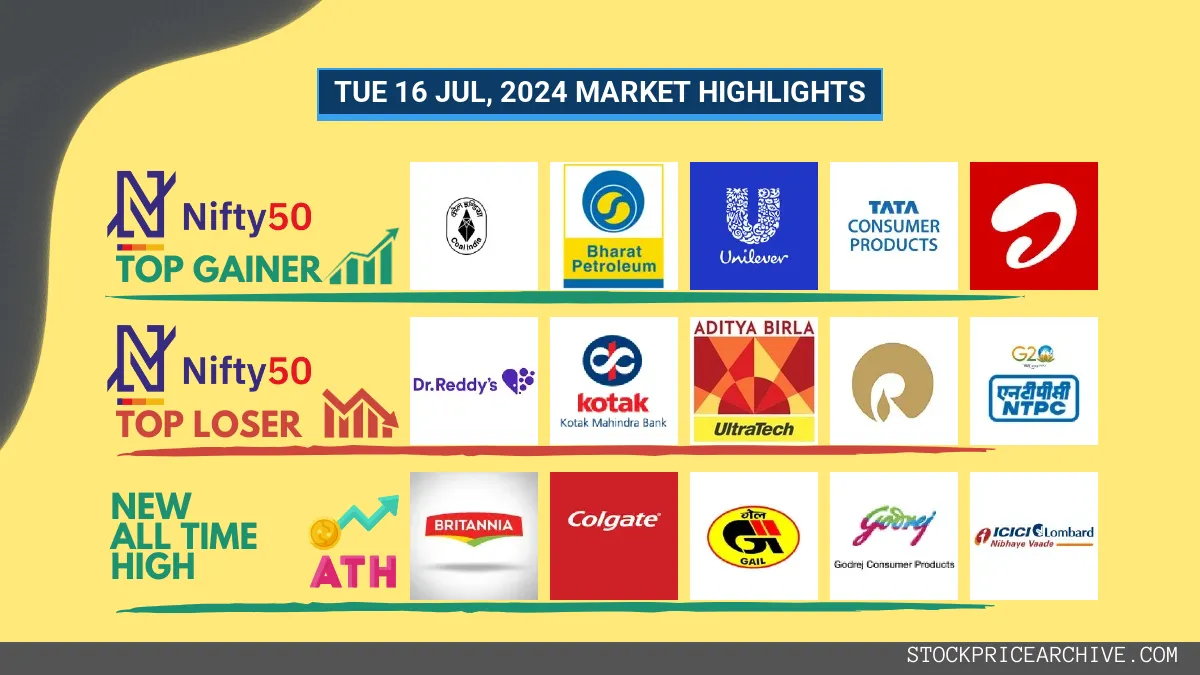
Nifty 50 Top Gainers
| Stock | Close | Range |
|---|---|---|
| Coal India | ₹512.75 (3.01%) | ₹499.14 – ₹518.34 |
| Bharat Petroleum | ₹316 (2.68%) | ₹308.04 – ₹319.2 |
| Hindustan Unilever | ₹2,684.19 (2.43%) | ₹2,630.55 – ₹2725 |
| Tata Consumer Products | ₹1174 (2.19%) | ₹1,145.69 – ₹1179 |
| Bharti Airtel | ₹1,464.69 (1.88%) | ₹1447 – ₹1,472.94 |
Nifty 50 Top Losers
| Stock | Close | Range |
|---|---|---|
| Dr Reddy Lab | ₹6,646.04 (-2.19%) | ₹6,637.7 – ₹6,773.5 |
| Kotak Mahindra Bank | ₹1,805.4 (-2.07%) | ₹1,801.3 – ₹1,849.09 |
| UltraTech Cement | ₹11,658.7 (-1.48%) | ₹11640 – ₹11,896.2 |
| Reliance Industries | ₹3149 (-1.43%) | ₹3,138.94 – ₹3,199.19 |
| NTPC | ₹380.25 (-1.4%) | ₹380.04 – ₹388.64 |
Nifty 50 Stocks To Watch for Tomorrow
HDFC Life (Bullish Pattern)
- Performance Overview: In the last 26 trading sessions (from June 21st to July 16th, 2024), HDFC Life’s share price has closed higher 20 times and lower 6 times, indicating a positive trend.
- Recent Trend: HDFC Life has been on a 10-day green streak, steadily climbing since July 2nd, 2024, without a single day closing in the red.
- Returns: Over the past 26 trading sessions, HDFC Life has delivered impressive returns of 14.82%. This means an investment of ₹10,000 would have grown to ₹11,482.
- Financial Insight: Looking at the bigger picture, HDFC Life has generated a strong revenue of ₹1,01,959.97 Crore over the past 12 months, and its profitability is evident with a profit of ₹1,574.08 Crore during the same period.
- As of July 16th, 2024, HDFC Life boasts a substantial Market Capital of ₹1,36,391.64 Crore.
- Summary: HDFC Life is currently exhibiting a robust bullish pattern, suggesting strong growth potential. If you’re interested in exploring potential price targets, check out HDFC Life Target for Tomorrow and HDFC Life Targets for 2024 & 2025 to gain insights into both short-term and long-term growth prospects.
HDFC Life Financial Performance
| Metric | Value | Description |
|---|---|---|
| Market Capital | 1,36,391.64 Crore | Market valuation of HDFC Life’s shares. |
| Revenue (TTM) | 1,01,959.97 Crore | Total revenue generated by HDFC Life over the past twelve months. |
| Net Income (TTM) | +1,574.08 Crore | Net Profit or Loss after all the expenses over the past twelve months. |
| Operating Margin | 1.84% | Income from operations as a percentage of revenue, before taxes and interest. |
| Profit Margin | 1.54% | Net income as a percentage of revenue, after all expenses. |
| Revenue Growth (Quarterly) | +32.6% | Change in revenue compared to the previous quarter. |
| Earnings Growth (YOY Quarterly) | +13.7% | Change in earnings compared to the same quarter last year. |
| Debt-to-Equity (D/E) Ratio | 6.47 | Company’s total debt divided by total shareholder equity. |
| Total Debt | 950 Crore | Sum of HDFC Life’s current & long-term financial obligations. |
| Total Cash | 1,903.88 Crore | Total amount of liquid funds available to HDFC Life. |
| Beta | 0.83 | Beta is less than 1 indicating that the HDFC Life’s price is less volatile than the market. |
➲ Axis Bank (Bearish Trend)
- Performance Overview: In the last 26 trading days, Axis Bank has closed lower than the previous day 10 times and higher 16 times. That means it’s had more good days than bad days, recently.
- Recent Trend: Axis Bank has closed lower for the past two days, ending the trading day in red on both Friday, July 12th, 2024 and Monday, July 15th, 2024.
- Returns: Axis Bank has delivered a 10.04% return over the past 26 trading days. If you had invested ₹10,000, you would have earned about ₹1,004.
- Financial Insight: During the past 12 months, Axis Bank has generated a revenue of ₹63,399.29 Crore and achieved a profit of ₹26,386.19 Crore.
- As of Tuesday, July 16th, 2024, Axis Bank has a Market Capitalization of ₹4,00,903.21 Crore.
- Summary: Axis Bank is currently showing signs of a bearish pattern. We advise investors to keep a close eye on the stock’s movement. You can check out our predictions for Axis Bank’s Target for Tomorrow and Axis Bank’s Targets for 2024 & 2025 for more insight.
Axis Bank Financial Performance
| Metric | Value | Description |
|---|---|---|
| Market Capital | 4,00,903.21 Crore | Market valuation of Axis Bank’s shares. |
| Revenue (TTM) | 63,399.29 Crore | Total revenue generated by Axis Bank over the past twelve months. |
| Net Income (TTM) | +26,386.19 Crore | Net Profit or Loss after all the expenses over the past twelve months. |
| Operating Margin | 8.86% | Income from operations as a percentage of revenue, before taxes and interest. |
| Profit Margin | 41.61% | Net income as a percentage of revenue, after all expenses. |
| Revenue Growth (Quarterly) | +27% | Change in revenue compared to the previous quarter. |
| Earnings Growth (YOY Quarterly) | +20.31% | Change in earnings compared to the same quarter last year. |
| Debt-to-Equity (D/E) Ratio | 1.44 | Company’s total debt divided by total shareholder equity. |
| Total Debt | 2,28,199.55 Crore | Sum of Axis Bank’s current & long-term financial obligations. |
| Total Cash | 61,607.6 Crore | Total amount of liquid funds available to Axis Bank. |
| Beta | 0.94 | Beta is less than 1 indicating that the Axis Bank’s price is less volatile than the market. |
Nifty 500 Performance Overview
The Nifty 500 opened the day at ₹23,256.84, displaying a bit of a roller coaster ride throughout the session. It dipped to a low of ₹23,181.69 before reaching a high of ₹23,288. In the end, it settled at ₹23,197.15, closing down 0.06% for the day.
The movement of the Nifty 500 was influenced by the top gainers and losers, which you can see in the table below.
Nifty 500 Top Gainers
| Stock | Close | Range |
|---|---|---|
| Alembic Pharma | ₹1080 (9.99%) | ₹990.95 – ₹1119 |
| NATCO Pharma | ₹1279 (5.86%) | ₹1,208.5 – ₹1,304.65 |
| Tata Teleservices | ₹81.4 (5.59%) | ₹77.81 – ₹83.62 |
| Century Textile | ₹2210 (5.16%) | ₹2117 – ₹2,265.25 |
| India Cements | ₹323.14 (5.12%) | ₹308.7 – ₹324.6 |
Nifty 500 Top Losers
| Stock | Close | Range |
|---|---|---|
| Godfrey Phillips | ₹4,423.95 (-6.56%) | ₹4420 – ₹4,720.29 |
| Zomato | ₹217.49 (-5.09%) | ₹215.39 – ₹230.3 |
| IDBI Bank | ₹87.89 (-3.93%) | ₹87.57 – ₹91.17 |
| Ircon International | ₹324.39 (-3.3%) | ₹322.1 – ₹335.45 |
| HAL | ₹5324 (-3.29%) | ₹5,314.89 – ₹5501 |
Nifty 51 to 500 Stocks To Watch for Tomorrow
➲ Lux Industries (Bullish Pattern)
- Performance Overview: In the last 26 trading sessions, Lux Industries has closed higher than the previous day 16 times and lower 10 times.
- Recent Trend: Lux Industries has been on a 8-day winning streak, closing higher each day since Thursday, July 4th, 2024.
- Returns: Over the past 26 trading sessions, Lux Industries has delivered a 34.52% return. This means that an investment of ₹10,000 would have grown to ₹13,452.
- Financial Insight: Over the past 12 months, Lux Industries has generated revenue of ₹2,324.28 Crore and a profit of ₹129.52 Crore.
- As of Tuesday, July 16th, 2024, Lux Industries has a Market Capital of ₹5,501.46 Crore.
- Summary: Lux Industries is showing strong bullish signals. Investors interested in this company should keep a close eye on its price movements to identify both short-term and long-term opportunities: Checkout Lux Industries Target for Tomorrow and Lux Industries Targets for 2024 & 2025.
Lux Industries Financial Performance
| Metric | Value | Description |
|---|---|---|
| Market Capital | 5,501.46 Crore | Market valuation of Lux Industries’s shares. |
| Revenue (TTM) | 2,324.28 Crore | Total revenue generated by Lux Industries over the past twelve months. |
| Net Income (TTM) | +129.52 Crore | Net Profit or Loss after all the expenses over the past twelve months. |
| Operating Margin | 10.16% | Income from operations as a percentage of revenue, before taxes and interest. |
| Profit Margin | 5.57% | Net income as a percentage of revenue, after all expenses. |
| Revenue Growth (Quarterly) | -1.1% | Change in revenue compared to the previous quarter. |
| Earnings Growth (YOY Quarterly) | +78% | Change in earnings compared to the same quarter last year. |
| Debt-to-Equity (D/E) Ratio | 13.58 | Company’s total debt divided by total shareholder equity. |
| Total Debt | 210.88 Crore | Sum of Lux Industries’s current & long-term financial obligations. |
| Total Cash | 258.67 Crore | Total amount of liquid funds available to Lux Industries. |
| Beta | 0.58 | Beta is less than 1 indicating that the Lux Industries’s price is less volatile than the market. |
➲ Chalet Hotels (Bearish Pattern)
- Performance Overview: Over the last 26 trading sessions, Chalet Hotels has ended the day lower than it started 17 times and higher 9 times. This tells us that the stock has been trending downwards recently.
- Recent Trend: Chalet Hotels has been on a 9-day red streak, without a single day closing in green since Wednesday, July 3rd, 2024. This sustained downward movement is a cause for concern for investors.
- Returns: Chalet Hotels delivered a -6.18% return in the last 26 trading sessions, which means an investment of ₹10,000 would have become ₹9,382 during that period.
- Financial Insight: Over the past 12 months, Chalet Hotels has generated a revenue of ₹1,417.25 Crore and created a profit of ₹278.16 Crore. These figures provide a glimpse into the company’s financial performance.
- As of Tuesday, July 16th, 2024, Chalet Hotels has a Market Capital of ₹18,298.23 Crore. This figure represents the total value of all outstanding shares of the company.
- Summary: Chalet Hotels is currently facing a challenging period, showing a bearish pattern. It’s important for investors to monitor the stock closely. We encourage you to check out Chalet Hotels Target for Tomorrow and Chalet Hotels Targets for 2024 & 2025 for insights into potential future price movements.
Chalet Hotels Financial Performance
| Metric | Value | Description |
|---|---|---|
| Market Capital | 18,298.23 Crore | Market valuation of Chalet Hotels’s shares. |
| Revenue (TTM) | 1,417.25 Crore | Total revenue generated by Chalet Hotels over the past twelve months. |
| Net Income (TTM) | +278.16 Crore | Net Profit or Loss after all the expenses over the past twelve months. |
| Operating Margin | 34.84% | Income from operations as a percentage of revenue, before taxes and interest. |
| Profit Margin | 19.62% | Net income as a percentage of revenue, after all expenses. |
| Revenue Growth (Quarterly) | +22.5% | Change in revenue compared to the previous quarter. |
| Earnings Growth (YOY Quarterly) | +124.5% | Change in earnings compared to the same quarter last year. |
| Debt-to-Equity (D/E) Ratio | 162.36 | Company’s total debt divided by total shareholder equity. |
| Total Debt | 3,005.18 Crore | Sum of Chalet Hotels’s current & long-term financial obligations. |
| Total Cash | 133.1 Crore | Total amount of liquid funds available to Chalet Hotels. |
| Beta | 0.35 | Beta is less than 1 indicating that the Chalet Hotels’s price is less volatile than the market. |
Top Stocks That Created a New All Time High Today
Top Large Cap Stocks That Created a New All Time High Today
Companies with Market Capital more than 20,000 Crores| Stock | Close | New All-Time High (ATH) | Previous ATH | Previous ATH Date |
|---|---|---|---|---|
| Britannia | 5863.89 (+0.93%) | 5879.79 (+%) | Thu 01 Jan 1970 | |
| Castrol | 269.73 (+0.9%) | 277.51 (+%) | Thu 01 Jan 1970 | |
| Colgate Palmolive | 3123.00 (+0.82%) | 3155.00 (+12.08%) | 2814.89 | Wed 03 Apr 2024 |
| GAIL | 233.30 (-1.63%) | 239.07 (+13.78%) | 210.10 | Tue 16 Apr 2024 |
| Glenmark Pharma | 1411.40 (+0.23%) | 1426.94 (+%) | Thu 01 Jan 1970 |
Top Mid Cap Stocks That Created a New All Time High Today
Companies with Market Capital between 5,000 Crores to 20,000 Crores| Stock | Close | New All-Time High (ATH) | Previous ATH | Previous ATH Date |
|---|---|---|---|---|
| Chennai Petroleum | 1215.00 (+12.01%) | 1275.00 (+23.03%) | 1036.30 | Mon 19 Feb 2024 |
| Dodla Dairy | 1221.94 (+6.57%) | 1227.84 (+%) | Thu 01 Jan 1970 | |
| HBL Power Systems | 644.00 (+2.32%) | 684.50 (+%) | Thu 01 Jan 1970 | |
| H.G. Infra Engineering | 1780.44 (+3.68%) | 1871.75 (+66.53%) | 1123.94 | Mon 08 Apr 2024 |
| Max Estates | 534.40 (+3.06%) | 553.70 (+%) | Thu 01 Jan 1970 |
Top Small Cap Stocks That Created a New All Time High Today
Companies with Market Capital less than 5,000 Crores| Stock | Close | New All-Time High (ATH) | Previous ATH | Previous ATH Date |
|---|---|---|---|---|
| Ace Software Exports | 302.75 (+1.98%) | 302.75 (+101.45%) | 150.28 | Mon 01 Apr 2024 |
| Advait Infratech | 2154.64 (+4.99%) | 2154.64 (+29.59%) | 1662.60 | Mon 01 Apr 2024 |
| Abans Holdings | 535.00 (-3.38%) | 561.00 (+28.78%) | 435.60 | Wed 10 Apr 2024 |
| Ahmedabad Steelcraft | 130.64 (+1.99%) | 130.64 (+%) | Thu 01 Jan 1970 | |
| Ashish Polyplast | 91.66 (+1.99%) | 91.66 (+%) | Thu 01 Jan 1970 |