Home / Thu 30 May 2024 Market Recap
30 May 2024: Nifty closed at ₹22,554 (-0.67%), Bharti Airtel Shows Bullish Signs while ONGC Experiences Bearish Trend.
Show Table of Contents
Table of Contents
- 1: Top Indices Performance Overview
- 2: Nifty 50 Performance Overview
- 2.1: Nifty 50 Top Gainers
- 2.2: Nifty 50 Top Losers
- 2.3: Nifty 50 Stocks To Watch for Tomorrow
- 2.3.1: ➲ Bharti Airtel
- 2.3.2: ➲ ONGC (Bearish Pattern)
- 3: Nifty 500 Performance Overview
- 3.1: Nifty 500 Top Gainers
- 3.2: Nifty 500 Top Losers
- 3.3: Nifty 51 to 500 Stocks To Watch for Tomorrow
- 3.3.1: ➲ Brightcom Group (Bullish Pattern)
- 3.3.2: ➲ Prince Pipes and Fittings (Bearish Pattern)
- 4: Top Stocks That Created a New All Time High Today
- 4.1: Top Large Cap Stocks That Created a New All Time High Today
- 4.2: Top Mid Cap Stocks That Created a New All Time High Today
- 4.3: Top Small Cap Stocks That Created a New All Time High Today
Top Indices Performance Overview
| Stock | Close | Range |
|---|---|---|
| NIFTY 50 | ₹22554 (-0.67%) | ₹22,418.94 – ₹22704 |
| NIFTY BANK | ₹48,822.85 (0.66%) | ₹48,335.35 – ₹49,042.94 |
| NIFTY FIN SERVICE | ₹21,656.44 (0.16%) | ₹21,530.9 – ₹21,739.8 |
| NIFTY IT | ₹32,820.55 (-2.16%) | ₹32,685.34 – ₹33,432.25 |
| NIFTY AUTO | ₹23,495.3 (-1.11%) | ₹23,392.59 – ₹23,766.3 |
| NIFTY ENERGY | ₹40,130.55 (-1.09%) | ₹39,804.44 – ₹40,556.14 |
Nifty 50 Performance Overview
The Nifty 50 commenced the day at ₹22,637.44. During the trading session, it fluctuated between a low of ₹22,418.94 and a high of ₹22,704 before ultimately closing at ₹22,554 (-0.67%).
The following table displays the top gainers and losers that contributed to the Nifty 50’s movement today.
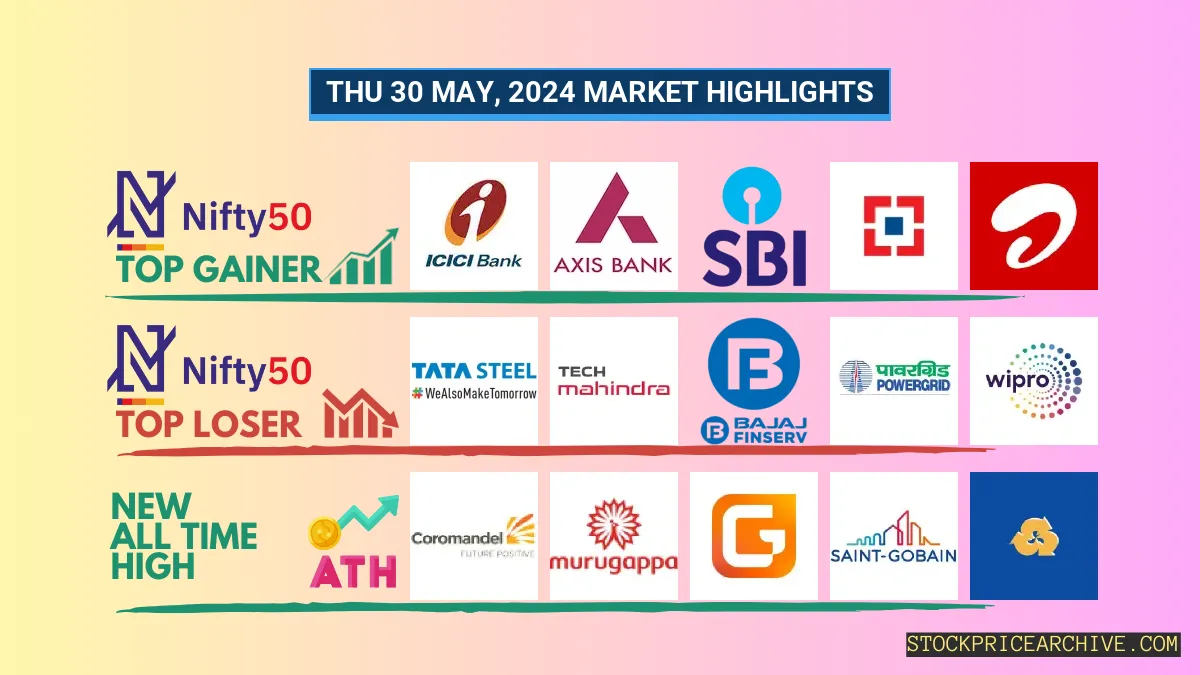
Nifty 50 Top Gainers
| Stock | Close | Range |
|---|---|---|
| ICICI BANK | ₹1,116.75 (1.33%) | ₹1,102.25 – ₹1,120.94 |
| Axis Bank | ₹1,170.5 (0.92%) | ₹1,157.75 – ₹1,179.75 |
| SBI | ₹828.09 (0.66%) | ₹822.29 – ₹836 |
| HDFC BANK | ₹1,516.69 (0.55%) | ₹1,499.5 – ₹1,523.5 |
| Bharti Airtel | ₹1,381.55 (0.32%) | ₹1,363.5 – ₹1,386.44 |
Nifty 50 Top Losers
| Stock | Close | Range |
|---|---|---|
| Tata Steel | ₹165.2 (-5.2%) | ₹163.35 – ₹170.95 |
| Tech Mahindra | ₹1,245.8 (-3.16%) | ₹1,235.44 – ₹1,287.75 |
| Bajaj Finserv | ₹1,524.4 (-2.9%) | ₹1517 – ₹1,574.9 |
| Power Grid | ₹308.95 (-2.76%) | ₹303.85 – ₹316.95 |
| WIPRO | ₹438.45 (-2.74%) | ₹435.1 – ₹448.7 |
Nifty 50 Stocks To Watch for Tomorrow
➲ Bharti Airtel
- Performance Summary: In the last 26 trading sessions (as of Thu 30 May 2024) Bharti Airtel has closed in green 12 times and in red 13 times.
- Recent Pattern: Bharti Airtel has been on a 2-day green streak, showing positive momentum since Tue 28 May 2024.
- Returns: Over the last 26 trading sessions, Bharti Airtel has delivered a respectable return of 2.22%. An initial investment of ₹10,000 could potentially have grown to ₹10,222.
- Financial Performance: Bharti Airtel has demonstrated strong financial performance in the past 12 months, with a remarkable revenue of ₹1,49,982.39 Crore and a commendable profit of ₹7,466.99 Crore.
- As of Thu 30 May 2024, Bharti Airtel boasts a Market Capitalization of ₹8,26,040.85 Crore, reflecting its significant presence in the market.
- Expert Insight: Bharti Airtel showcases a promising bullish pattern, hinting at potential growth opportunities. Consider exploring the stock’s Short-Term Target for tomorrow and Long-Term Targets for 2024 and 2025 to make informed investment decisions.
Bharti Airtel Financial Performance
| Metric | Value | Description |
|---|---|---|
| Market Capital | 8,26,040.85 Crore | Market valuation of Bharti Airtel’s shares. |
| Revenue (TTM) | 1,49,982.39 Crore | Total revenue generated by Bharti Airtel over the past twelve months. |
| Net Income (TTM) | +7,466.99 Crore | Net Profit or Loss after all the expenses over the past twelve months. |
| Operating Margin | 24.7% | Income from operations as a percentage of revenue, before taxes and interest. |
| Profit Margin | 4.97% | Net income as a percentage of revenue, after all expenses. |
| Revenue Growth (Quarterly) | +4.39% | Change in revenue compared to the previous quarter. |
| Earnings Growth (YOY Quarterly) | -31.1% | Change in earnings compared to the same quarter last year. |
| Debt-to-Equity (D/E) Ratio | 204.22 | Company’s total debt divided by total shareholder equity. |
| Total Debt | 2,15,592.29 Crore | Sum of Bharti Airtel’s current & long-term financial obligations. |
| Total Cash | 16,609.39 Crore | Total amount of liquid funds available to Bharti Airtel. |
| Beta | 0.2 | Beta is less than 1 indicating that the Bharti Airtel’s price is less volatile than the market. |
➲ ONGC (Bearish Pattern)
- Performance Overview: Over the past 26 trading sessions, ONGC has closed in the red 14 times and in the green 12 times.
- Recent Trend: ONGC has been on a 5-day red streak, without a single day closing in green since Thursday, May 23, 2024.
- Returns: ONGC gave a negative 3.7% return in the last 26 trading sessions, meaning an investment of ₹10,000 would have become ₹9,630.
- Financial Insight: Over the past 12 months, Bharti Airtel has generated a revenue of ₹6,43,037.02 Crore and earned a profit of ₹49,221.37 Crore.
- As of Thursday, May 30, 2024, Bharti Airtel has a Market Capital of ₹3,56,336.97 Crore.
- Summary: ONGC is currently experiencing a bearish phase. We advise investors to keep a close watch, especially on ONGC Target for Tomorrow and ONGC Targets for 2024 & 2025.
ONGC Financial Performance
| Metric | Value | Description |
|---|---|---|
| Market Capital | 3,56,336.97 Crore | Market valuation of ONGC’s shares. |
| Revenue (TTM) | 6,43,037.02 Crore | Total revenue generated by ONGC over the past twelve months. |
| Net Income (TTM) | +49,221.37 Crore | Net Profit or Loss after all the expenses over the past twelve months. |
| Operating Margin | 9.21% | Income from operations as a percentage of revenue, before taxes and interest. |
| Profit Margin | 7.65% | Net income as a percentage of revenue, after all expenses. |
| Revenue Growth (Quarterly) | +49.5% | Change in revenue compared to the previous quarter. |
| Earnings Growth (YOY Quarterly) | +172% | Change in earnings compared to the same quarter last year. |
| Debt-to-Equity (D/E) Ratio | 41.95 | Company’s total debt divided by total shareholder equity. |
| Total Debt | 1,53,180.53 Crore | Sum of ONGC’s current & long-term financial obligations. |
| Total Cash | 42,069.84 Crore | Total amount of liquid funds available to ONGC. |
| Beta | 0.7 | Beta is less than 1 indicating that the ONGC’s price is less volatile than the market. |
Nifty 500 Performance Overview
The Nifty 500 opened the day at ₹21,207.5. Throughout the session, it experienced fluctuations, hitting a low of ₹21,012.84 and reaching a high of ₹21,262.69, before finally settling at a close of ₹21,017.34 (-1.13%).
Several stocks influenced the Nifty 500’s movement today. Some notable gainers and losers include:
Nifty 500 Top Gainers
| Stock | Close | Range |
|---|---|---|
| Emami | ₹616 (17.59%) | ₹529 – ₹619 |
| RHI MAGNESITA | ₹735 (10.38%) | ₹666.95 – ₹755 |
| KNR Constructions | ₹303 (8.23%) | ₹290.14 – ₹309.7 |
| Linde India | ₹9085 (7.95%) | ₹8,413.5 – ₹9240 |
| Suprajit Engineering | ₹439.85 (6.75%) | ₹416.29 – ₹456.14 |
Nifty 500 Top Losers
| Stock | Close | Range |
|---|---|---|
| IRB Infrastructure Developers | ₹65.5 (-9.91%) | ₹64.25 – ₹67.59 |
| Kfin Technologies | ₹676.95 (-9%) | ₹674 – ₹720.15 |
| GMR Airports | ₹81.05 (-6.84%) | ₹80.34 – ₹88 |
| Hindustan Zinc | ₹665.25 (-6.54%) | ₹660 – ₹714.65 |
| Alkem Labs | ₹4,940.04 (-6.13%) | ₹4895 – ₹5,134.7 |
Nifty 51 to 500 Stocks To Watch for Tomorrow
➲ Brightcom Group (Bullish Pattern)
- Performance Overview: In the last 26 trading sessions, Brightcom Group has witnessed a bullish trend, closing in green 7 times and in red 16 times.
- Recent Trend: Brightcom Group has been on a remarkable 5-day green streak, with no single-day closing in red since Thursday, May 23, 2024.
- Returns: Investors in Brightcom Group have experienced a moderate loss of -23.26% over the last 26 trading sessions. This means that an initial investment of ₹10,000 would have dwindled to ₹7,674.
- Financial Insight: Over the past 12 months, Brightcom Group has demonstrated strong financial performance, generating a revenue of ₹7,606.48 Crore and realizing a profit of ₹1,415.23 Crore.
- As of Thursday, May 30, 2024, Brightcom Group boasts a healthy Market Capital of ₹1,927.68 Crore.
- Outlook: Brightcom Group’s current price action suggests a bullish pattern, indicating potential for both short-term and long-term growth. Investors are encouraged to monitor the stock’s price movements and consider its targets for both short-term and long-term investment strategies. For more insights, explore Brightcom Group Target for Tomorrow and Brightcom Group Targets for 2024 & 2025.
Brightcom Group Financial Performance
| Metric | Value | Description |
|---|---|---|
| Market Capital | 1,927.68 Crore | Market valuation of Brightcom Group’s shares. |
| Revenue (TTM) | 7,606.48 Crore | Total revenue generated by Brightcom Group over the past twelve months. |
| Net Income (TTM) | +1,415.23 Crore | Net Profit or Loss after all the expenses over the past twelve months. |
| Operating Margin | 26.37% | Income from operations as a percentage of revenue, before taxes and interest. |
| Profit Margin | 18.6% | Net income as a percentage of revenue, after all expenses. |
| Revenue Growth (Quarterly) | +14.2% | Change in revenue compared to the previous quarter. |
| Earnings Growth (YOY Quarterly) | +16% | Change in earnings compared to the same quarter last year. |
| Total Cash | 1,411.72 Crore | Total amount of liquid funds available to Brightcom Group. |
| Beta | 0.95 | Beta is less than 1 indicating that the Brightcom Group’s price is less volatile than the market. |
➲ Prince Pipes and Fittings (Bearish Pattern)
- Performance Overview: Over the past 26 trading sessions, Prince Pipes and Fittings has closed in the red 15 times and in the green 11 times.
- Recent Trend: Prince Pipes and Fittings has been on a 9-day red streak, without a single day closing in the green since Friday, May 17, 2024.
- Returns: In the last 26 trading sessions, Prince Pipes and Fittings gave a -2.8% return. This means that an investment of ₹10,000 would have become ₹9,720.
- Financial Insight: Over the past 12 months, Prince Pipes and Fittings has generated revenue of ₹2,593.02 Crore and created a profit of ₹221.96 Crore.
- As of Thursday, May 30, 2024, Prince Pipes and Fittings has a Market Capital of ₹6,972.52 Crore.
- Summary: Prince Pipes and Fittings is currently experiencing a bearish phase. We advise investors to keep a close watch, especially on Prince Pipes and Fittings Target for Tomorrow and Prince Pipes and Fittings Targets for 2024 & 2025.
Prince Pipes and Fittings Financial Performance
| Metric | Value | Description |
|---|---|---|
| Market Capital | 6,972.52 Crore | Market valuation of Prince Pipes and Fittings’s shares. |
| Revenue (TTM) | 2,593.02 Crore | Total revenue generated by Prince Pipes and Fittings over the past twelve months. |
| Net Income (TTM) | +221.96 Crore | Net Profit or Loss after all the expenses over the past twelve months. |
| Operating Margin | 8.52% | Income from operations as a percentage of revenue, before taxes and interest. |
| Profit Margin | 8.55% | Net income as a percentage of revenue, after all expenses. |
| Revenue Growth (Quarterly) | -12.4% | Change in revenue compared to the previous quarter. |
| Earnings Growth (YOY Quarterly) | +6.3% | Change in earnings compared to the same quarter last year. |
| Debt-to-Equity (D/E) Ratio | 4.07 | Company’s total debt divided by total shareholder equity. |
| Total Debt | 58.96 Crore | Sum of Prince Pipes and Fittings’s current & long-term financial obligations. |
| Total Cash | 231.83 Crore | Total amount of liquid funds available to Prince Pipes and Fittings. |
| Beta | 0.92 | Beta is less than 1 indicating that the Prince Pipes and Fittings’s price is less volatile than the market. |
Top Stocks That Created a New All Time High Today
Top Large Cap Stocks That Created a New All Time High Today
Companies with Market Capital more than 20,000 Crores| Stock | Close | New All-Time High (ATH) | Previous ATH | Previous ATH Date |
|---|---|---|---|---|
| CEBBCO | 569.84 (+0.53%) | 593.50 (+36.81%) | 433.80 | Mon 01 Jan 2024 |
| Coromandel International | 1300.05 (+0.94%) | 1305.00 (+%) | Thu 01 Jan 1970 | |
| Glaxosmithkline | 2595.00 (+2.4%) | 2603.25 (+%) | Thu 01 Jan 1970 | |
| Grindwell Norton | 2511.69 (-3.05%) | 2775.00 (+%) | Thu 01 Jan 1970 | |
| Indian Bank | 578.00 (+0.29%) | 596.50 (+%) | Thu 01 Jan 1970 |
Top Mid Cap Stocks That Created a New All Time High Today
Companies with Market Capital between 5,000 Crores to 20,000 Crores| Stock | Close | New All-Time High (ATH) | Previous ATH | Previous ATH Date |
|---|---|---|---|---|
| E.I.D. Parry | 673.90 (-1.89%) | 703.75 (+%) | Thu 01 Jan 1970 | |
| Poly Medicure | 1782.44 (-2.81%) | 1876.94 (+%) | Thu 01 Jan 1970 | |
| TECHNOE | 1230.00 (+10.47%) | 1233.00 (+30.33%) | 946.00 | Fri 19 Apr 2024 |
| Titagarh Rail Systems | 1358.09 (-2.95%) | 1427.30 (+%) | Thu 01 Jan 1970 | |
| UCIL | 100.57 (+1.99%) | 100.57 (+%) | Thu 01 Jan 1970 |
Top Small Cap Stocks That Created a New All Time High Today
Companies with Market Capital less than 5,000 Crores| Stock | Close | New All-Time High (ATH) | Previous ATH | Previous ATH Date |
|---|---|---|---|---|
| Ace Software Exports | 205.00 (+1.99%) | 205.00 (+36.41%) | 150.28 | Mon 01 Apr 2024 |
| Ahmedabad Steelcraft | 69.56 (+1.99%) | 69.56 (+%) | Thu 01 Jan 1970 | |
| Allsec Technologies | 1041.25 (-5.2%) | 1115.00 (+%) | Thu 01 Jan 1970 | |
| Arnold Holdings Ltd. | 50.00 (+0.26%) | 52.36 (+%) | Thu 01 Jan 1970 | |
| Bacil Pharma | 25.51 (+4.97%) | 25.51 (+28.25%) | 19.89 | Wed 24 Apr 2024 |