Home / Mon 03 Jun 2024 Market Recap
03 Jun 2024: Nifty 50 Surges to ₹23,302.34 (+3.42%), Adani Ports ₹1591 (10.68%) & NTPC ₹393 (9.47%) Lead the Charge!
Show Table of Contents
Table of Contents
- 1: Top Indices Performance Overview
- 2: Nifty 50 Performance Overview
- 2.1: Nifty 50 Top Gainers
- 2.2: Nifty 50 Top Losers
- 2.3: Nifty 50 Stocks To Watch for Tomorrow
- 2.3.1: ➲ HDFC BANK (Bullish Pattern)
- 2.3.2: ➲ Eicher Motors (Bearish Pattern)
- 3: Nifty 500 Performance Overview
- 3.1: Nifty 500 Top Gainers
- 3.2: Nifty 500 Top Losers
- 3.3: Nifty 51 to 500 Stocks To Watch for Tomorrow
- 3.3.1: ➲ KNR Constructions (Bullish Pattern)
- 3.3.2: ➲ Alkyl Amines Chemicals (Bearish Pattern)
- 4: Top Stocks That Created a New All Time High Today
- 4.1: Top Large Cap Stocks That Created a New All Time High Today
- 4.2: Top Mid Cap Stocks That Created a New All Time High Today
- 4.3: Top Small Cap Stocks That Created a New All Time High Today
Top Indices Performance Overview
| Stock | Close | Range |
|---|---|---|
| NIFTY 50 | ₹23,302.34 (3.42%) | ₹23,063.65 – ₹23,323.19 |
| NIFTY BANK | ₹51,106.05 (4.33%) | ₹50,095.14 – ₹51,129.85 |
| NIFTY FIN SERVICE | ₹22,654.09 (4.3%) | ₹22,261.15 – ₹22658 |
| NIFTY IT | ₹32,562.09 (0.54%) | ₹32,456.05 – ₹33,126.6 |
| NIFTY AUTO | ₹24,026.9 (2.4%) | ₹23,875.09 – ₹24,159.69 |
| NIFTY ENERGY | ₹43,043.89 (6.92%) | ₹41,896.75 – ₹43,084.64 |
Nifty 50 Performance Overview
The Nifty 50 opened the day at ₹23,323.19 and experienced fluctuations throughout the session. It hit a low of ₹23,063.65 and reached a high of ₹23,323.19 before finally settling at a close of ₹23,302.34 (+3.42%).
Several stocks significantly influenced today’s Nifty 50 movement. Here are the top gainers and losers:
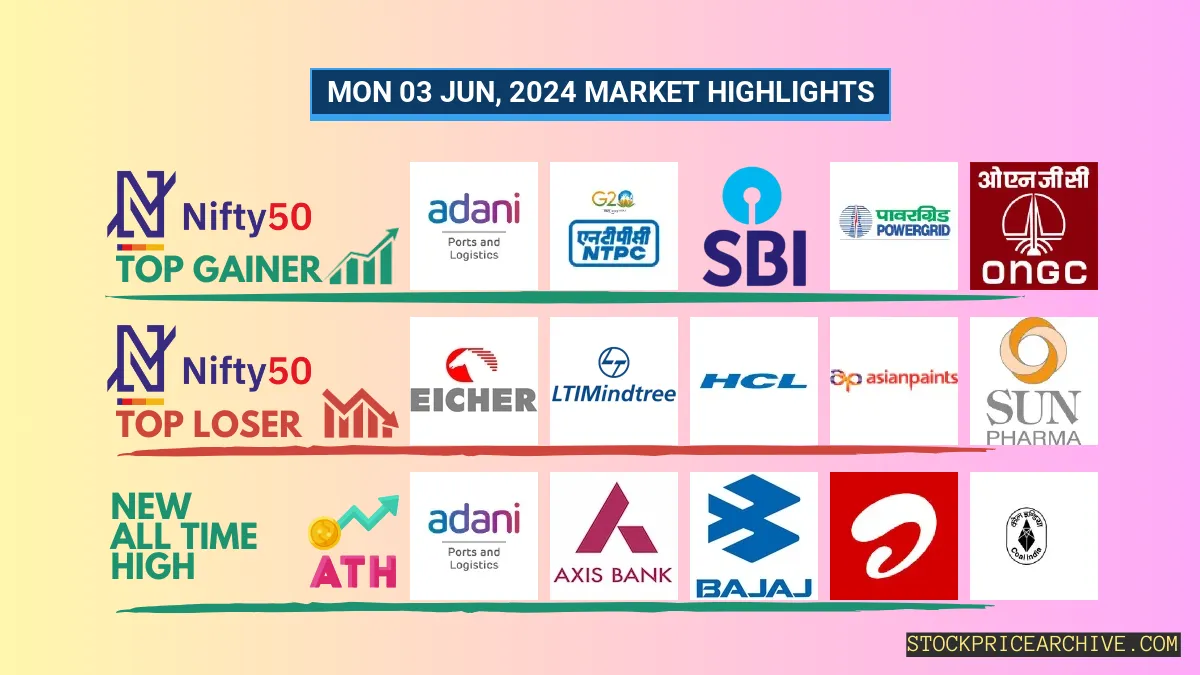
Nifty 50 Top Gainers
| Stock | Close | Range |
|---|---|---|
| Adani Ports | ₹1591 (10.68%) | ₹1,543.25 – ₹1,607.69 |
| NTPC | ₹393 (9.47%) | ₹374 – ₹393 |
| SBI | ₹909 (9.47%) | ₹856.75 – ₹912 |
| Power Grid | ₹337.79 (8.96%) | ₹327.04 – ₹346.25 |
| ONGC | ₹283.89 (7.39%) | ₹273.45 – ₹286.54 |
Nifty 50 Top Losers
| Stock | Close | Range |
|---|---|---|
| Eicher Motors | ₹4669 (-1.37%) | ₹4640 – ₹4,768.75 |
| LTIMindtree | ₹4,647.39 (-1.16%) | ₹4645 – ₹4,824.89 |
| HCL | ₹1,316.5 (-0.58%) | ₹1,310.25 – ₹1,350.55 |
| Asian Paints | ₹2,866.85 (-0.5%) | ₹2,860.05 – ₹2,944.85 |
| Sun Pharma | ₹1455 (-0.33%) | ₹1,451.05 – ₹1,495.4 |
Nifty 50 Stocks To Watch for Tomorrow
➲ HDFC BANK (Bullish Pattern)
- Performance Overview: In the past 25 trading sessions, HDFC BANK has closed in green 16 times and in red 9 times.
- Recent Trend: HDFC BANK has been on a 3-day green streak, without a single day closing in red since Wednesday, May 29, 2024.
- Returns: HDFC BANK has provided a return of 3.9% over the last 25 trading sessions, which means that an investment of ₹10,000 would have grown to ₹10,390.
- Financial Insight: Over the past 12 months, HDFC BANK has generated a revenue of ₹2,28,837.94 Crore and a profit of ₹64,062.04 Crore.
- As of Monday, June 03, 2024, HDFC BANK has a Market Capital of ₹11,64,613.62 Crore.
- Summary: HDFC BANK’s stock exhibits a robust bullish pattern. Investors should monitor its price movements for both short-term and long-term growth prospects. For more detailed insights, you can refer to our analysis of HDFC BANK’s Tomorrow’s Target and 2024 & 2025 Targets.
HDFC BANK Financial Performance
| Metric | Value | Description |
|---|---|---|
| Market Capital | 11,64,613.62 Crore | Market valuation of HDFC BANK’s shares. |
| Revenue (TTM) | 2,28,837.94 Crore | Total revenue generated by HDFC BANK over the past twelve months. |
| Net Income (TTM) | +64,062.04 Crore | Net Profit or Loss after all the expenses over the past twelve months. |
| Operating Margin | 26.55% | Income from operations as a percentage of revenue, before taxes and interest. |
| Profit Margin | 27.99% | Net income as a percentage of revenue, after all expenses. |
| Revenue Growth (Quarterly) | +113.19% | Change in revenue compared to the previous quarter. |
| Earnings Growth (YOY Quarterly) | +39.9% | Change in earnings compared to the same quarter last year. |
| Debt-to-Equity (D/E) Ratio | 1.62 | Company’s total debt divided by total shareholder equity. |
| Total Debt | 7,30,615.46 Crore | Sum of HDFC BANK’s current & long-term financial obligations. |
| Total Cash | 2,28,834.51 Crore | Total amount of liquid funds available to HDFC BANK. |
| Beta | 0.76 | Beta is less than 1 indicating that the HDFC BANK’s price is less volatile than the market. |
➲ Eicher Motors (Bearish Pattern)
- Performance Overview: Eicher Motors has closed lower in 15 of the last 25 trading sessions, with only 10 green days.
- Recent Trend: The stock has been in a 6-day losing streak, without a single positive close since Friday, May 24, 2024.
- Returns: Despite the recent losses, Eicher Motors has delivered a 1.74% return over the past 25 trading sessions. An investment of ₹10,000 would now be worth ₹10,174.
- Financial Insight: Over the past year, Eicher Motors has generated revenue of ₹16,535.77 Crore and a profit of ₹4,001.01 Crore.
- As of Monday, June 03, 2024, Eicher Motors has a Market Capitalization of ₹1,29,701.74 Crore.
- Outlook: Eicher Motors is currently experiencing a bearish phase. Investors are advised to monitor the situation closely, particularly the Eicher Motors Target for Tomorrow and Eicher Motors Targets for 2024 & 2025.
Eicher Motors Financial Performance
| Metric | Value | Description |
|---|---|---|
| Market Capital | 1,29,701.74 Crore | Market valuation of Eicher Motors’s shares. |
| Revenue (TTM) | 16,535.77 Crore | Total revenue generated by Eicher Motors over the past twelve months. |
| Net Income (TTM) | +4,001.01 Crore | Net Profit or Loss after all the expenses over the past twelve months. |
| Operating Margin | 22.63% | Income from operations as a percentage of revenue, before taxes and interest. |
| Profit Margin | 24.19% | Net income as a percentage of revenue, after all expenses. |
| Revenue Growth (Quarterly) | +15.4% | Change in revenue compared to the previous quarter. |
| Earnings Growth (YOY Quarterly) | +18.2% | Change in earnings compared to the same quarter last year. |
| Debt-to-Equity (D/E) Ratio | 2.32 | Company’s total debt divided by total shareholder equity. |
| Total Debt | 419.44 Crore | Sum of Eicher Motors’s current & long-term financial obligations. |
| Total Cash | 327.23 Crore | Total amount of liquid funds available to Eicher Motors. |
| Beta | 0.58 | Beta is less than 1 indicating that the Eicher Motors’s price is less volatile than the market. |
Nifty 500 Performance Overview
The Nifty 500 commenced the trading day at ₹21,926.34. Throughout the session, it experienced fluctuations, hitting a low of ₹21,629.94 and reaching a high of ₹21,926.34. Finally, it settled at a close of ₹21,825.65, marking a (+3.42%) gain.
Nifty 500 Top Gainers
| Stock | Close | Range |
|---|---|---|
| Adani Power | ₹878.2 (16.19%) | ₹829.2 – ₹895.84 |
| Power Finance Corporation | ₹558.54 (13.42%) | ₹520.5 – ₹559 |
| GAIL | ₹230.5 (12.82%) | ₹211.3 – ₹232.89 |
| REC | ₹605.45 (12.58%) | ₹569.75 – ₹607.7 |
| Central Bank | ₹72.3 (12%) | ₹65.84 – ₹73 |
Nifty 500 Top Losers
| Stock | Close | Range |
|---|---|---|
| Brightcom Group | ₹10.45 (-5.01%) | ₹10.45 – ₹11.35 |
| Glaxosmithkline | ₹2500 (-4.56%) | ₹2476 – ₹2,624.14 |
| Godfrey Phillips | ₹3,740.05 (-3.66%) | ₹3,720.25 – ₹3,869.69 |
| Fortis | ₹459 (-3.39%) | ₹457.64 – ₹488.95 |
| Bikaji Foods | ₹575 (-3.18%) | ₹574.2 – ₹620 |
Nifty 51 to 500 Stocks To Watch for Tomorrow
➲ KNR Constructions (Bullish Pattern)
- Performance Overview: In the last 25 trading sessions, KNR Constructions has closed in green 13 times and in red 12 times.
- Recent Trend: KNR Constructions has been on a 5-day green streak, without a single day closing in red since Mon 27 May 2024.
- Returns: KNR Constructions gave a 20.67% returns in the last 25 trading sessions, that means your investment of ₹10,000 would have become ₹12,067
- Financial Insight: Over the past 12 months, KNR Constructions has generated a revenue of ₹4,574.17 Crore and created a profit of ₹777.39 Crore.
- As of Mon 03 Jun 2024, KNR Constructions has a Market Capital of ₹8,948.88 Crore.
- Summary: KNR Constructions exhibits a robust bullish pattern. Investors should monitor its price movements targets for both short-term and long-term growth prospects: Checkout KNR Constructions Target for Tomorrow and KNR Constructions Targets for 2024 & 2025.
KNR Constructions Financial Performance
| Metric | Value | Description |
|---|---|---|
| Market Capital | 8,948.88 Crore | Market valuation of KNR Constructions’s shares. |
| Revenue (TTM) | 4,574.17 Crore | Total revenue generated by KNR Constructions over the past twelve months. |
| Net Income (TTM) | +777.39 Crore | Net Profit or Loss after all the expenses over the past twelve months. |
| Operating Margin | 29.83% | Income from operations as a percentage of revenue, before taxes and interest. |
| Profit Margin | 16.99% | Net income as a percentage of revenue, after all expenses. |
| Revenue Growth (Quarterly) | +23.6% | Change in revenue compared to the previous quarter. |
| Earnings Growth (YOY Quarterly) | +139.9% | Change in earnings compared to the same quarter last year. |
| Debt-to-Equity (D/E) Ratio | 36.09 | Company’s total debt divided by total shareholder equity. |
| Total Debt | 1,262.43 Crore | Sum of KNR Constructions’s current & long-term financial obligations. |
| Total Cash | 450.53 Crore | Total amount of liquid funds available to KNR Constructions. |
➲ Alkyl Amines Chemicals (Bearish Pattern)
- Performance Overview: In the last 24 trading sessions, Alkyl Amines Chemicals closed in red 18 times and in green 6 times.
- Recent Trend: Alkyl Amines Chemicals has been on a 10-day red streak, without a single day closing in green since Sat 18 May 2024.
- Returns: Alkyl Amines Chemicals gave a -10.06% returns in the last 24 trading sessions, that means your investment of ₹10,000 would have become ₹8,994
- Financial Insight: Over the past 12 months, KNR Constructions has generated a renvenue of ₹1,440.6 Crore and created a profit of ₹148.87 Crore.
- As of Mon 03 Jun 2024, KNR Constructions has a Market Capital of ₹9,689.55 Crore.
- Summary: Alkyl Amines Chemicals is currently experiencing a bearish phase. We advise investors to keep a close watch, especially on Alkyl Amines Chemicals Target for Tomorrow and Alkyl Amines Chemicals Targets for 2024 & 2025.
Alkyl Amines Chemicals Financial Performance
| Metric | Value | Description |
|---|---|---|
| Market Capital | 9,689.55 Crore | Market valuation of Alkyl Amines Chemicals’s shares. |
| Revenue (TTM) | 1,440.6 Crore | Total revenue generated by Alkyl Amines Chemicals over the past twelve months. |
| Net Income (TTM) | +148.87 Crore | Net Profit or Loss after all the expenses over the past twelve months. |
| Operating Margin | 14.42% | Income from operations as a percentage of revenue, before taxes and interest. |
| Profit Margin | 10.33% | Net income as a percentage of revenue, after all expenses. |
| Revenue Growth (Quarterly) | -13.3% | Change in revenue compared to the previous quarter. |
| Earnings Growth (YOY Quarterly) | -21% | Change in earnings compared to the same quarter last year. |
| Debt-to-Equity (D/E) Ratio | 0.25 | Company’s total debt divided by total shareholder equity. |
| Total Debt | 3.17 Crore | Sum of Alkyl Amines Chemicals’s current & long-term financial obligations. |
| Total Cash | 31.37 Crore | Total amount of liquid funds available to Alkyl Amines Chemicals. |
| Beta | 0.67 | Beta is less than 1 indicating that the Alkyl Amines Chemicals’s price is less volatile than the market. |
Top Stocks That Created a New All Time High Today
Top Large Cap Stocks That Created a New All Time High Today
Companies with Market Capital more than 20,000 Crores| Stock | Close | New All-Time High (ATH) | Previous ATH | Previous ATH Date |
|---|---|---|---|---|
| ABB India | 8703.29 (+4.63%) | 8765.00 (+29.89%) | 6747.89 | Mon 08 Apr 2024 |
| Adani Ports | 1591.00 (+10.68%) | 1607.69 (+%) | Thu 01 Jan 1970 | |
| Adani Power | 878.20 (+16.19%) | 895.84 (+38.49%) | 646.84 | Thu 04 Apr 2024 |
| Ambuja Cements | 671.95 (+5.97%) | 676.65 (+4.65%) | 646.54 | Wed 24 Apr 2024 |
| Ashok Leyland | 235.80 (+5.26%) | 237.89 (+%) | Thu 01 Jan 1970 |
Top Mid Cap Stocks That Created a New All Time High Today
Companies with Market Capital between 5,000 Crores to 20,000 Crores| Stock | Close | New All-Time High (ATH) | Previous ATH | Previous ATH Date |
|---|---|---|---|---|
| Arvind | 365.64 (-3.11%) | 390.54 (+17.35%) | 332.79 | Tue 23 Apr 2024 |
| Ashoka Buildcon | 195.00 (+6.35%) | 199.55 (+%) | Thu 01 Jan 1970 | |
| Astra Microwave Products | 869.00 (+0.37%) | 915.00 (+27.04%) | 720.20 | Tue 23 Apr 2024 |
| Azad Engineering | 1550.00 (-1.3%) | 1570.34 (+%) | Thu 01 Jan 1970 | |
| Bikaji Foods | 575.00 (-3.18%) | 620.00 (+%) | Thu 01 Jan 1970 |
Top Small Cap Stocks That Created a New All Time High Today
Companies with Market Capital less than 5,000 Crores| Stock | Close | New All-Time High (ATH) | Previous ATH | Previous ATH Date |
|---|---|---|---|---|
| Ace Software Exports | 213.25 (+1.98%) | 213.25 (+41.9%) | 150.28 | Mon 01 Apr 2024 |
| ADC India Communications | 1379.19 (-0.77%) | 1490.00 (+%) | Thu 01 Jan 1970 | |
| Ahmedabad Steelcraft | 72.37 (+1.98%) | 72.37 (+%) | Thu 01 Jan 1970 | |
| A.K. Spintex | 170.50 (+2.18%) | 178.00 (+%) | Thu 01 Jan 1970 | |
| Arnold Holdings Ltd. | 51.00 (-0.78%) | 53.51 (+%) | Thu 01 Jan 1970 |


