Home / Fri 05 Jul 2024 Market Recap
05 Jul 2024: Nifty 50 Closes at ₹24,320.8 (+0.07%), Coal India & MPHASIS Show Strong Trends!

Show Table of Contents
Table of Contents
- 1: Top Indices Performance Overview
- 2: Nifty 50 Performance Overview
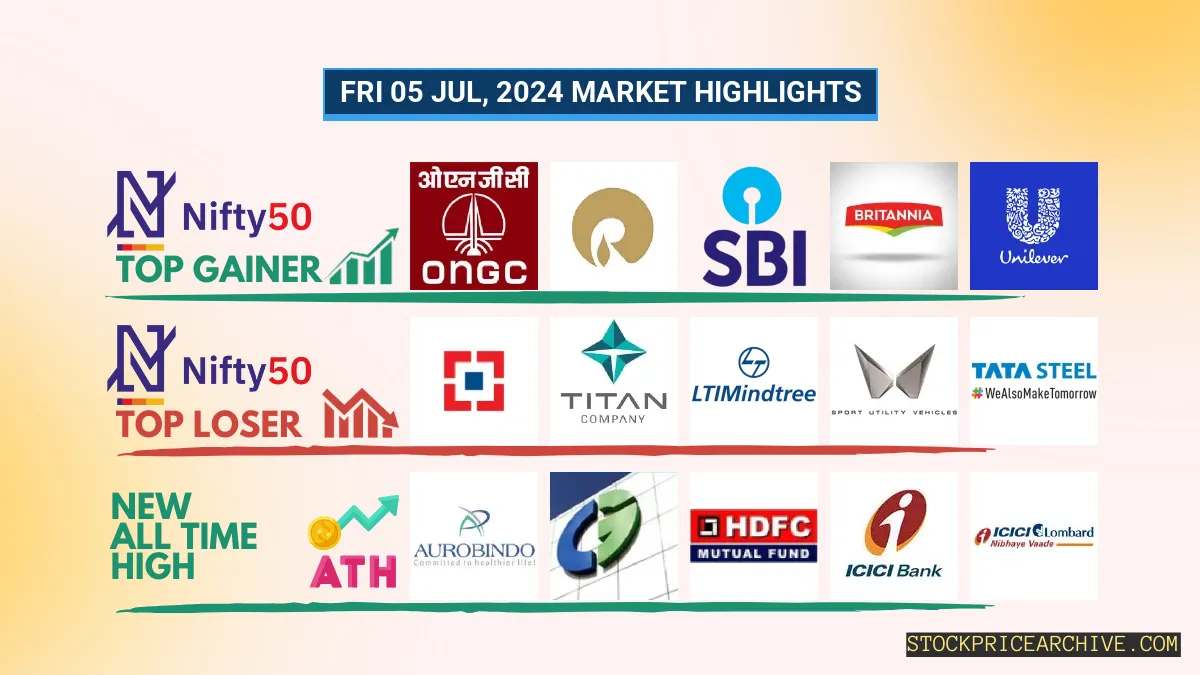
- 2.1: Nifty 50 Top Gainers
- 2.2: Nifty 50 Top Losers
- 2.3: Nifty 50 Stocks To Watch for Tomorrow
- 2.3.1: Coal India (Bullish Pattern)
- 2.3.2: ➲ TITAN (Bearish Pattern)
- 3: Nifty 500 Performance Overview
- 3.1: Nifty 500 Top Gainers
- 3.2: Nifty 500 Top Losers
- 3.3: Nifty 51 to 500 Stocks To Watch for Tomorrow
- 3.3.1: ➲ MphasiS (Looking Bullish)
- 3.3.2: ➲ Apollo Tyres (Bearish Trend)
- 4: Top Stocks That Created a New All Time High Today
- 4.1: Top Large Cap Stocks That Created a New All Time High Today
- 4.2: Top Mid Cap Stocks That Created a New All Time High Today
- 4.3: Top Small Cap Stocks That Created a New All Time High Today
Top Indices Performance Overview
| Stock | Close | Range |
|---|---|---|
| NIFTY 50 | ₹24,320.8 (0.07%) | ₹24,205.94 – ₹24401 |
| NIFTY BANK | ₹52,633.14 (-0.89%) | ₹52,431.44 – ₹53,357.69 |
| NIFTY FIN SERVICE | ₹23,628.55 (-1.02%) | ₹23,499.05 – ₹23,715.05 |
| NIFTY IT | ₹37,652.1 (-0.21%) | ₹37,491.94 – ₹37,882.44 |
| NIFTY AUTO | ₹25,383.65 (-0.05%) | ₹25,226.84 – ₹25,427.75 |
| NIFTY ENERGY | ₹42,579.35 (1.68%) | ₹41,714.94 – ₹42,622.39 |
Nifty 50 Performance Overview
The Nifty 50 started the day at ₹24,369.94. It traded in a range, hitting a low of ₹24,205.94 and a high of ₹24,401. The index closed the day at ₹24,320.8 (+0.07%), ending the session slightly up.
The movement was influenced by strong performers and laggards. You can find the top gainers and losers below.
Nifty 50 Top Gainers
| Stock | Close | Range |
|---|---|---|
| ONGC | ₹288.54 (4.15%) | ₹273.04 – ₹289.2 |
| Reliance Industries | ₹3190 (2.63%) | ₹3,101.6 – ₹3,196.44 |
| SBI | ₹859.59 (2.41%) | ₹834.29 – ₹861.25 |
| Britannia | ₹5,539.89 (2.09%) | ₹5,397.54 – ₹5,553.79 |
| Hindustan Unilever | ₹2547 (2.05%) | ₹2,492.89 – ₹2554 |
Nifty 50 Top Losers
| Stock | Close | Range |
|---|---|---|
| HDFC BANK | ₹1,649.94 (-4.52%) | ₹1,642.19 – ₹1,759.75 |
| TITAN | ₹3273 (-1.89%) | ₹3257 – ₹3,369.89 |
| LTIMindtree | ₹5,413.25 (-0.95%) | ₹5,400.2 – ₹5520 |
| Mahindra & Mahindra | ₹2876 (-0.9%) | ₹2,840.05 – ₹2886 |
| Tata Steel | ₹175 (-0.73%) | ₹173.7 – ₹178.19 |
Nifty 50 Stocks To Watch for Tomorrow
Coal India (Bullish Pattern)
- Performance Overview: Over the last 26 trading days, Coal India’s stock has closed higher 14 times and lower 12 times. This shows a balanced performance, suggesting potential for both growth and volatility.
- Recent Trend: Coal India has been on a strong upward swing, closing higher for the past 6 trading days. The stock has been trending upward since Thursday, June 27th, 2024.
- Returns: Coal India has delivered a positive return of 1.08% over the past 26 trading days. This means if you had invested ₹10,000 during that time, it would now be worth ₹10,108.
- Financial Insight: Coal India has performed well financially. Over the past 12 months, the company has generated a revenue of ₹1,30,325.64 Crore and a profit of ₹37,402.28 Crore. This strong financial performance indicates a healthy company with the potential for continued growth.
- As of Friday, July 5th, 2024, Coal India has a Market Capital of ₹3,01,696.44 Crore. This large market cap highlights the company’s significant size and influence within the market.
- Summary: Coal India’s stock exhibits a positive and strong bullish pattern. It’s currently on an upward trend and has a strong financial track record. Interested investors should closely monitor the stock’s price movements for potential short-term and long-term growth opportunities: Checkout Coal India Target for Tomorrow and Coal India Targets for 2024 & 2025.
Coal India Financial Performance
| Metric | Value | Description |
|---|---|---|
| Market Capital | 3,01,696.44 Crore | Market valuation of Coal India’s shares. |
| Revenue (TTM) | 1,30,325.64 Crore | Total revenue generated by Coal India over the past twelve months. |
| Net Income (TTM) | +37,402.28 Crore | Net Profit or Loss after all the expenses over the past twelve months. |
| Operating Margin | 27.27% | Income from operations as a percentage of revenue, before taxes and interest. |
| Profit Margin | 28.69% | Net income as a percentage of revenue, after all expenses. |
| Revenue Growth (Quarterly) | -25.2% | Change in revenue compared to the previous quarter. |
| Earnings Growth (YOY Quarterly) | +56.89% | Change in earnings compared to the same quarter last year. |
| Debt-to-Equity (D/E) Ratio | 7.8 | Company’s total debt divided by total shareholder equity. |
| Total Debt | 6,523.02 Crore | Sum of Coal India’s current & long-term financial obligations. |
| Total Cash | 33,486.27 Crore | Total amount of liquid funds available to Coal India. |
| Beta | 0.27 | Beta is less than 1 indicating that the Coal India’s price is less volatile than the market. |
➲ TITAN (Bearish Pattern)
- Performance Overview: Over the past 26 trading days, TITAN’s share price has closed lower 15 times and higher 11 times.
- Recent Trend: TITAN has been on a downward trend, closing lower for the past four consecutive trading days. The last time it closed higher was on Monday, July 1st, 2024.
- Returns: Over the last 26 trading days, TITAN has generated a negative return of -2.74%. This means that an investment of ₹10,000 would have decreased to ₹9,726.
- Financial Insight: During the past 12 months, TITAN generated a revenue of ₹51,084 Crore and recorded a profit of ₹3,495.99 Crore.
- As of Friday, July 5th, 2024, TITAN has a Market Capital of ₹3,06,218.19 Crore.
- Summary: TITAN is currently showing a bearish pattern. We recommend investors carefully monitor its performance, particularly its potential target for tomorrow and its projected targets for 2024 and 2025.
TITAN Financial Performance
| Metric | Value | Description |
|---|---|---|
| Market Capital | 3,06,218.19 Crore | Market valuation of TITAN’s shares. |
| Revenue (TTM) | 51,084 Crore | Total revenue generated by TITAN over the past twelve months. |
| Net Income (TTM) | +3,495.99 Crore | Net Profit or Loss after all the expenses over the past twelve months. |
| Operating Margin | 8.26% | Income from operations as a percentage of revenue, before taxes and interest. |
| Profit Margin | 6.84% | Net income as a percentage of revenue, after all expenses. |
| Revenue Growth (Quarterly) | +20.6% | Change in revenue compared to the previous quarter. |
| Earnings Growth (YOY Quarterly) | +5.6% | Change in earnings compared to the same quarter last year. |
| Debt-to-Equity (D/E) Ratio | 165.31 | Company’s total debt divided by total shareholder equity. |
| Total Debt | 15,527.99 Crore | Sum of TITAN’s current & long-term financial obligations. |
| Total Cash | 3,192 Crore | Total amount of liquid funds available to TITAN. |
| Beta | 0.46 | Beta is less than 1 indicating that the TITAN’s price is less volatile than the market. |
Nifty 500 Performance Overview
The Nifty 500 kicked off the day at ₹22,874.84, showing some lively trading throughout the session. It dipped to a low of ₹22,838.4 before climbing to a high of ₹23,011.69. By the closing bell, it settled at ₹22,980.5, ending the day with a modest gain of +0.27%.
The movement of the Nifty 500 today was influenced by a mix of stocks showing strong gains and others facing losses. You can find a table below highlighting the top performers and underperformers for the day.
Nifty 500 Top Gainers
| Stock | Close | Range |
|---|---|---|
| Rail Vikas Nigam | ₹492.14 (17.52%) | ₹417.25 – ₹498.5 |
| Yes Bank | ₹26.66 (11.31%) | ₹23.81 – ₹27.02 |
| Ircon International | ₹308 (10%) | ₹277.04 – ₹315.7 |
| Raymond | ₹3,233.05 (9.96%) | ₹2925 – ₹3407 |
| Vardhman Textiles | ₹531.9 (9.63%) | ₹477.79 – ₹552.95 |
Nifty 500 Top Losers
| Stock | Close | Range |
|---|---|---|
| HDFC BANK | ₹1,649.94 (-4.52%) | ₹1,642.19 – ₹1,759.75 |
| Grindwell Norton | ₹2,856.35 (-3.21%) | ₹2850 – ₹2960 |
| PB Fintech | ₹1,376.94 (-3.05%) | ₹1375 – ₹1472 |
| Vedant Fashions | ₹1094 (-2.82%) | ₹1,088.65 – ₹1145 |
| KPIT Technologies | ₹1695 (-2.68%) | ₹1,681.69 – ₹1,774.09 |
Nifty 51 to 500 Stocks To Watch for Tomorrow
➲ MphasiS (Looking Bullish)
- Performance Overview: Over the last 26 trading days, MphasiS has closed higher 18 times and lower 8 times.
- Recent Trend: MphasiS has been on a 9-day winning streak, closing higher every day since Monday, June 24, 2024.
- Returns: Investing ₹10,000 in MphasiS over the past 26 trading days would have yielded a return of 11.13%, bringing your investment to ₹11,113.
- Financial Insight: MphasiS has generated a revenue of ₹13,278.51 Crore and a profit of ₹1,554.81 Crore over the past 12 months.
- As of Friday, July 5, 2024, MphasiS has a Market Capital of ₹48,840.56 Crore.
- Summary: MphasiS is showing strong signs of bullish momentum. Investors may want to keep an eye on its price movements for both short-term and long-term growth opportunities. Checkout MphasiS Target for Tomorrow and MphasiS Targets for 2024 & 2025 to learn more.
MphasiS Financial Performance
| Metric | Value | Description |
|---|---|---|
| Market Capital | 48,840.56 Crore | Market valuation of MphasiS’s shares. |
| Revenue (TTM) | 13,278.51 Crore | Total revenue generated by MphasiS over the past twelve months. |
| Net Income (TTM) | +1,554.81 Crore | Net Profit or Loss after all the expenses over the past twelve months. |
| Operating Margin | 10.11% | Income from operations as a percentage of revenue, before taxes and interest. |
| Profit Margin | 11.7% | Net income as a percentage of revenue, after all expenses. |
| Revenue Growth (Quarterly) | +1.5% | Change in revenue compared to the previous quarter. |
| Earnings Growth (YOY Quarterly) | -3% | Change in earnings compared to the same quarter last year. |
| Debt-to-Equity (D/E) Ratio | 27.16 | Company’s total debt divided by total shareholder equity. |
| Total Debt | 2,388.58 Crore | Sum of MphasiS’s current & long-term financial obligations. |
| Total Cash | 3,407.02 Crore | Total amount of liquid funds available to MphasiS. |
| Beta | 0.74 | Beta is less than 1 indicating that the MphasiS’s price is less volatile than the market. |
➲ Apollo Tyres (Bearish Trend)
- Performance Overview: In the last 26 trading days, Apollo Tyres has closed lower 15 times and higher 11 times.
- Recent Trend: Apollo Tyres has been on a downward trend for the past four days, closing lower each day since Monday, July 1, 2024.
- Returns: Over the last 26 trading sessions, Apollo Tyres has delivered a 11.49% return. This means that an investment of ₹10,000 would have grown to ₹11,149.
- Financial Insight: Over the past 12 months, Apollo Tyres has generated revenue of ₹25,377.71 Crore and a profit of ₹1,721.86 Crore.
- As of Friday, July 5, 2024, Apollo Tyres has a Market Capital of ₹33,565.08 Crore.
- Summary: Apollo Tyres is currently experiencing a bearish phase. Keep an eye on Apollo Tyres’s potential target for tomorrow and its projected targets for 2024 and 2025.
Apollo Tyres Financial Performance
| Metric | Value | Description |
|---|---|---|
| Market Capital | 33,565.08 Crore | Market valuation of Apollo Tyres’s shares. |
| Revenue (TTM) | 25,377.71 Crore | Total revenue generated by Apollo Tyres over the past twelve months. |
| Net Income (TTM) | +1,721.86 Crore | Net Profit or Loss after all the expenses over the past twelve months. |
| Operating Margin | 10.22% | Income from operations as a percentage of revenue, before taxes and interest. |
| Profit Margin | 6.78% | Net income as a percentage of revenue, after all expenses. |
| Revenue Growth (Quarterly) | +7.9% | Change in revenue compared to the previous quarter. |
| Earnings Growth (YOY Quarterly) | -17.2% | Change in earnings compared to the same quarter last year. |
| Debt-to-Equity (D/E) Ratio | 35.28 | Company’s total debt divided by total shareholder equity. |
| Total Debt | 4,905.1 Crore | Sum of Apollo Tyres’s current & long-term financial obligations. |
| Total Cash | 1,415.58 Crore | Total amount of liquid funds available to Apollo Tyres. |
| Beta | 0.9 | Beta is less than 1 indicating that the Apollo Tyres’s price is less volatile than the market. |
Top Stocks That Created a New All Time High Today
Top Large Cap Stocks That Created a New All Time High Today
Companies with Market Capital more than 20,000 Crores| Stock | Close | New All-Time High (ATH) | Previous ATH | Previous ATH Date |
|---|---|---|---|---|
| Aegis Logistics | 917.00 (+2.92%) | 925.00 (+66.98%) | 553.95 | Thu 18 Apr 2024 |
| Aurobindo Pharma | 1303.55 (+3.89%) | 1311.80 (+%) | Thu 01 Jan 1970 | |
| BASF | 5379.10 (+2.99%) | 5465.00 (+%) | Thu 01 Jan 1970 | |
| Blue Star | 1727.00 (+7.52%) | 1803.75 (+%) | Thu 01 Jan 1970 | |
| CEBBCO | 728.79 (+0.94%) | 747.50 (+72.31%) | 433.80 | Mon 01 Jan 2024 |
Top Mid Cap Stocks That Created a New All Time High Today
Companies with Market Capital between 5,000 Crores to 20,000 Crores| Stock | Close | New All-Time High (ATH) | Previous ATH | Previous ATH Date |
|---|---|---|---|---|
| Ahluwalia Contracts | 1462.00 (+11.9%) | 1524.69 (+%) | Thu 01 Jan 1970 | |
| Black Box | 395.00 (+7.57%) | 400.00 (+%) | Thu 01 Jan 1970 | |
| BEML | 5089.89 (+9.33%) | 5209.00 (+%) | Thu 01 Jan 1970 | |
| Data Patterns | 3400.00 (+6.92%) | 3463.39 (+12.44%) | 3080.00 | Mon 04 Mar 2024 |
| Dhanuka Agritech | 1797.00 (+5.97%) | 1799.00 (+28.87%) | 1395.90 | Mon 22 Apr 2024 |
Top Small Cap Stocks That Created a New All Time High Today
Companies with Market Capital less than 5,000 Crores| Stock | Close | New All-Time High (ATH) | Previous ATH | Previous ATH Date |
|---|---|---|---|---|
| 21ST CENTURY MANAG | 73.48 (+1.99%) | 73.48 (+%) | Thu 01 Jan 1970 | |
| Ace Software Exports | 263.75 (+1.99%) | 263.75 (+75.5%) | 150.28 | Mon 01 Apr 2024 |
| ADC India Communications | 2198.35 (-0.27%) | 2297.00 (+%) | Thu 01 Jan 1970 | |
| Ahmedabad Steelcraft | 113.85 (+1.97%) | 113.85 (+%) | Thu 01 Jan 1970 | |
| Ashish Polyplast | 79.83 (+1.99%) | 79.83 (+%) | Thu 01 Jan 1970 |


