Home / Wed 07 Aug 2024 Market Recap
07 Aug 2024: Nifty 50 Closes at ₹24,316.05 (+1.34%), Adani Enterprises & ONGC Lead Gains, Alkem Labs has been on a 5-day winning streak!
Show Table of Contents
Table of Contents
- 1: Top Indices Performance Overview
- 2: Nifty 50 Performance Overview
- 2.1: Nifty 50 Top Gainers
- 2.2: Nifty 50 Top Losers
- 2.3: Nifty 50 Stocks To Watch for Tomorrow
- 2.3.1: ➲ Adani Enterprises (Bullish Pattern)
- 2.3.2: ➲ IndusInd Bank (Showing a Downward Trend)
- 3: Nifty 500 Performance Overview
- 3.1: Nifty 500 Top Gainers
- 3.2: Nifty 500 Top Losers
- 3.3: Nifty 51 to 500 Stocks To Watch for Tomorrow
- 3.3.1: ➲ Alkem Labs (Looking Upward!)
- 3.3.2: ➲ Easy Trip (Bearish Pattern)
- 4: Top Stocks That Created a New All Time High Today
- 4.1: Top Large Cap Stocks That Created a New All Time High Today
- 4.2: Top Mid Cap Stocks That Created a New All Time High Today
- 4.3: Top Small Cap Stocks That Created a New All Time High Today
Top Indices Performance Overview
| Stock | Close | Range |
|---|---|---|
| NIFTY 50 | ₹24,316.05 (1.34%) | ₹24,184.9 – ₹24,337.69 |
| NIFTY BANK | ₹50,226.44 (0.96%) | ₹49,782.19 – ₹50,292.44 |
| NIFTY FIN SERVICE | ₹22,846.3 (1.44%) | ₹22,622.05 – ₹22,857.94 |
| NIFTY IT | ₹39,194.8 (1.47%) | ₹38,882.94 – ₹39,427.1 |
| NIFTY AUTO | ₹24,937.59 (1.7%) | ₹24,789.84 – ₹25,028.19 |
| NIFTY ENERGY | ₹43,400.39 (2.17%) | ₹42,909.6 – ₹43,446.5 |
Nifty 50 Performance Overview
The Nifty 50 started the day at ₹24,289.4, showing some volatility throughout the session. It touched a low of ₹24,184.9 before climbing to a high of ₹24,337.69. Ultimately, the index closed at ₹24,316.05, a positive gain of 1.34%.
The table below highlights the top gainers and losers, which played a role in shaping the Nifty 50’s performance today.
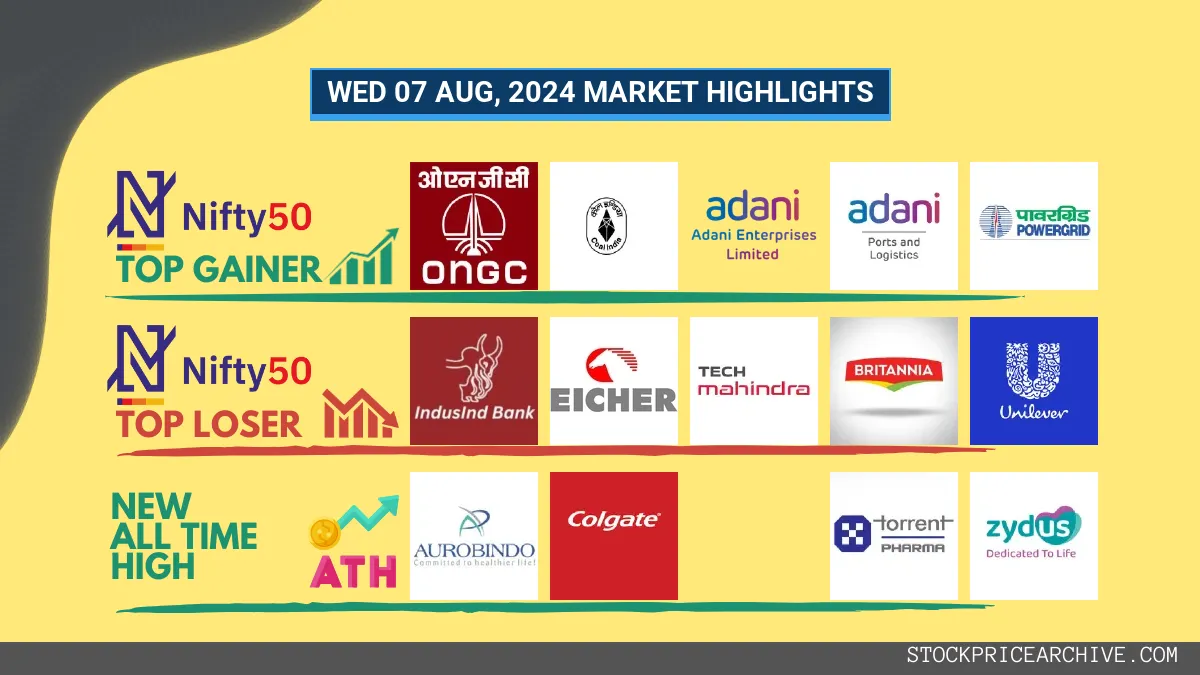
Nifty 50 Top Gainers
| Stock | Close | Range |
|---|---|---|
| ONGC | ₹328.89 (7.44%) | ₹312 – ₹330.95 |
| Coal India | ₹531.5 (6.38%) | ₹507.7 – ₹532.79 |
| Adani Enterprises | ₹3,187.69 (3.74%) | ₹3112 – ₹3,188.75 |
| Adani Ports | ₹1,543.8 (3.32%) | ₹1,514.19 – ₹1,547.84 |
| Power Grid | ₹352.04 (3.31%) | ₹343.39 – ₹352.54 |
Nifty 50 Top Losers
| Stock | Close | Range |
|---|---|---|
| IndusInd Bank | ₹1,347.15 (-2.46%) | ₹1,329.19 – ₹1,399.5 |
| Eicher Motors | ₹4,597.14 (-1.22%) | ₹4,579.39 – ₹4690 |
| Tech Mahindra | ₹1,473.65 (-0.66%) | ₹1,471.25 – ₹1,514.55 |
| Britannia | ₹5,836.79 (-0.31%) | ₹5,809.04 – ₹5,924.79 |
| Hindustan Unilever | ₹2,742.5 (-0.28%) | ₹2,735.64 – ₹2,779.14 |
Nifty 50 Stocks To Watch for Tomorrow
➲ Adani Enterprises (Bullish Pattern)
- Performance Overview: Over the last 26 trading sessions (ending on Wednesday, August 7, 2024), Adani Enterprises has closed higher 12 times and lower 14 times.
- Recent Trend: Adani Enterprises has been on a 2-day winning streak, closing in the green since Monday, August 5, 2024.
- Returns: Adani Enterprises has provided a 0.24% return during this period. If you had invested ₹10,000, it would now be worth ₹10,024.
- Financial Insight: Over the last 12 months, Adani Enterprises generated a revenue of ₹99,248.91 Crore and earned a profit of ₹3,887.4 Crore.
- As of Wednesday, August 7, 2024, Adani Enterprises has a Market Capital of ₹3,60,399.58 Crore.
- Summary: Adani Enterprises is showing a strong bullish pattern. Investors are keeping a close eye on its price movements to identify both short-term and long-term growth opportunities. Checkout Adani Enterprises Target for Tomorrow and Adani Enterprises Targets for 2024 & 2025 for more insights.
Adani Enterprises Financial Performance
| Metric | Value | Description |
|---|---|---|
| Market Capital | 3,60,399.58 Crore | Market valuation of Adani Enterprises’s shares. |
| Revenue (TTM) | 99,248.91 Crore | Total revenue generated by Adani Enterprises over the past twelve months. |
| Net Income (TTM) | +3,887.4 Crore | Net Profit or Loss after all the expenses over the past twelve months. |
| Operating Margin | 11.12% | Income from operations as a percentage of revenue, before taxes and interest. |
| Profit Margin | 4.05% | Net income as a percentage of revenue, after all expenses. |
| Revenue Growth (Quarterly) | +0.1% | Change in revenue compared to the previous quarter. |
| Earnings Growth (YOY Quarterly) | +115.8% | Change in earnings compared to the same quarter last year. |
| Debt-to-Equity (D/E) Ratio | 147.8 | Company’s total debt divided by total shareholder equity. |
| Total Debt | 65,310.14 Crore | Sum of Adani Enterprises’s current & long-term financial obligations. |
| Total Cash | 4,380.95 Crore | Total amount of liquid funds available to Adani Enterprises. |
| Beta | 0.93 | Beta is less than 1 indicating that the Adani Enterprises’s price is less volatile than the market. |
➲ IndusInd Bank (Showing a Downward Trend)
- Performance Overview: Over the past 26 trading days, IndusInd Bank’s share price has closed lower 16 times and higher 10 times.
- Recent Trend: IndusInd Bank has been on a downward streak for the last six trading days, with no positive closes since Tuesday, July 30, 2024.
- Returns: In the last 26 trading sessions, IndusInd Bank has seen a 7.57% decline in its share price. This means that an investment of ₹10,000 would have dropped to ₹9,243 during this period.
- Financial Insight: Over the past 12 months, Adani Enterprises has brought in ₹26,840.87 Crore in revenue and generated a profit of ₹9,023.59 Crore.
- As of Wednesday, August 7, 2024, Adani Enterprises has a Market Capital of ₹1,07,547.44 Crore.
- Summary: IndusInd Bank is currently experiencing a downward trend. We suggest investors pay close attention to its performance, particularly its potential price movement for tomorrow and expected price targets for 2024 and 2025.
IndusInd Bank Financial Performance
| Metric | Value | Description |
|---|---|---|
| Market Capital | 1,07,547.44 Crore | Market valuation of IndusInd Bank’s shares. |
| Revenue (TTM) | 26,840.87 Crore | Total revenue generated by IndusInd Bank over the past twelve months. |
| Net Income (TTM) | +9,023.59 Crore | Net Profit or Loss after all the expenses over the past twelve months. |
| Operating Margin | 42.68% | Income from operations as a percentage of revenue, before taxes and interest. |
| Profit Margin | 33.61% | Net income as a percentage of revenue, after all expenses. |
| Revenue Growth (Quarterly) | +11.7% | Change in revenue compared to the previous quarter. |
| Earnings Growth (YOY Quarterly) | +2.19% | Change in earnings compared to the same quarter last year. |
| Debt-to-Equity (D/E) Ratio | 0.75 | Company’s total debt divided by total shareholder equity. |
| Total Debt | 47,611.4 Crore | Sum of IndusInd Bank’s current & long-term financial obligations. |
| Total Cash | 36,907.41 Crore | Total amount of liquid funds available to IndusInd Bank. |
| Beta | 1.36 | Beta is greater than 1 indicating that the IndusInd Bank’s price is more volatile than the market. |
Nifty 500 Performance Overview
The Nifty 500 kicked off the day at ₹22,764.9, showing some spirited movement throughout the session. It dipped to a low of ₹22,651.69 before rallying to a high of ₹22,870.5. The index ultimately closed strong, ending the day at ₹22,867.5 (+1.89%).
The day’s gains were driven by a combination of factors, with top gainers and losers playing a key role.
Nifty 500 Top Gainers
| Stock | Close | Range |
|---|---|---|
| Tejas Networks | ₹1,290.44 (12.1%) | ₹1,165.19 – ₹1,310.05 |
| HFCL | ₹138.3 (11.53%) | ₹124.4 – ₹139.66 |
| Oil India | ₹616 (7.82%) | ₹585.59 – ₹624.9 |
| Piramal Pharma | ₹180.6 (7.67%) | ₹169.25 – ₹180.6 |
| ONGC | ₹328.89 (7.44%) | ₹312 – ₹330.95 |
Nifty 500 Top Losers
| Stock | Close | Range |
|---|---|---|
| Shree Cement | ₹25,098.59 (-6.47%) | ₹24966 – ₹26,694.94 |
| EIH | ₹375 (-5.46%) | ₹357.35 – ₹387 |
| Varroc Engineering | ₹580 (-4.64%) | ₹579.04 – ₹638.75 |
| Archean Chemical | ₹680.34 (-4.07%) | ₹677.29 – ₹720.65 |
| Timken India | ₹4040 (-3.95%) | ₹4040 – ₹4,240.1 |
Nifty 51 to 500 Stocks To Watch for Tomorrow
➲ Alkem Labs (Looking Upward!)
- Performance Overview: Over the past 25 trading days, Alkem Labs has closed higher 15 times and lower 10 times. This suggests some positive momentum in its recent performance.
- Recent Trend: Alkem Labs has been on a 5-day winning streak, with no red days since Monday, July 29, 2024.
- Returns: Investing ₹10,000 in Alkem Labs over the last 25 trading days would have yielded a return of 10.94%, bringing your total to ₹11,094. That’s a solid gain!
- Financial Insight: In the past year, Alkem Labs generated a revenue of ₹12,667.57 Crore and a profit of ₹1,795.76 Crore. This strong financial performance is a good sign for the company’s health.
- As of Wednesday, August 7, 2024, Alkem Labs has a Market Capital of ₹63,645.64 Crore.
- Summary: Alkem Labs is currently showing a strong upward trend. Investors who are interested in this stock should keep a close eye on its price movements, both for potential short-term and long-term gains. Checkout Alkem Labs Target for Tomorrow and Alkem Labs Targets for 2024 & 2025 for more insights.
Alkem Labs Financial Performance
| Metric | Value | Description |
|---|---|---|
| Market Capital | 63,645.64 Crore | Market valuation of Alkem Labs’s shares. |
| Revenue (TTM) | 12,667.57 Crore | Total revenue generated by Alkem Labs over the past twelve months. |
| Net Income (TTM) | +1,795.76 Crore | Net Profit or Loss after all the expenses over the past twelve months. |
| Operating Margin | 11.57% | Income from operations as a percentage of revenue, before taxes and interest. |
| Profit Margin | 14.17% | Net income as a percentage of revenue, after all expenses. |
| Revenue Growth (Quarterly) | +1.09% | Change in revenue compared to the previous quarter. |
| Earnings Growth (YOY Quarterly) | +313.6% | Change in earnings compared to the same quarter last year. |
| Debt-to-Equity (D/E) Ratio | 13.23 | Company’s total debt divided by total shareholder equity. |
| Total Debt | 1,418.4 Crore | Sum of Alkem Labs’s current & long-term financial obligations. |
| Total Cash | 4,269.71 Crore | Total amount of liquid funds available to Alkem Labs. |
| Beta | 0.4 | Beta is less than 1 indicating that the Alkem Labs’s price is less volatile than the market. |
➲ Easy Trip (Bearish Pattern)
- Performance Overview: In the last 26 trading sessions, Easy Trip has closed in red 16 times and in green 10 times. This suggests a recent period of volatility for the stock.
- Recent Trend: Easy Trip has been on a 8-day red streak, without a single day closing in green since Fri 26 Jul 2024. This streak might be a cause for concern for short-term investors.
- Returns: Easy Trip gave a -5.61% returns in the last 26 trading sessions, that means your investment of ₹10,000 would have become ₹9,439. While this represents a loss, it’s important to remember that past performance isn’t necessarily indicative of future results.
- Financial Insight: Over the past 12 months, Alkem Labs has generated a revenue of ₹590.57 Crore and created a profit of ₹103.1 Crore. These figures offer insights into the company’s financial health.
- As of Wed 07 Aug 2024, Alkem Labs has a Market Capital of ₹6,903.86 Crore. This reflects the total value of the company in the market.
- Summary: Easy Trip is currently experiencing a bearish phase. It’s a good time for investors to monitor the stock closely, particularly focusing on Easy Trip Target for Tomorrow and Easy Trip Targets for 2024 & 2025. Staying informed about potential price movements is key in making sound investment decisions.
Easy Trip Financial Performance
| Metric | Value | Description |
|---|---|---|
| Market Capital | 6,903.86 Crore | Market valuation of Easy Trip’s shares. |
| Revenue (TTM) | 590.57 Crore | Total revenue generated by Easy Trip over the past twelve months. |
| Net Income (TTM) | +103.1 Crore | Net Profit or Loss after all the expenses over the past twelve months. |
| Operating Margin | 6.53% | Income from operations as a percentage of revenue, before taxes and interest. |
| Profit Margin | 17.45% | Net income as a percentage of revenue, after all expenses. |
| Revenue Growth (Quarterly) | +40.69% | Change in revenue compared to the previous quarter. |
| Earnings Growth (YOY Quarterly) | +40.69% | Change in earnings compared to the same quarter last year. |
| Debt-to-Equity (D/E) Ratio | 3.11 | Company’s total debt divided by total shareholder equity. |
| Total Debt | 19.47 Crore | Sum of Easy Trip’s current & long-term financial obligations. |
| Total Cash | 192.79 Crore | Total amount of liquid funds available to Easy Trip. |
| Beta | 0.22 | Beta is less than 1 indicating that the Easy Trip’s price is less volatile than the market. |
Top Stocks That Created a New All Time High Today
Top Large Cap Stocks That Created a New All Time High Today
Companies with Market Capital more than 20,000 Crores| Stock | Close | New All-Time High (ATH) | Previous ATH | Previous ATH Date |
|---|---|---|---|---|
| Ajanta Pharma | 2939.60 (+5.42%) | 2965.00 (+%) | Thu 01 Jan 1970 | |
| Aurobindo Pharma | 1465.15 (+4.53%) | 1472.09 (+%) | Thu 01 Jan 1970 | |
| BASF | 6933.14 (+19.99%) | 6933.14 (+%) | Thu 01 Jan 1970 | |
| Colgate Palmolive | 3448.75 (+1.71%) | 3454.80 (+22.73%) | 2814.89 | Wed 03 Apr 2024 |
| Glaxosmithkline | 2825.00 (+1.71%) | 2891.10 (+%) | Thu 01 Jan 1970 |
Top Mid Cap Stocks That Created a New All Time High Today
Companies with Market Capital between 5,000 Crores to 20,000 Crores| Stock | Close | New All-Time High (ATH) | Previous ATH | Previous ATH Date |
|---|---|---|---|---|
| Akzo Nobel India | 3210.64 (+3.46%) | 3250.00 (+%) | Thu 01 Jan 1970 | |
| Bikaji Foods | 786.34 (+6.87%) | 794.45 (+%) | Thu 01 Jan 1970 | |
| Cera Sanitaryware | 9956.95 (+1.25%) | 10286.70 (+%) | Thu 01 Jan 1970 | |
| Gokaldas Exports | 1003.50 (-7%) | 1117.94 (+%) | Thu 01 Jan 1970 | |
| Granules India | 656.29 (+1.24%) | 663.59 (+%) | Thu 01 Jan 1970 |
Top Small Cap Stocks That Created a New All Time High Today
Companies with Market Capital less than 5,000 Crores| Stock | Close | New All-Time High (ATH) | Previous ATH | Previous ATH Date |
|---|---|---|---|---|
| 21ST CENTURY MANAG | 91.57 (+1.99%) | 91.57 (+%) | Thu 01 Jan 1970 | |
| Ahmedabad Steelcraft | 175.39 (+1.97%) | 175.39 (+%) | Thu 01 Jan 1970 | |
| BALUFORGE | 536.90 (+14.52%) | 545.00 (+%) | Thu 01 Jan 1970 | |
| Bits | 7.05 (+1.87%) | 7.05 (+%) | Thu 01 Jan 1970 | |
| Ceenik Exports | 1078.90 (+1.99%) | 1078.90 (+111.05%) | 511.20 | Wed 24 Apr 2024 |


