Home / Wed 05 Jun 2024 Market Recap
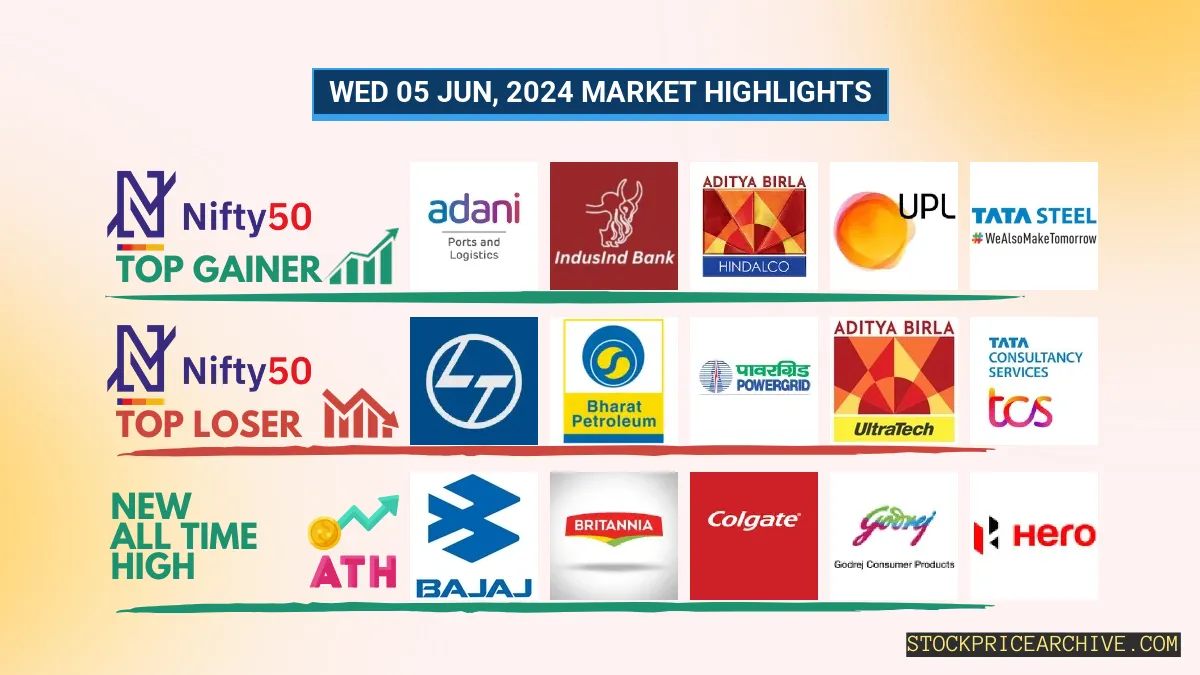
05 Jun 2024: Nifty Closes at ₹22,568.3 (+3.12%) with Adani Ports & IndusInd Bank Leading Gains. Explore Top Performers & Stocks to Watch!
Show Table of Contents
Table of Contents
- 1: Top Indices Performance Overview
- 2: Nifty 50 Performance Overview
- 2.1: Nifty 50 Top Gainers
- 2.2: Nifty 50 Top Losers
- 2.3: Nifty 50 Stocks To Watch for Tomorrow
- 2.3.1: ➲ Cipla (Bullish Pattern)
- 2.3.2: ➲ Bharat Petroleum (Bearish Pattern)
- 3: Nifty 500 Performance Overview
- 3.1: Nifty 500 Top Gainers
- 3.2: Nifty 500 Top Losers
- 3.3: Nifty 51 to 500 Stocks To Watch for Tomorrow
- 3.3.1: ➲ Krishna Institute of Medical Sciences (Bullish Pattern)
- 3.3.2: ➲ GMM Pfaudler (Bearish Pattern)
- 4: Top Stocks That Created a New All Time High Today
- 4.1: Top Large Cap Stocks That Created a New All Time High Today
- 4.2: Top Mid Cap Stocks That Created a New All Time High Today
- 4.3: Top Small Cap Stocks That Created a New All Time High Today
Top Indices Performance Overview
| Stock | Close | Range |
|---|---|---|
| NIFTY 50 | ₹22,568.3 (3.12%) | ₹21,795.59 – ₹22,669.44 |
| NIFTY BANK | ₹48,847.1 (4.08%) | ₹46,450.64 – ₹49,361.25 |
| NIFTY FIN SERVICE | ₹21,604.3 (3.76%) | ₹20,669.34 – ₹21,784.55 |
| NIFTY IT | ₹33,118.8 (2.48%) | ₹32,417.94 – ₹33,319.44 |
| NIFTY AUTO | ₹24,213.25 (4.39%) | ₹23,121.5 – ₹24,346.59 |
| NIFTY ENERGY | ₹38,691.3 (2.83%) | ₹36,528.75 – ₹38,799.69 |
Nifty 50 Performance Overview
The Nifty 50 commenced trading on a positive note at ₹22,107.19, displaying resilience throughout the session. It encountered a low of ₹21,795.59, followed by a peak of ₹22,669.44, before culminating at a close of ₹22,568.3, registering a commendable (+3.12%) gain.
Nifty 50 Top Gainers
| Stock | Close | Range |
|---|---|---|
| Adani Ports | ₹1341 (7.37%) | ₹1,161.33 – ₹1368 |
| IndusInd Bank | ₹1,489.75 (7.06%) | ₹1,372.8 – ₹1,515.69 |
| Hindalco | ₹691 (6.46%) | ₹608.15 – ₹700.65 |
| UPL | ₹527 (6.26%) | ₹496.45 – ₹531.79 |
| Tata Steel | ₹168.89 (6.26%) | ₹159 – ₹169.6 |
Nifty 50 Top Losers
| Stock | Close | Range |
|---|---|---|
| Larsen Toubro | ₹3395 (-0.25%) | ₹3,175.5 – ₹3,433.35 |
| Bharat Petroleum | ₹579.79 (-0.08%) | ₹534.2 – ₹601.15 |
| Power Grid | ₹298 (0.69%) | ₹279.2 – ₹301 |
| UltraTech Cement | ₹10013 (0.95%) | ₹9740 – ₹10070 |
| TCS | ₹3758 (1.15%) | ₹3,700.14 – ₹3,783.8 |
Nifty 50 Stocks To Watch for Tomorrow
➲ Cipla (Bullish Pattern)
- Performance Overview: In the last 26 trading sessions, Cipla has closed in green 14 times and in red 12 times.
- Recent Trend: Cipla has been on a 3-day green streak, steadily climbing since Fri 31 May 2024, without a single day closing in negative territory.
- Returns: Cipla has yielded impressive returns of 5.11% in the last 26 trading sessions, meaning that an investment of ₹10,000 would have grown to ₹10,511.
- Financial Highlights: Over the past 12 months, Cipla has recorded strong financial performance, generating a significant revenue of ₹25,446.62 Crore and posting an impressive profit of ₹4,121.55 Crore.
- As of Wed 05 Jun 2024, Cipla commands a substantial Market Capital of ₹1,17,346.38 Crore.
- Summary: Cipla’s bullish pattern signals a positive outlook. Prudent investors should keep a close watch on its price movements to identify potential opportunities for both short-term and long-term profit maximization. Check out our analysis: Cipla Target for Tomorrow and Cipla Targets for 2024 & 2025.
Cipla Financial Performance
| Metric | Value | Description |
|---|---|---|
| Market Capital | 1,17,346.38 Crore | Market valuation of Cipla’s shares. |
| Revenue (TTM) | 25,446.62 Crore | Total revenue generated by Cipla over the past twelve months. |
| Net Income (TTM) | +4,121.55 Crore | Net Profit or Loss after all the expenses over the past twelve months. |
| Operating Margin | 16.89% | Income from operations as a percentage of revenue, before taxes and interest. |
| Profit Margin | 16.19% | Net income as a percentage of revenue, after all expenses. |
| Revenue Growth (Quarterly) | +9.7% | Change in revenue compared to the previous quarter. |
| Earnings Growth (YOY Quarterly) | +78.6% | Change in earnings compared to the same quarter last year. |
| Debt-to-Equity (D/E) Ratio | 2.08 | Company’s total debt divided by total shareholder equity. |
| Total Debt | 559.41 Crore | Sum of Cipla’s current & long-term financial obligations. |
| Total Cash | 5,681.97 Crore | Total amount of liquid funds available to Cipla. |
| Beta | 0.36 | Beta is less than 1 indicating that the Cipla’s price is less volatile than the market. |
➲ Bharat Petroleum (Bearish Pattern)
- Performance Overview: Bharat Petroleum recently closed in the red for 14 out of the last 26 trading sessions, with a 58% probability of closing in the red. On the other hand, it closed in the green 12 times, with a probability of 46%.
- Recent Trend: Bharat Petroleum is currently on a 2-day red streak. Its last green day was on Mon 03 Jun 2024.
- Returns: In the last 26 trading sessions, Bharat Petroleum has yielded a negative return of -6.95%. This indicates that an investment of ₹10,000 would have decreased to ₹9,305.
- Financial Insight: Over the past 12 months, Bharat Petroleum has generated a revenue of ₹4,50,317.77 Crore and earned a profit of ₹26,858.84 Crore.
- As of Wed 05 Jun 2024, Bharat Petroleum’s Market Capitalization stands at a substantial ₹1,44,504.59 Crore.
- Summary: Bharat Petroleum is currently exhibiting a bearish trend. Investors are advised to monitor the stock closely, particularly with respect to its short-term target for tomorrow and its targets for 2024 and 2025.
Bharat Petroleum Financial Performance
| Metric | Value | Description |
|---|---|---|
| Market Capital | 1,44,504.59 Crore | Market valuation of Bharat Petroleum’s shares. |
| Revenue (TTM) | 4,50,317.77 Crore | Total revenue generated by Bharat Petroleum over the past twelve months. |
| Net Income (TTM) | +26,858.84 Crore | Net Profit or Loss after all the expenses over the past twelve months. |
| Operating Margin | 6.38% | Income from operations as a percentage of revenue, before taxes and interest. |
| Profit Margin | 5.96% | Net income as a percentage of revenue, after all expenses. |
| Revenue Growth (Quarterly) | -1.3% | Change in revenue compared to the previous quarter. |
| Earnings Growth (YOY Quarterly) | -30.3% | Change in earnings compared to the same quarter last year. |
| Debt-to-Equity (D/E) Ratio | 72.18 | Company’s total debt divided by total shareholder equity. |
| Total Debt | 54,599.05 Crore | Sum of Bharat Petroleum’s current & long-term financial obligations. |
| Total Cash | 10,577.03 Crore | Total amount of liquid funds available to Bharat Petroleum. |
| Beta | 1 | Beta is greater than 1 indicating that the Bharat Petroleum’s price is more volatile than the market. |
Nifty 500 Performance Overview
The Nifty 500 commenced trading at ₹20,562.05. It oscillated between a low of ₹20,116.65 and a high of ₹21,091.8 during the session, ultimately closing at ₹21,019, marking a gain of 3.42%.Nifty 500 Top Gainers
| Stock | Close | Range |
|---|---|---|
| KNR Constructions | ₹341.5 (14.94%) | ₹292.7 – ₹348.6 |
| Aditya Birla Fashion | ₹302.35 (13.92%) | ₹269.25 – ₹311.29 |
| Vodafone Idea | ₹14.95 (13.25%) | ₹13.3 – ₹15.05 |
| Varroc Engineering | ₹578.4 (12.77%) | ₹503.75 – ₹590 |
| Prestige Estates Projects | ₹1,704.59 (12.75%) | ₹1,388.55 – ₹1,735.59 |
Nifty 500 Top Losers
| Stock | Close | Range |
|---|---|---|
| Bharat Dynamics | ₹1,302.94 (-9.32%) | ₹1,293.19 – ₹1,386.94 |
| Cochin Shipyard | ₹1685 (-7%) | ₹1,630.55 – ₹1770 |
| Data Patterns | ₹2,485.75 (-5.05%) | ₹2,425.64 – ₹2,691.55 |
| Sterling and Wilson Solar | ₹665.04 (-5%) | ₹665.04 – ₹665.04 |
| Thermax | ₹5,020.14 (-4.88%) | ₹4,968.85 – ₹5428 |
Nifty 51 to 500 Stocks To Watch for Tomorrow
➲ Krishna Institute of Medical Sciences (Bullish Pattern)
- Performance Overview: In the last 26 trading sessions, Krishna Institute of Medical Sciences has closed in green 13 times and in red 13 times.
- Recent Trend: Krishna Institute of Medical Sciences has been on a 5-day green streak, without a single day closing in red since Wed 29 May 2024.
- Returns: Krishna Institute of Medical Sciences gave a -6.86% returns in the last 26 trading sessions, that means your investment of ₹10,000 would have become ₹9,314
- Financial Insight: Over the past 12 months, Krishna Institute of Medical Sciences has generated a renvenue of ₹2,498.14 Crore and created a profit of ₹310.14 Crore.
- As of Wed 05 Jun 2024, Krishna Institute of Medical Sciences has a Market Capital of ₹14,619.88 Crore.
- Summary: Krishna Institute of Medical Sciences exhibits a robust bullish pattern. Investors should monitor its price movements targets for both short-term and long-term growth prospects: Checkout Krishna Institute of Medical Sciences Target for Tomorrow and Krishna Institute of Medical Sciences Targets for 2024 & 2025.
Krishna Institute of Medical Sciences Financial Performance
| Metric | Value | Description |
|---|---|---|
| Market Capital | 14,619.88 Crore | Market valuation of Krishna Institute of Medical Sciences’s shares. |
| Revenue (TTM) | 2,498.14 Crore | Total revenue generated by Krishna Institute of Medical Sciences over the past twelve months. |
| Net Income (TTM) | +310.14 Crore | Net Profit or Loss after all the expenses over the past twelve months. |
| Operating Margin | 17.77% | Income from operations as a percentage of revenue, before taxes and interest. |
| Profit Margin | 12.41% | Net income as a percentage of revenue, after all expenses. |
| Revenue Growth (Quarterly) | +10% | Change in revenue compared to the previous quarter. |
| Earnings Growth (YOY Quarterly) | -29.8% | Change in earnings compared to the same quarter last year. |
| Debt-to-Equity (D/E) Ratio | 64.74 | Company’s total debt divided by total shareholder equity. |
| Total Debt | 1,355.32 Crore | Sum of Krishna Institute of Medical Sciences’s current & long-term financial obligations. |
| Total Cash | 131.98 Crore | Total amount of liquid funds available to Krishna Institute of Medical Sciences. |
| Beta | -0.25 | Beta is less than 1 indicating that the Krishna Institute of Medical Sciences’s price is less volatile than the market. |
➲ GMM Pfaudler (Bearish Pattern)
- Performance Overview: In the past 26 trading sessions, GMM Pfaudler has closed in red 18 times and in green 8 times, indicating a bearish trend.
- Recent Trend: GMM Pfaudler has been on a 7-day red streak, without a single day closing in green since Mon 27 May 2024.
- Returns: Investors who invested ₹10,000 in GMM Pfaudler 26 trading sessions ago would have seen their investment decline to ₹8,247, a loss of -17.53%.
- Financial Insight: Over the past 12 months, GMM Pfaudler has generated a revenue of ₹3,571.7 Crore and a profit of ₹196.25 Crore.
- As of Wed 05 Jun 2024, GMM Pfaudler has a Market Capitalization of ₹5,549.3 Crore.
- Summary: Given the recent bearish trend and weak financial performance, investors should exercise caution and monitor GMM Pfaudler’s performance closely, particularly GMM Pfaudler Target for Tomorrow and GMM Pfaudler Targets for 2024 & 2025.
GMM Pfaudler Financial Performance
| Metric | Value | Description |
|---|---|---|
| Market Capital | 5,549.3 Crore | Market valuation of GMM Pfaudler’s shares. |
| Revenue (TTM) | 3,571.7 Crore | Total revenue generated by GMM Pfaudler over the past twelve months. |
| Net Income (TTM) | +196.25 Crore | Net Profit or Loss after all the expenses over the past twelve months. |
| Operating Margin | 9.48% | Income from operations as a percentage of revenue, before taxes and interest. |
| Profit Margin | 5.49% | Net income as a percentage of revenue, after all expenses. |
| Revenue Growth (Quarterly) | +8% | Change in revenue compared to the previous quarter. |
| Earnings Growth (YOY Quarterly) | +69.89% | Change in earnings compared to the same quarter last year. |
| Debt-to-Equity (D/E) Ratio | 104.6 | Company’s total debt divided by total shareholder equity. |
| Total Debt | 984.88 Crore | Sum of GMM Pfaudler’s current & long-term financial obligations. |
| Total Cash | 306.16 Crore | Total amount of liquid funds available to GMM Pfaudler. |
| Beta | 0.12 | Beta is less than 1 indicating that the GMM Pfaudler’s price is less volatile than the market. |
Top Stocks That Created a New All Time High Today
Top Large Cap Stocks That Created a New All Time High Today
Companies with Market Capital more than 20,000 Crores| Stock | Close | New All-Time High (ATH) | Previous ATH | Previous ATH Date |
|---|---|---|---|---|
| Aurobindo Pharma | 1262.80 (+5.46%) | 1274.55 (+%) | Thu 01 Jan 1970 | |
| Bajaj Auto | 9563.59 (+2.91%) | 9677.25 (+%) | Thu 01 Jan 1970 | |
| Britannia | 5461.00 (+2.55%) | 5725.00 (+%) | Thu 01 Jan 1970 | |
| Colgate Palmolive | 2950.50 (+5%) | 3069.05 (+9.02%) | 2814.89 | Wed 03 Apr 2024 |
| Coromandel International | 1367.75 (+4.8%) | 1384.69 (+%) | Thu 01 Jan 1970 |
Top Mid Cap Stocks That Created a New All Time High Today
Companies with Market Capital between 5,000 Crores to 20,000 Crores| Stock | Close | New All-Time High (ATH) | Previous ATH | Previous ATH Date |
|---|---|---|---|---|
| BECTORFOOD | 1418.05 (+11.88%) | 1436.90 (+%) | Thu 01 Jan 1970 | |
| Bikaji Foods | 636.40 (+9.99%) | 636.40 (+%) | Thu 01 Jan 1970 | |
| E.I.D. Parry | 692.59 (+6.88%) | 724.95 (+%) | Thu 01 Jan 1970 | |
| Finolex Industries/Pipe | 341.50 (+5.84%) | 348.95 (+31.78%) | 264.79 | Thu 04 Apr 2024 |
| Redtape | 774.40 (+7.67%) | 781.00 (+6.03%) | 736.54 | Tue 09 Apr 2024 |
Top Small Cap Stocks That Created a New All Time High Today
Companies with Market Capital less than 5,000 Crores| Stock | Close | New All-Time High (ATH) | Previous ATH | Previous ATH Date |
|---|---|---|---|---|
| Ace Software Exports | 221.85 (+2%) | 221.85 (+47.62%) | 150.28 | Mon 01 Apr 2024 |
| Ahmedabad Steelcraft | 75.28 (+1.99%) | 75.28 (+%) | Thu 01 Jan 1970 | |
| E2E Networks | 1510.50 (+4.99%) | 1510.50 (+31.22%) | 1151.09 | Wed 24 Apr 2024 |
| Everlon Synthetics | 116.45 (+6.93%) | 116.65 (+%) | Thu 01 Jan 1970 | |
| GSL Securities | 16.14 (+4.93%) | 16.14 (+%) | Thu 01 Jan 1970 |