Home / Mon 13 May 2024 Market Recap
13 May 2024: Nifty at ₹22,104.05 Rose Slightly By 0.22% as Bajaj Auto, Tech Mahindra Post Contrasting Performances
Show Table of Contents
Table of Contents
- 1: Top Indices Performance Overview
- 2: Nifty 50 Performance Overview
- 2.1: Nifty 50 Top Gainers
- 2.2: Nifty 50 Top Losers
- 2.3: Nifty 50 Stocks To Watch for Tomorrow
- 2.3.1: ➲ Bajaj Auto (Bullish Pattern)
- 2.3.2: ➲ Tech Mahindra (Bearish Pattern)
- 3: Nifty 500 Performance Overview
- 3.1: Nifty 500 Top Gainers
- 3.2: Nifty 500 Top Losers
- 3.3: Nifty 51 to 500 Stocks To Watch for Tomorrow
- 3.3.1: ➲ PI Industries (Bullish Pattern)
- 3.3.2: ➲ Nuvoco Vistas Corporation (Bearish Pattern)
- 4: Top Stocks That Created a New All Time High Today
- 4.1: Top Large Cap Stocks That Created a New All Time High Today
- 4.2: Top Mid Cap Stocks That Created a New All Time High Today
- 4.3: Top Small Cap Stocks That Created a New All Time High Today
Top Indices Performance Overview
| Stock | Close | Range |
|---|---|---|
| NIFTY 50 | ₹22,104.05 (0.22%) | ₹21,821.05 – ₹22,131.65 |
| NIFTY BANK | ₹47,754.1 (0.66%) | ₹46,983.25 – ₹47,841.6 |
| NIFTY FIN SERVICE | ₹21,259.5 (0.72%) | ₹20,934.59 – ₹21,287.69 |
| NIFTY IT | ₹33,087.94 (0.42%) | ₹32,669.25 – ₹33,107.8 |
| NIFTY AUTO | ₹22459 (-1.71%) | ₹22,128.59 – ₹22725 |
| NIFTY ENERGY | ₹38880 (-0.5%) | ₹38,138.8 – ₹39,138.89 |
Nifty 50 Performance Overview
Nifty 50 started Thursday at ₹22,027.94. It oscillated between a low of ₹21,821.05 and a high of ₹22,131.65. The index closed the day at ₹22,104.05, a marginal gain of 0.22%.
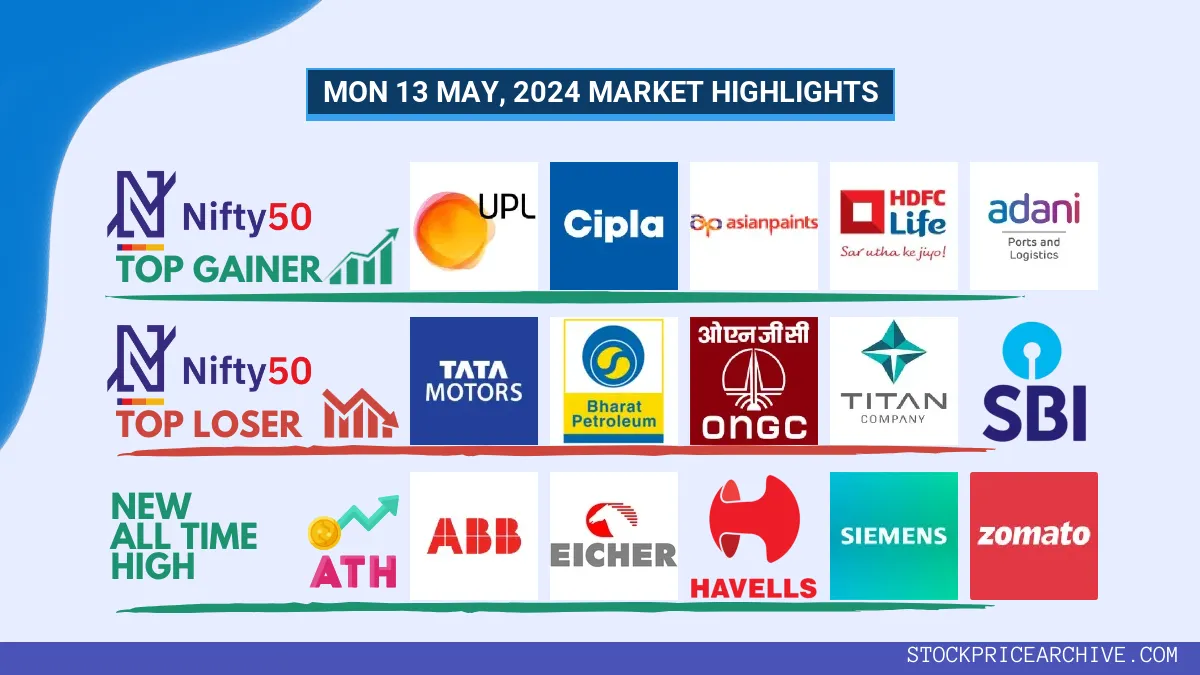
Nifty 50 Top Gainers
| Stock | Close | Range |
|---|---|---|
| UPL | ₹534.09 (6.56%) | ₹502.45 – ₹540 |
| Cipla | ₹1,420.94 (6.04%) | ₹1,371.05 – ₹1425 |
| Asian Paints | ₹2,874.75 (3.78%) | ₹2,754.69 – ₹2,894.85 |
| HDFC Life | ₹568.45 (3.47%) | ₹548.29 – ₹568.45 |
| Adani Ports | ₹1,307.69 (2.96%) | ₹1,261.65 – ₹1,312.65 |
Nifty 50 Top Losers
| Stock | Close | Range |
|---|---|---|
| Tata Motors | ₹959.75 (-8.36%) | ₹947.2 – ₹1,008.7 |
| Bharat Petroleum | ₹608 (-1.74%) | ₹591.79 – ₹623.95 |
| ONGC | ₹266.89 (-1.14%) | ₹262.04 – ₹271.89 |
| TITAN | ₹3,253.64 (-1.1%) | ₹3,230.5 – ₹3308 |
| SBI | ₹808.79 (-1%) | ₹798.59 – ₹819.84 |
Nifty 50 Stocks To Watch for Tomorrow
➲ Bajaj Auto (Bullish Pattern)
- Movement Overview: Bajaj Auto has had a bustling trading period, with 12 green and 10 red closing days in the last 23 trading sessions.
- Current Trend: The company has been riding high with a 4-day green streak since Tuesday, May 7th, 2024.
- Returns Analysis: Over the past 23 trading sessions, Bajaj Auto has yielded a modest -0.56% return on investment. If you had invested ₹10,000, it would now be worth ₹9,944.
- Financial Insights: In the past year, Bajaj Auto has achieved remarkable financial results. They generated a healthy revenue of ₹46,306.44 Crore and an impressive profit of ₹7,708.24 Crore.
- As of Monday, May 13th, 2024, Bajaj Auto boasts a substantial Market Capital of ₹2,47,022.61 Crore.
- Investor Outlook: Bajaj Auto’s bullish pattern is an encouraging sign. Investors should stay tuned for price movement updates and consider the company’s growth prospects. Explore our detailed analysis: Bajaj Auto Target for Tomorrow and Bajaj Auto Targets for 2024 & 2025.
Bajaj Auto Financial Performance
| Metric | Value | Description |
|---|---|---|
| Market Capital | 2,47,022.61 Crore | Market valuation of Bajaj Auto’s shares. |
| Revenue (TTM) | 46,306.44 Crore | Total revenue generated by Bajaj Auto over the past twelve months. |
| Net Income (TTM) | +7,708.24 Crore | Net Profit or Loss after all the expenses over the past twelve months. |
| Operating Margin | 21.41% | Income from operations as a percentage of revenue, before taxes and interest. |
| Profit Margin | 16.64% | Net income as a percentage of revenue, after all expenses. |
| Revenue Growth (Quarterly) | +34.3% | Change in revenue compared to the previous quarter. |
| Earnings Growth (YOY Quarterly) | +18% | Change in earnings compared to the same quarter last year. |
| Debt-to-Equity (D/E) Ratio | 6.16 | Company’s total debt divided by total shareholder equity. |
| Total Debt | 1,785.9 Crore | Sum of Bajaj Auto’s current & long-term financial obligations. |
| Total Cash | 6,386.91 Crore | Total amount of liquid funds available to Bajaj Auto. |
| Beta | 0.9 | Beta is less than 1 indicating that the Bajaj Auto’s price is less volatile than the market. |
➲ Tech Mahindra (Bearish Pattern)
- Performance Snapshot: Over the past 23 trading sessions, Tech Mahindra has closed in red 13 times and in green 10 times.
- Recent Trend: Tech Mahindra is on a 4-day losing streak, with no green days since Tuesday, May 7, 2024.
- Returns Analysis: In the last 23 trading sessions, Tech Mahindra has delivered a return of -0.63%, which means an investment of ₹10,000 would have decreased to ₹9,937 as of today.
- Financial Health: In the past year, Tech Mahindra has reported a revenue of ₹51,995.49 Crore and a profit of ₹2,357.79 Crore.
- As of Monday, May 13, 2024, Tech Mahindra has a Market Capitalization of ₹1,21,904.88 Crore.
- Outlook: Tech Mahindra is currently in a bearish phase. We recommend that investors monitor the stock closely, particularly by checking the Tech Mahindra Target for Tomorrow and Tech Mahindra Targets for 2024 & 2025.
Tech Mahindra Financial Performance
| Metric | Value | Description |
|---|---|---|
| Market Capital | 1,21,904.88 Crore | Market valuation of Tech Mahindra’s shares. |
| Revenue (TTM) | 51,995.49 Crore | Total revenue generated by Tech Mahindra over the past twelve months. |
| Net Income (TTM) | +2,357.79 Crore | Net Profit or Loss after all the expenses over the past twelve months. |
| Operating Margin | 7.35% | Income from operations as a percentage of revenue, before taxes and interest. |
| Profit Margin | 4.53% | Net income as a percentage of revenue, after all expenses. |
| Revenue Growth (Quarterly) | -6.2% | Change in revenue compared to the previous quarter. |
| Earnings Growth (YOY Quarterly) | -40.9% | Change in earnings compared to the same quarter last year. |
| Debt-to-Equity (D/E) Ratio | 9.34 | Company’s total debt divided by total shareholder equity. |
| Total Debt | 2,536.69 Crore | Sum of Tech Mahindra’s current & long-term financial obligations. |
| Total Cash | 7,514.9 Crore | Total amount of liquid funds available to Tech Mahindra. |
| Beta | 0.56 | Beta is less than 1 indicating that the Tech Mahindra’s price is less volatile than the market. |
Nifty 500 Performance Overview
The Nifty 500 began the trading day at ₹20,471.65. It fluctuated throughout the session, hitting a session low of ₹20,184.40 and a high of ₹20,539.84. The index closed the day at ₹20,529.18, marking a +0.26% increase from the opening price.
Nifty 500 Top Gainers
| Stock | Close | Range |
|---|---|---|
| BEML | ₹3,700.35 (15.34%) | ₹3255 – ₹3715 |
| ABB India | ₹8,019.95 (11.32%) | ₹7,429.14 – ₹8,019.95 |
| Hindustan Zinc | ₹572.04 (8.13%) | ₹506.79 – ₹585.7 |
| Hitachi Energy | ₹9,440.95 (7.55%) | ₹8,761.4 – ₹9,549.15 |
| Siemens | ₹6,620.1 (7.31%) | ₹6,218.54 – ₹6666 |
Nifty 500 Top Losers
| Stock | Close | Range |
|---|---|---|
| Syrma SGS Technology | ₹392.45 (-17.02%) | ₹386.29 – ₹475 |
| Bank of India | ₹124.6 (-10.2%) | ₹121.75 – ₹130.6 |
| Tata Motors DVR | ₹645.59 (-8.82%) | ₹638.09 – ₹688 |
| Tata Motors | ₹959.75 (-8.36%) | ₹947.2 – ₹1,008.7 |
| eClerx | ₹2,182.5 (-5.03%) | ₹2,151.3 – ₹2,328.39 |
Nifty 51 to 500 Stocks To Watch for Tomorrow
➲ PI Industries (Bullish Pattern)
- Performance Overview: In the last 23 trading sessions, PI Industries has closed up 9 times and down 14 times.
- Recent Trend: PI Industries has been on a 4-day green streak, without a single day closing down since Tuesday, May 7, 2024.
- Returns: PI Industries delivered a -6.19% return over the past 23 trading sessions, meaning an investment of ₹10,000 would now be worth ₹9,381
- Financial Snapshot: Over the past 12 months, PI Industries has generated a revenue of ₹7,490.4 Crore and created a profit of ₹1,592.5 Crore.
- As of Monday, May 13, 2024, PI Industries has a Market Capital of ₹53,160.46 Crore.
- Summary: PI Industries exhibits a strong bullish pattern. Investors should monitor its price movements targets for both short-term and long-term growth prospects: Checkout PI Industries Target for Tomorrow and PI Industries Targets for 2024 & 2025.
PI Industries Financial Performance
| Metric | Value | Description |
|---|---|---|
| Market Capital | 53,160.46 Crore | Market valuation of PI Industries’s shares. |
| Revenue (TTM) | 7,490.4 Crore | Total revenue generated by PI Industries over the past twelve months. |
| Net Income (TTM) | +1,592.5 Crore | Net Profit or Loss after all the expenses over the past twelve months. |
| Operating Margin | 25.04% | Income from operations as a percentage of revenue, before taxes and interest. |
| Profit Margin | 21.26% | Net income as a percentage of revenue, after all expenses. |
| Revenue Growth (Quarterly) | +17.59% | Change in revenue compared to the previous quarter. |
| Earnings Growth (YOY Quarterly) | +27.5% | Change in earnings compared to the same quarter last year. |
| Debt-to-Equity (D/E) Ratio | 2.26 | Company’s total debt divided by total shareholder equity. |
| Total Debt | 180.89 Crore | Sum of PI Industries’s current & long-term financial obligations. |
| Total Cash | 2,955.6 Crore | Total amount of liquid funds available to PI Industries. |
| Beta | 0.62 | Beta is less than 1 indicating that the PI Industries’s price is less volatile than the market. |
➲ Nuvoco Vistas Corporation (Bearish Pattern)
- Performance Overview: In the last 23 trading sessions, Nuvoco Vistas Corporation has closed in red 15 times and in green 8 times.
- Recent Trend: Nuvoco Vistas Corporation has been on a 12-day red streak, without a single day closing in green since Wed 24 Apr 2024.
- Returns: Nuvoco Vistas Corporation gave a -2.82% returns in the last 23 trading sessions, that means your investment of ₹10,000 would have become ₹9,718
- Financial Insight: Over the past 12 months, PI Industries has generated a revenue of ₹10,732.88 Crore and created a profit of ₹147.36 Crore.
- As of Mon 13 May 2024, PI Industries has a Market Capital of ₹11,164.69 Crore.
- Summary: Nuvoco Vistas Corporation is currently experiencing a bearish phase. We advise investors to keep a close watch, especially on Nuvoco Vistas Corporation Target for Tomorrow and Nuvoco Vistas Corporation Targets for 2024 & 2025.
Nuvoco Vistas Corporation Financial Performance
| Metric | Value | Description |
|---|---|---|
| Market Capital | 11,164.69 Crore | Market valuation of Nuvoco Vistas Corporation’s shares. |
| Revenue (TTM) | 10,732.88 Crore | Total revenue generated by Nuvoco Vistas Corporation over the past twelve months. |
| Net Income (TTM) | +147.36 Crore | Net Profit or Loss after all the expenses over the past twelve months. |
| Operating Margin | 9.29% | Income from operations as a percentage of revenue, before taxes and interest. |
| Profit Margin | 1.37% | Net income as a percentage of revenue, after all expenses. |
| Revenue Growth (Quarterly) | +0.2% | Change in revenue compared to the previous quarter. |
| Earnings Growth (YOY Quarterly) | -50.1% | Change in earnings compared to the same quarter last year. |
| Debt-to-Equity (D/E) Ratio | 49.02 | Company’s total debt divided by total shareholder equity. |
| Total Debt | 4,403.73 Crore | Sum of Nuvoco Vistas Corporation’s current & long-term financial obligations. |
| Total Cash | 106.98 Crore | Total amount of liquid funds available to Nuvoco Vistas Corporation. |
Top Stocks That Created a New All Time High Today
Top Large Cap Stocks That Created a New All Time High Today
Companies with Market Capital more than 20,000 Crores| Stock | Close | New All-Time High (ATH) | Previous ATH | Previous ATH Date |
|---|---|---|---|---|
| ABB India | 8019.95 (+11.72%) | 8019.95 (+18.85%) | 6747.89 | Mon 08 Apr 2024 |
| Aurobindo Pharma | 1180.75 (+4.71%) | 1184.69 (+%) | Thu 01 Jan 1970 | |
| CG Power | 585.29 (+0.91%) | 601.00 (+%) | Thu 01 Jan 1970 | |
| Cummins India | 3504.89 (+2.72%) | 3525.00 (+8.03%) | 3262.80 | Wed 24 Apr 2024 |
| Eicher Motors | 4675.79 (+0.38%) | 4713.00 (+3.09%) | 4571.64 | Wed 24 Apr 2024 |
Top Mid Cap Stocks That Created a New All Time High Today
Companies with Market Capital between 5,000 Crores to 20,000 Crores| Stock | Close | New All-Time High (ATH) | Previous ATH | Previous ATH Date |
|---|---|---|---|---|
| CEBBCO | 482.39 (-0.44%) | 506.04 (+16.65%) | 433.80 | Mon 01 Jan 2024 |
| Jupiter Wagons | 483.00 (-1.14%) | 506.54 (+16.71%) | 434.00 | Tue 23 Jan 2024 |
| Netweb Technologies | 2055.89 (+4.89%) | 2058.00 (+%) | Thu 01 Jan 1970 | |
| Tejas Networks | 1199.84 (+7.18%) | 1219.00 (+12.01%) | 1088.25 | Tue 23 Apr 2024 |
| TVS Holdings | 10503.95 (+3.02%) | 10745.00 (+%) | Thu 01 Jan 1970 |
Top Small Cap Stocks That Created a New All Time High Today
Companies with Market Capital less than 5,000 Crores| Stock | Close | New All-Time High (ATH) | Previous ATH | Previous ATH Date |
|---|---|---|---|---|
| ABIRAFN | 85.02 (+4.98%) | 85.02 (+70.82%) | 49.77 | Thu 25 Apr 2024 |
| Ace Software Exports | 165.14 (+1.97%) | 165.15 (+9.89%) | 150.28 | Mon 01 Apr 2024 |
| Allsec Technologies | 1032.34 (+5.1%) | 1045.00 (+%) | Thu 01 Jan 1970 | |
| Avasara Finance | 28.25 (+4.97%) | 28.25 (+%) | Thu 01 Jan 1970 | |
| BALUFORGE | 302.00 (+1.13%) | 308.04 (+%) | Thu 01 Jan 1970 |