Home / Fri 12 Jul 2024 Market Recap
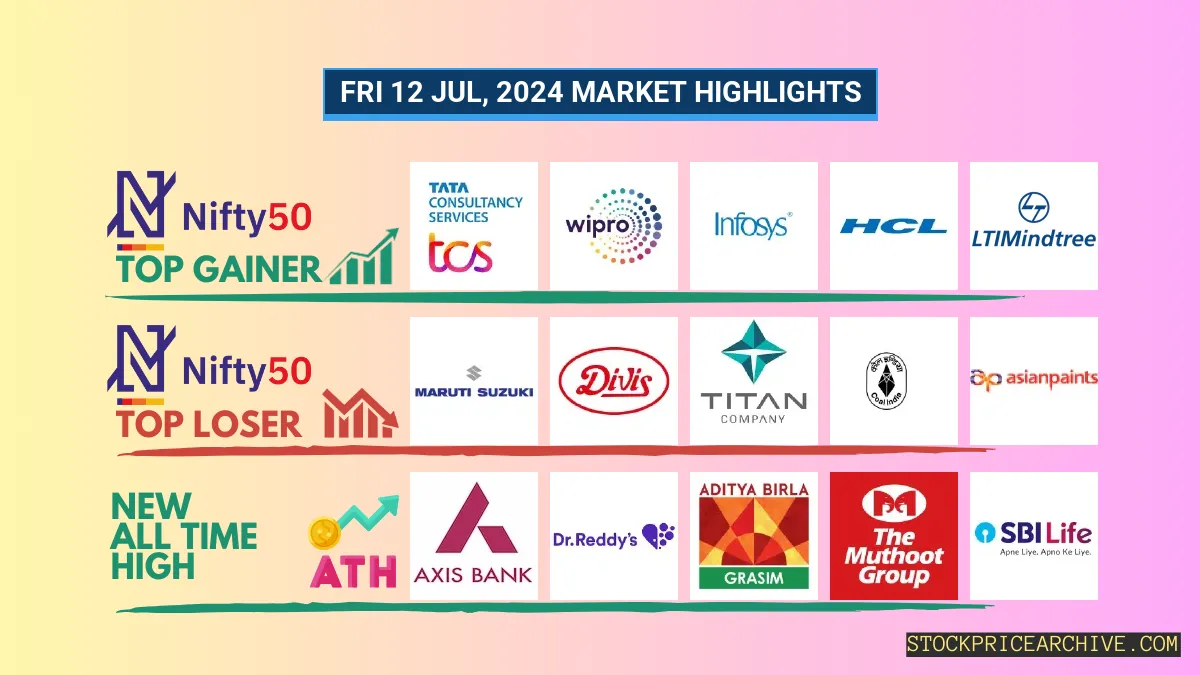
12 Jul 2024: Nifty closed at ₹24,512.4 (+0.8%), with Dr Reddy Lab soaring to new All Time Highs. Adani Enterprises shows bearish trend.
Show Table of Contents
Table of Contents
- 1: Top Indices Performance Overview
- 2: Nifty 50 Performance Overview
- 2.1: Nifty 50 Top Gainers
- 2.2: Nifty 50 Top Losers
- 2.3: Nifty 50 Stocks To Watch for Tomorrow
- 2.3.1: Dr Reddy Lab Share Price History: A Bullish Outlook
- 2.3.2: ➲ Adani Enterprises (Showing a Bearish Trend)
- 3: Nifty 500 Performance Overview
- 3.1: Nifty 500 Top Gainers
- 3.2: Nifty 500 Top Losers
- 3.3: Nifty 51 to 500 Stocks To Watch for Tomorrow
- 3.3.1: Deepak Nitrite: A Bullish Story Unfolding
- 3.3.2: ➲ Aditya Birla Capital (Bearish Pattern)
- 4: Top Stocks That Created a New All Time High Today
- 4.1: Top Large Cap Stocks That Created a New All Time High Today
- 4.2: Top Mid Cap Stocks That Created a New All Time High Today
- 4.3: Top Small Cap Stocks That Created a New All Time High Today
Top Indices Performance Overview
| Stock | Close | Range |
|---|---|---|
| NIFTY 50 | ₹24,512.4 (0.8%) | ₹24,331.15 – ₹24,592.19 |
| NIFTY BANK | ₹52,339.5 (0.13%) | ₹52,171.14 – ₹52,794.55 |
| NIFTY FIN SERVICE | ₹23,630.9 (0.13%) | ₹23,553.09 – ₹23,819.59 |
| NIFTY IT | ₹39023 (4.52%) | ₹37,825.25 – ₹39,237.69 |
| NIFTY AUTO | ₹25,145.44 (-0.45%) | ₹25,102.4 – ₹25,301.4 |
| NIFTY ENERGY | ₹42,846.35 (0.2%) | ₹42,570.44 – ₹43,136.94 |
Nifty 50 Performance Overview
The Nifty 50 started the day at ₹24,385.5, showing some movement throughout the session. It dipped to a low of ₹24,331.15 before climbing to a high of ₹24,592.19. The index ultimately closed at ₹24,512.4, ending the day with a +0.8% gain.
This movement was influenced by the day’s top gainers and losers, which you can see in the table below.
Nifty 50 Top Gainers
| Stock | Close | Range |
|---|---|---|
| TCS | ₹4,180.85 (6.55%) | ₹3,971.3 – ₹4,199.95 |
| WIPRO | ₹558.5 (4.57%) | ₹541.54 – ₹564.79 |
| Infosys | ₹1,706.34 (3.24%) | ₹1,666.65 – ₹1,719.75 |
| HCL | ₹1,560.19 (3.19%) | ₹1,510.5 – ₹1566 |
| LTIMindtree | ₹5,572.64 (3.05%) | ₹5,470.1 – ₹5,659.7 |
Nifty 50 Top Losers
| Stock | Close | Range |
|---|---|---|
| Maruti Suzuki | ₹12567 (-1.17%) | ₹12475 – ₹12,669.9 |
| Divis Lab | ₹4,539.29 (-0.95%) | ₹4,485.29 – ₹4,594.6 |
| TITAN | ₹3221 (-0.85%) | ₹3,220.05 – ₹3269 |
| Coal India | ₹496.2 (-0.77%) | ₹495.5 – ₹508.6 |
| Asian Paints | ₹2,999.14 (-0.76%) | ₹2,970.89 – ₹3052 |
Nifty 50 Stocks To Watch for Tomorrow
Dr Reddy Lab Share Price History: A Bullish Outlook
- Performance Overview: In the last 26 trading sessions (ending Friday, July 12th, 2024), Dr Reddy Lab has closed higher 20 times and lower 6 times. This suggests a positive momentum in the stock.
- Recent Trend: Dr Reddy Lab has been on a remarkable 9-day winning streak! It hasn’t closed in the red since Monday, July 1st, 2024. This continuous upward movement is a clear indicator of bullish sentiment.
- Returns: During this period, Dr Reddy Lab delivered a solid 15.15% return. Imagine investing ₹10,000; it would have grown to ₹11,515! This impressive performance highlights the stock’s potential.
- Financial Insight: Over the past year, Dr Reddy Lab generated a revenue of ₹27,916.39 Crore, demonstrating its strong financial performance. The company also achieved a profit of ₹5,568.4 Crore, signaling its profitability.
- As of Friday, July 12th, 2024, Dr Reddy Lab has a market capitalization of ₹1,08,632.32 Crore. This substantial market cap reflects the company’s size and prominence in the market.
- Summary: Dr Reddy Lab is currently exhibiting a robust bullish pattern, suggesting a positive outlook. Investors should monitor its price movements carefully. We’ve compiled resources to help you evaluate both short-term and long-term growth prospects: Checkout Dr Reddy Lab Target for Tomorrow and Dr Reddy Lab Targets for 2024 & 2025.
Dr Reddy Lab Financial Performance
| Metric | Value | Description |
|---|---|---|
| Market Capital | 1,08,632.32 Crore | Market valuation of Dr Reddy Lab’s shares. |
| Revenue (TTM) | 27,916.39 Crore | Total revenue generated by Dr Reddy Lab over the past twelve months. |
| Net Income (TTM) | +5,568.4 Crore | Net Profit or Loss after all the expenses over the past twelve months. |
| Operating Margin | 18.31% | Income from operations as a percentage of revenue, before taxes and interest. |
| Profit Margin | 19.94% | Net income as a percentage of revenue, after all expenses. |
| Revenue Growth (Quarterly) | +12.5% | Change in revenue compared to the previous quarter. |
| Earnings Growth (YOY Quarterly) | +36.29% | Change in earnings compared to the same quarter last year. |
| Debt-to-Equity (D/E) Ratio | 7.13 | Company’s total debt divided by total shareholder equity. |
| Total Debt | 2,002 Crore | Sum of Dr Reddy Lab’s current & long-term financial obligations. |
| Total Cash | 8,146.99 Crore | Total amount of liquid funds available to Dr Reddy Lab. |
| Beta | 0.34 | Beta is less than 1 indicating that the Dr Reddy Lab’s price is less volatile than the market. |
➲ Adani Enterprises (Showing a Bearish Trend)
- Recent Performance: Over the last 26 trading days, Adani Enterprises has closed lower 13 times and higher 13 times. It’s been a bit of a mixed bag lately.
- Short-Term Trend: Adani Enterprises has had a bit of a tough run, closing lower for the past 5 trading days, with the last green close on Friday, July 5th, 2024.
- Returns in Focus: During this 26-day period, Adani Enterprises has shown a -3.73% return. This means that if you’d invested ₹10,000, your investment would be worth ₹9,627 today.
- Financial Snapshot: Looking at the past year, Adani Enterprises has generated a revenue of ₹96,420.98 Crore and recorded a profit of ₹3,104.19 Crore.
- As of Friday, July 12th, 2024, Adani Enterprises has a Market Capital of ₹3,58,860.58 Crore.
- What’s Next? Adani Enterprises is currently experiencing a bearish phase. Keep a close eye on its performance as we move forward. You might want to check out Adani Enterprises’ Target for Tomorrow and Adani Enterprises’ Price Targets for 2024 & 2025 for more insights.
Adani Enterprises Financial Performance
| Metric | Value | Description |
|---|---|---|
| Market Capital | 3,58,860.58 Crore | Market valuation of Adani Enterprises’s shares. |
| Revenue (TTM) | 96,420.98 Crore | Total revenue generated by Adani Enterprises over the past twelve months. |
| Net Income (TTM) | +3,104.19 Crore | Net Profit or Loss after all the expenses over the past twelve months. |
| Operating Margin | 8.76% | Income from operations as a percentage of revenue, before taxes and interest. |
| Profit Margin | 3.36% | Net income as a percentage of revenue, after all expenses. |
| Revenue Growth (Quarterly) | -6.9% | Change in revenue compared to the previous quarter. |
| Earnings Growth (YOY Quarterly) | -37.6% | Change in earnings compared to the same quarter last year. |
| Debt-to-Equity (D/E) Ratio | 147.8 | Company’s total debt divided by total shareholder equity. |
| Total Debt | 65,310.14 Crore | Sum of Adani Enterprises’s current & long-term financial obligations. |
| Total Cash | 4,380.95 Crore | Total amount of liquid funds available to Adani Enterprises. |
| Beta | 0.93 | Beta is less than 1 indicating that the Adani Enterprises’s price is less volatile than the market. |
Nifty 500 Performance Overview
The Nifty 500 opened the day at ₹23,086.25. It went on a bit of a roller coaster ride, hitting a low of ₹23,021.4 and reaching a high of ₹23,189.4 before finally closing at ₹23,095.44, ending the day up 0.39%.
Nifty 500 Top Gainers
| Stock | Close | Range |
|---|---|---|
| Sonata Software | ₹691.15 (10.66%) | ₹628 – ₹740 |
| KPIT Technologies | ₹1,861.94 (8.89%) | ₹1,702.9 – ₹1,928.69 |
| Oil India | ₹594.7 (7.93%) | ₹562 – ₹653 |
| Coforge | ₹5,977.64 (7.44%) | ₹5,632.04 – ₹6040 |
| Zensar Technolgies | ₹767 (6.81%) | ₹720.54 – ₹788 |
Nifty 500 Top Losers
| Stock | Close | Range |
|---|---|---|
| Macrotech Developers | ₹1,389.3 (-5.64%) | ₹1,387.9 – ₹1,479.84 |
| Indian Oil | ₹167.23 (-4.14%) | ₹166.11 – ₹169.25 |
| RHI MAGNESITA | ₹575 (-4.06%) | ₹574.25 – ₹606.29 |
| Delta Corp | ₹140.16 (-4.04%) | ₹139.21 – ₹144.97 |
| Hitachi Energy | ₹12200 (-3.8%) | ₹12150 – ₹12990 |
Nifty 51 to 500 Stocks To Watch for Tomorrow
Deepak Nitrite: A Bullish Story Unfolding
- Performance Snapshot: Over the past 26 trading sessions, Deepak Nitrite has closed higher on 21 days, demonstrating a strong upward trend.
- Recent Momentum: Deepak Nitrite has been on a roll, closing higher for the last seven consecutive trading days, starting from Wednesday, July 3, 2024.
- Returns in Focus: In these 26 sessions, Deepak Nitrite delivered a healthy 23.42% return. This means an investment of ₹10,000 would have grown to ₹12,342.
- Financial Foundation: Over the past year, Deepak Nitrite has generated a robust ₹7,681.83 Crore in revenue and a commendable ₹810.9 Crore in profit.
- Market Position: As of Friday, July 12, 2024, Deepak Nitrite boasts a market capitalization of ₹36,661.05 Crore, signifying its substantial presence in the market.
- Looking Ahead: Deepak Nitrite paints a bullish picture, indicating potential for both short-term and long-term growth. To explore potential targets for tomorrow and beyond, check out: Deepak Nitrite Target for Tomorrow and Deepak Nitrite Targets for 2024 & 2025.
Deepak Nitrite Financial Performance
| Metric | Value | Description |
|---|---|---|
| Market Capital | 36,661.05 Crore | Market valuation of Deepak Nitrite’s shares. |
| Revenue (TTM) | 7,681.83 Crore | Total revenue generated by Deepak Nitrite over the past twelve months. |
| Net Income (TTM) | +810.9 Crore | Net Profit or Loss after all the expenses over the past twelve months. |
| Operating Margin | 11.97% | Income from operations as a percentage of revenue, before taxes and interest. |
| Profit Margin | 10.55% | Net income as a percentage of revenue, after all expenses. |
| Revenue Growth (Quarterly) | +8.4% | Change in revenue compared to the previous quarter. |
| Earnings Growth (YOY Quarterly) | +8.6% | Change in earnings compared to the same quarter last year. |
| Debt-to-Equity (D/E) Ratio | 5.93 | Company’s total debt divided by total shareholder equity. |
| Total Debt | 286.08 Crore | Sum of Deepak Nitrite’s current & long-term financial obligations. |
| Total Cash | 584.61 Crore | Total amount of liquid funds available to Deepak Nitrite. |
| Beta | 0.57 | Beta is less than 1 indicating that the Deepak Nitrite’s price is less volatile than the market. |
➲ Aditya Birla Capital (Bearish Pattern)
- Performance Overview: Over the past 26 trading days, Aditya Birla Capital has closed lower 13 times and higher 13 times.
- Recent Trend: Aditya Birla Capital has experienced a 7-day downward trend, closing lower every day since Wednesday, July 3, 2024.
- Returns: Aditya Birla Capital has generated a 3.38% return in the last 26 trading sessions. This means that an investment of ₹10,000 would have grown to ₹10,338.
- Financial Insight: Over the past 12 months, Aditya Birla Capital has generated revenue of ₹25,591.03 Crore and generated a profit of ₹3,334.97 Crore.
- As of Friday, July 12, 2024, Aditya Birla Capital has a Market Capital of ₹61,363.06 Crore.
- Summary: Aditya Birla Capital is currently showing a bearish pattern. We recommend keeping a close eye on its performance, especially in the coming days. You can find potential targets for tomorrow and for the rest of 2024 and 2025 by clicking on the links below. Aditya Birla Capital Target for Tomorrow and Aditya Birla Capital Targets for 2024 & 2025.
Aditya Birla Capital Financial Performance
| Metric | Value | Description |
|---|---|---|
| Market Capital | 61,363.06 Crore | Market valuation of Aditya Birla Capital’s shares. |
| Revenue (TTM) | 25,591.03 Crore | Total revenue generated by Aditya Birla Capital over the past twelve months. |
| Net Income (TTM) | +3,334.97 Crore | Net Profit or Loss after all the expenses over the past twelve months. |
| Operating Margin | 17.29% | Income from operations as a percentage of revenue, before taxes and interest. |
| Profit Margin | 13.03% | Net income as a percentage of revenue, after all expenses. |
| Revenue Growth (Quarterly) | +33.8% | Change in revenue compared to the previous quarter. |
| Earnings Growth (YOY Quarterly) | +104.6% | Change in earnings compared to the same quarter last year. |
| Debt-to-Equity (D/E) Ratio | 384.93 | Company’s total debt divided by total shareholder equity. |
| Total Debt | 1,10,236.83 Crore | Sum of Aditya Birla Capital’s current & long-term financial obligations. |
| Total Cash | 3,939.16 Crore | Total amount of liquid funds available to Aditya Birla Capital. |
| Beta | 1.04 | Beta is greater than 1 indicating that the Aditya Birla Capital’s price is more volatile than the market. |
Top Stocks That Created a New All Time High Today
Top Large Cap Stocks That Created a New All Time High Today
Companies with Market Capital more than 20,000 Crores| Stock | Close | New All-Time High (ATH) | Previous ATH | Previous ATH Date |
|---|---|---|---|---|
| Axis Bank | 1317.30 (+1.58%) | 1339.65 (+%) | Thu 01 Jan 1970 | |
| Dr Reddy Lab | 6719.45 (+1.89%) | 6745.00 (+%) | Thu 01 Jan 1970 | |
| Federal Bank | 195.48 (+1.46%) | 197.19 (+%) | Thu 01 Jan 1970 | |
| GRASIM | 2843.75 (+1.5%) | 2850.00 (+19.94%) | 2376.00 | Tue 23 Apr 2024 |
| Housing & Urban Development Corp | 334.95 (-2.12%) | 353.70 (+%) | Thu 01 Jan 1970 |
Top Mid Cap Stocks That Created a New All Time High Today
Companies with Market Capital between 5,000 Crores to 20,000 Crores| Stock | Close | New All-Time High (ATH) | Previous ATH | Previous ATH Date |
|---|---|---|---|---|
| CMS Info Systems | 533.40 (+1.15%) | 536.90 (+%) | Thu 01 Jan 1970 | |
| Engineers India | 287.95 (-0.8%) | 303.89 (+%) | Thu 01 Jan 1970 | |
| GMR Power And Urban Infra | 103.15 (+4.99%) | 103.15 (+%) | Thu 01 Jan 1970 | |
| Isgec Heavy Engineering | 1500.34 (+3.47%) | 1523.05 (+%) | Thu 01 Jan 1970 | |
| Manappuram Finance | 224.85 (+5.68%) | 225.39 (+%) | Thu 01 Jan 1970 |
Top Small Cap Stocks That Created a New All Time High Today
Companies with Market Capital less than 5,000 Crores| Stock | Close | New All-Time High (ATH) | Previous ATH | Previous ATH Date |
|---|---|---|---|---|
| 21ST CENTURY MANAG | 81.09 (+1.99%) | 81.09 (+%) | Thu 01 Jan 1970 | |
| Ace Software Exports | 291.04 (+1.99%) | 291.04 (+93.66%) | 150.28 | Mon 01 Apr 2024 |
| Ahmedabad Steelcraft | 125.60 (+1.98%) | 125.60 (+%) | Thu 01 Jan 1970 | |
| Almondz Global Securities | 158.78 (+4.99%) | 158.78 (+%) | Thu 01 Jan 1970 | |
| AMJ Land Holdings | 57.05 (+14.78%) | 59.64 (+%) | Thu 01 Jan 1970 |


