Home / Mon 08 Jul 2024 Market Recap
08 Jul 2024: Nifty closed at ₹24,331.05 (+0.02%), with Coal India showing bullish momentum. RVNL Jumped +15.46% & Paytm Jumped +8.34% Today

Show Table of Contents
Table of Contents
- 1: Top Indices Performance Overview
- 2: Nifty 50 Performance Overview
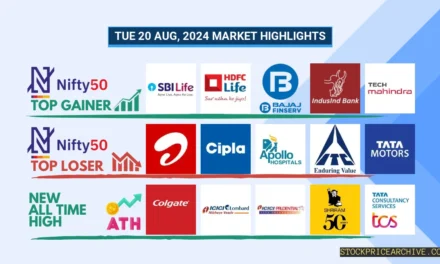
- 2.1: Nifty 50 Top Gainers
- 2.2: Nifty 50 Top Losers
- 2.3: Nifty 50 Stocks To Watch for Tomorrow
- 2.3.1: Coal India (Bullish Pattern)
- 2.3.2: ➲ TITAN (Bearish Pattern)
- 3: Nifty 500 Performance Overview
- 3.1: Nifty 500 Top Gainers
- 3.2: Nifty 500 Top Losers
- 3.3: Nifty 51 to 500 Stocks To Watch for Tomorrow
- 3.3.1: Narayana Hrudayalaya: A Bullish Outlook
- 3.3.2: ➲ Apollo Tyres (Bearish Pattern)
- 4: Top Stocks That Created a New All Time High Today
- 4.1: Top Large Cap Stocks That Created a New All Time High Today
- 4.2: Top Mid Cap Stocks That Created a New All Time High Today
- 4.3: Top Small Cap Stocks That Created a New All Time High Today
Top Indices Performance Overview
| Stock | Close | Range |
|---|---|---|
| NIFTY 50 | ₹24,331.05 (0.02%) | ₹24,240.55 – ₹24,344.59 |
| NIFTY BANK | ₹52,470.05 (-0.37%) | ₹52,256.05 – ₹52,710.25 |
| NIFTY FIN SERVICE | ₹23,604.8 (-0.16%) | ₹23,480.65 – ₹23,679.09 |
| NIFTY IT | ₹37,742.25 (0.05%) | ₹37,582.69 – ₹37,949.8 |
| NIFTY AUTO | ₹25,260.5 (-0.55%) | ₹25,230.8 – ₹25,581.94 |
| NIFTY ENERGY | ₹42,670.05 (0.34%) | ₹42,355.64 – ₹42,747.1 |
Nifty 50 Performance Overview
The Nifty 50 kicked off the day at ₹24,321.65, showing a bit of a rollercoaster ride throughout the session. It dipped to a low of ₹24,240.55 before climbing to a high of ₹24,344.59. Ultimately, it closed the day at ₹24,331.05, a slight gain of +0.02%.
The movers and shakers behind today’s Nifty 50 performance were the top gainers and losers, which you can see listed in the table below.
Nifty 50 Top Gainers
| Stock | Close | Range |
|---|---|---|
| ONGC | ₹300.14 (4.14%) | ₹287.35 – ₹303 |
| ITC | ₹443.89 (2.36%) | ₹433.64 – ₹444.54 |
| HDFC Life | ₹621.04 (2.25%) | ₹608.59 – ₹622.04 |
| Hindustan Unilever | ₹2581 (1.33%) | ₹2,536.25 – ₹2595 |
| WIPRO | ₹542 (1.29%) | ₹535 – ₹543 |
Nifty 50 Top Losers
| Stock | Close | Range |
|---|---|---|
| Divis Lab | ₹4,464.2 (-3.58%) | ₹4445 – ₹4,649.64 |
| TITAN | ₹3,159.8 (-3.46%) | ₹3,126.1 – ₹3204 |
| Bharat Petroleum | ₹299.5 (-2.33%) | ₹298.79 – ₹307.95 |
| Adani Ports | ₹1,475.3 (-1.68%) | ₹1469 – ₹1,501.05 |
| Cipla | ₹1,487.05 (-1.52%) | ₹1,483.19 – ₹1,524.65 |
Nifty 50 Stocks To Watch for Tomorrow
Coal India (Bullish Pattern)
- Performance Overview: Over the past 25 trading sessions, Coal India closed higher 14 times and lower 11 times.
- Recent Trend: Coal India has been on a 7-day winning streak, without a single day closing lower since Thursday, June 27, 2024.
- Returns: Coal India delivered a -4.22% return over the last 25 trading sessions. This means an investment of ₹10,000 would have become ₹9,578.
- Financial Insight: In the past 12 months, Coal India generated revenue of ₹1,30,325.64 Crore and earned a profit of ₹37,402.28 Crore.
- As of Monday, July 8, 2024, Coal India has a Market Capital of ₹3,02,898.19 Crore.
- Summary: Coal India is showing strong signs of bullish momentum. Investors should keep a close eye on its price movements for both short-term and long-term growth potential. Check out Coal India Target for Tomorrow and Coal India Targets for 2024 & 2025.
Coal India Financial Performance
| Metric | Value | Description |
|---|---|---|
| Market Capital | 3,02,898.19 Crore | Market valuation of Coal India’s shares. |
| Revenue (TTM) | 1,30,325.64 Crore | Total revenue generated by Coal India over the past twelve months. |
| Net Income (TTM) | +37,402.28 Crore | Net Profit or Loss after all the expenses over the past twelve months. |
| Operating Margin | 27.27% | Income from operations as a percentage of revenue, before taxes and interest. |
| Profit Margin | 28.69% | Net income as a percentage of revenue, after all expenses. |
| Revenue Growth (Quarterly) | -25.2% | Change in revenue compared to the previous quarter. |
| Earnings Growth (YOY Quarterly) | +56.89% | Change in earnings compared to the same quarter last year. |
| Debt-to-Equity (D/E) Ratio | 7.8 | Company’s total debt divided by total shareholder equity. |
| Total Debt | 6,523.02 Crore | Sum of Coal India’s current & long-term financial obligations. |
| Total Cash | 33,486.27 Crore | Total amount of liquid funds available to Coal India. |
| Beta | 0.27 | Beta is less than 1 indicating that the Coal India’s price is less volatile than the market. |
➲ TITAN (Bearish Pattern)
- Performance Overview: Over the last 25 trading sessions, TITAN’s stock has closed lower 14 times and higher 11 times.
- Recent Trend: TITAN has been on a downward trend for the past 5 days, with no closing gains since Monday, July 1, 2024.
- Returns: In the last 25 trading sessions, TITAN has yielded a -4.54% return. This means an investment of ₹10,000 would be worth ₹9,546 today.
- Financial Insight: Over the past 12 months, Coal India has generated a revenue of ₹51,084 Crore and a profit of ₹3,495.99 Crore.
- As of Monday, July 8, 2024, Coal India has a Market Capital of ₹3,06,218.19 Crore.
- Summary: TITAN is currently in a bearish phase. Keep a close eye on upcoming price movements, especially the TITAN Target for Tomorrow and TITAN Targets for 2024 & 2025.
TITAN Financial Performance
| Metric | Value | Description |
|---|---|---|
| Market Capital | 3,06,218.19 Crore | Market valuation of TITAN’s shares. |
| Revenue (TTM) | 51,084 Crore | Total revenue generated by TITAN over the past twelve months. |
| Net Income (TTM) | +3,495.99 Crore | Net Profit or Loss after all the expenses over the past twelve months. |
| Operating Margin | 8.26% | Income from operations as a percentage of revenue, before taxes and interest. |
| Profit Margin | 6.84% | Net income as a percentage of revenue, after all expenses. |
| Revenue Growth (Quarterly) | +20.6% | Change in revenue compared to the previous quarter. |
| Earnings Growth (YOY Quarterly) | +5.6% | Change in earnings compared to the same quarter last year. |
| Debt-to-Equity (D/E) Ratio | 165.31 | Company’s total debt divided by total shareholder equity. |
| Total Debt | 15,527.99 Crore | Sum of TITAN’s current & long-term financial obligations. |
| Total Cash | 3,192 Crore | Total amount of liquid funds available to TITAN. |
| Beta | 0.46 | Beta is less than 1 indicating that the TITAN’s price is less volatile than the market. |
Nifty 500 Performance Overview
The Nifty 500 started the day at ₹23,029.34, showing some volatility throughout the session. It dipped to a low of ₹22,897.94 before rallying to a high of ₹23,040.75. In the end, it closed at ₹22,971.15, ending the day with a slight downward movement of -0.08%.
Let’s take a peek at the top gainers and losers that shaped the Nifty 500’s performance today.
Nifty 500 Top Gainers
| Stock | Close | Range |
|---|---|---|
| Rail Vikas Nigam | ₹567 (15.46%) | ₹508 – ₹578.95 |
| RCF | ₹230.8 (13.17%) | ₹205 – ₹233 |
| Fertilisers & Chemicals Travancore | ₹1,111.08 (9.22%) | ₹1020 – ₹1,118.94 |
| One 97 Communications | ₹472.95 (8.34%) | ₹440.2 – ₹479.89 |
| Delta Corp | ₹144.66 (7.53%) | ₹133.75 – ₹147.94 |
Nifty 500 Top Losers
| Stock | Close | Range |
|---|---|---|
| Brightcom Group | ₹8.46 (-5.06%) | ₹8.46 – ₹8.46 |
| Vaibhav Global | ₹321.1 (-4.82%) | ₹318.04 – ₹345.5 |
| Radico Khaitan | ₹1639 (-4.51%) | ₹1,636.15 – ₹1,716.69 |
| AU Small Finance Bank | ₹642.7 (-4.45%) | ₹639.09 – ₹668.25 |
| Bank of Baroda | ₹262.35 (-4.18%) | ₹261.54 – ₹268 |
Nifty 51 to 500 Stocks To Watch for Tomorrow
Narayana Hrudayalaya: A Bullish Outlook
- Performance Overview: In the past 25 trading sessions, Narayana Hrudayalaya has shown strength, closing higher on 16 days and lower on 9.
- Recent Trend: Narayana Hrudayalaya has been on a roll! It’s been on a 10-day winning streak, closing higher every day since Monday, June 24, 2024.
- Returns: Narayana Hrudayalaya delivered a solid 2.45% return over the last 25 trading sessions. This means an investment of ₹10,000 would have grown to ₹10,245 during that time.
- Financial Insight: Over the past year, Narayana Hrudayalaya generated impressive revenue of ₹5,018.24 Crore and earned a profit of ₹789.26 Crore.
- As of Monday, July 8, 2024, Narayana Hrudayalaya boasts a Market Capital of ₹25,380.39 Crore.
- Summary: Narayana Hrudayalaya is painting a positive picture for investors. Its strong performance and bullish trend make it an interesting stock to watch. Are you looking for potential targets for short-term or long-term growth? Checkout Narayana Hrudayalaya Target for Tomorrow and Narayana Hrudayalaya Targets for 2024 & 2025.
Narayana Hrudayalaya Financial Performance
| Metric | Value | Description |
|---|---|---|
| Market Capital | 25,380.39 Crore | Market valuation of Narayana Hrudayalaya’s shares. |
| Revenue (TTM) | 5,018.24 Crore | Total revenue generated by Narayana Hrudayalaya over the past twelve months. |
| Net Income (TTM) | +789.26 Crore | Net Profit or Loss after all the expenses over the past twelve months. |
| Operating Margin | 17.95% | Income from operations as a percentage of revenue, before taxes and interest. |
| Profit Margin | 15.72% | Net income as a percentage of revenue, after all expenses. |
| Revenue Growth (Quarterly) | +4.3% | Change in revenue compared to the previous quarter. |
| Earnings Growth (YOY Quarterly) | +10.1% | Change in earnings compared to the same quarter last year. |
| Debt-to-Equity (D/E) Ratio | 56.38 | Company’s total debt divided by total shareholder equity. |
| Total Debt | 1,626.69 Crore | Sum of Narayana Hrudayalaya’s current & long-term financial obligations. |
| Total Cash | 1,256.15 Crore | Total amount of liquid funds available to Narayana Hrudayalaya. |
| Beta | 0.45 | Beta is less than 1 indicating that the Narayana Hrudayalaya’s price is less volatile than the market. |
➲ Apollo Tyres (Bearish Pattern)
- Performance Overview: Over the past 25 trading days, Apollo Tyres has closed lower 14 times and higher 11 times. This suggests some volatility in its recent performance.
- Recent Trend: Apollo Tyres has been on a downward trend for the past five days, closing lower each day since Monday, July 1, 2024.
- Returns: Apollo Tyres delivered a 9.5% return over the last 25 trading sessions. This means that if you had invested ₹10,000, your investment would be worth ₹10,950 today.
- Financial Insight: Over the past 12 months, Apollo Tyres generated revenue of ₹25,377.71 Crore and earned a profit of ₹1,721.86 Crore.
- As of Monday, July 8, 2024, Apollo Tyres has a Market Capital of ₹33,301.51 Crore.
- Summary: Apollo Tyres is currently in a bearish phase. It’s important to keep a close eye on its performance. You can check out our predictions for Apollo Tyres’ Target for Tomorrow and Apollo Tyres’ Targets for 2024 & 2025.
Apollo Tyres Financial Performance
| Metric | Value | Description |
|---|---|---|
| Market Capital | 33,301.51 Crore | Market valuation of Apollo Tyres’s shares. |
| Revenue (TTM) | 25,377.71 Crore | Total revenue generated by Apollo Tyres over the past twelve months. |
| Net Income (TTM) | +1,721.86 Crore | Net Profit or Loss after all the expenses over the past twelve months. |
| Operating Margin | 10.22% | Income from operations as a percentage of revenue, before taxes and interest. |
| Profit Margin | 6.78% | Net income as a percentage of revenue, after all expenses. |
| Revenue Growth (Quarterly) | +7.9% | Change in revenue compared to the previous quarter. |
| Earnings Growth (YOY Quarterly) | -17.2% | Change in earnings compared to the same quarter last year. |
| Debt-to-Equity (D/E) Ratio | 35.28 | Company’s total debt divided by total shareholder equity. |
| Total Debt | 4,905.1 Crore | Sum of Apollo Tyres’s current & long-term financial obligations. |
| Total Cash | 1,415.58 Crore | Total amount of liquid funds available to Apollo Tyres. |
| Beta | 0.9 | Beta is less than 1 indicating that the Apollo Tyres’s price is less volatile than the market. |
Top Stocks That Created a New All Time High Today
Top Large Cap Stocks That Created a New All Time High Today
Companies with Market Capital more than 20,000 Crores| Stock | Close | New All-Time High (ATH) | Previous ATH | Previous ATH Date |
|---|---|---|---|---|
| Aegis Logistics | 930.50 (+0.92%) | 937.40 (+69.22%) | 553.95 | Thu 18 Apr 2024 |
| Apar Industries | 8796.95 (-0.73%) | 8962.84 (+14.17%) | 7850.00 | Wed 24 Apr 2024 |
| Aurobindo Pharma | 1306.44 (+0.22%) | 1327.00 (+%) | Thu 01 Jan 1970 | |
| BASF | 5599.14 (+4.09%) | 5885.00 (+%) | Thu 01 Jan 1970 | |
| Bharat Electronics | 335.50 (+3.53%) | 335.79 (+%) | Thu 01 Jan 1970 |
Top Mid Cap Stocks That Created a New All Time High Today
Companies with Market Capital between 5,000 Crores to 20,000 Crores| Stock | Close | New All-Time High (ATH) | Previous ATH | Previous ATH Date |
|---|---|---|---|---|
| Arvind | 387.29 (-0.94%) | 403.25 (+21.17%) | 332.79 | Tue 23 Apr 2024 |
| ASK Automotive | 396.14 (+1.05%) | 406.50 (+%) | Thu 01 Jan 1970 | |
| Black Box | 398.85 (+1.43%) | 430.00 (+%) | Thu 01 Jan 1970 | |
| DOMS Industries | 2269.94 (+0.01%) | 2365.00 (+28.11%) | 1846.00 | Mon 01 Apr 2024 |
| Elecon Engineering | 1290.40 (-6.27%) | 1409.00 (+17.61%) | 1197.94 | Fri 19 Apr 2024 |
Top Small Cap Stocks That Created a New All Time High Today
Companies with Market Capital less than 5,000 Crores| Stock | Close | New All-Time High (ATH) | Previous ATH | Previous ATH Date |
|---|---|---|---|---|
| 21ST CENTURY MANAG | 74.95 (+1.98%) | 74.95 (+%) | Thu 01 Jan 1970 | |
| Ace Software Exports | 269.00 (+1.99%) | 269.00 (+78.99%) | 150.28 | Mon 01 Apr 2024 |
| ADC India Communications | 2169.64 (-0.97%) | 2309.69 (+%) | Thu 01 Jan 1970 | |
| Advait Infratech | 1972.09 (+1.91%) | 2031.65 (+22.19%) | 1662.60 | Mon 01 Apr 2024 |
| Ahmedabad Steelcraft | 116.10 (+1.97%) | 116.10 (+%) | Thu 01 Jan 1970 |


