Home / Wed 03 Jul 2024 Market Recap
03 Jul 2024: Nifty Closed at ₹24,290.80 (+0.69%) with HCL Tech closing higher for the past 5 consecutive trading days. Discover Top Stocks to Watch!
Show Table of Contents
Table of Contents
- 1: Top Indices Performance Overview
- 2: Nifty 50 Performance Overview
- 2.1: Nifty 50 Top Gainers
- 2.2: Nifty 50 Top Losers
- 2.3: Nifty 50 Stocks To Watch for Tomorrow
- 2.3.1: HCL Technologies: A Look at the Bullish Trend
- 2.3.2: ➲ Divis Lab (Showing Signs of a Downturn)
- 3: Nifty 500 Performance Overview
- 3.1: Nifty 500 Top Gainers
- 3.2: Nifty 500 Top Losers
- 3.3: Nifty 51 to 500 Stocks To Watch for Tomorrow
- 3.3.1: ➲ MphasiS (Looking Bullish)
- 3.3.2: ➲ Ashok Leyland (Showing Bearish Trends)
- 4: Top Stocks That Created a New All Time High Today
- 4.1: Top Large Cap Stocks That Created a New All Time High Today
- 4.2: Top Mid Cap Stocks That Created a New All Time High Today
- 4.3: Top Small Cap Stocks That Created a New All Time High Today
Top Indices Performance Overview
| Stock | Close | Range |
|---|---|---|
| NIFTY 50 | ₹24,290.8 (0.69%) | ₹24,209.8 – ₹24,308.44 |
| NIFTY BANK | ₹53,042.14 (1.67%) | ₹52,503.44 – ₹53,255.85 |
| NIFTY FIN SERVICE | ₹23,914.8 (1.76%) | ₹23,701.15 – ₹23,991.15 |
| NIFTY IT | ₹37,324.05 (0.06%) | ₹37,065.19 – ₹37,439.44 |
| NIFTY AUTO | ₹25,198.84 (0.27%) | ₹25,123.34 – ₹25,271.05 |
| NIFTY ENERGY | ₹41,818.69 (0.24%) | ₹41,558.25 – ₹41,847.1 |
Nifty 50 Performance Overview
The Nifty 50 kicked off the day at ₹24,277.09, showing some spirited movement throughout the session. It dipped to a low of ₹24,209.80 before rallying to a high of ₹24,308.44. By the closing bell, it settled at ₹24,290.80, marking a +0.69% gain for the day.
The day’s performance was influenced by a mix of gainers and losers, creating a dynamic trading environment.
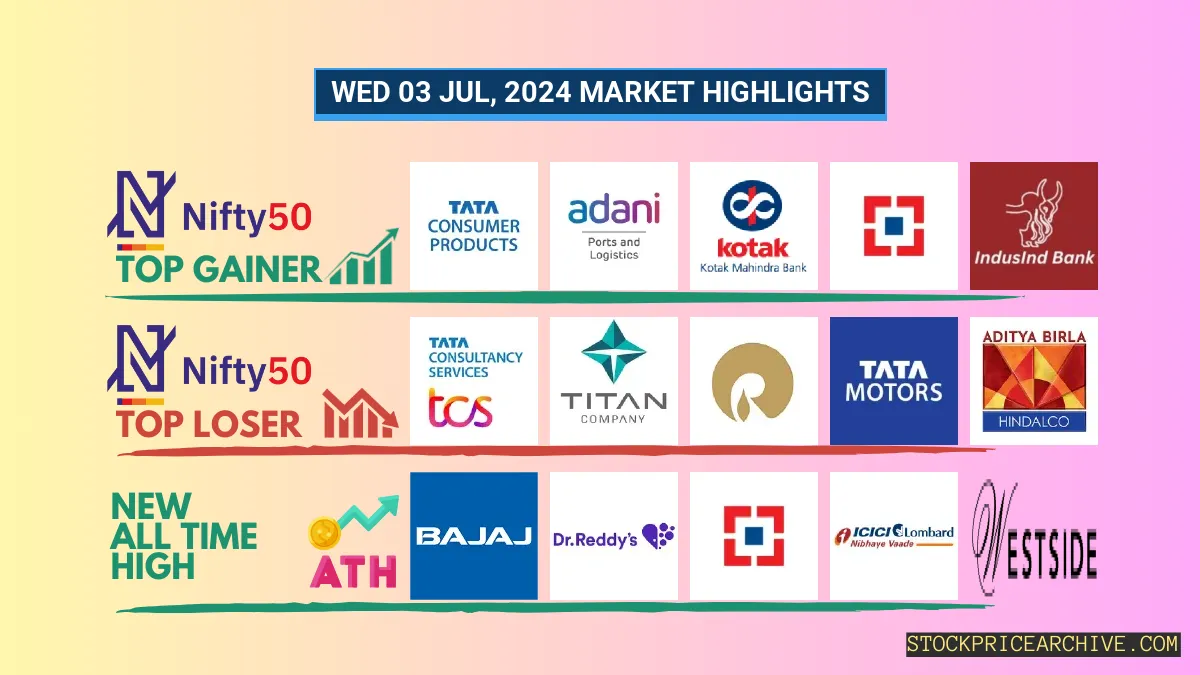
Nifty 50 Top Gainers
| Stock | Close | Range |
|---|---|---|
| Tata Consumer Products | ₹1,143.44 (3.47%) | ₹1,112.4 – ₹1,148.58 |
| Adani Ports | ₹1,510.65 (2.42%) | ₹1471 – ₹1,513.94 |
| Kotak Mahindra Bank | ₹1809 (2.22%) | ₹1,758.09 – ₹1,815.65 |
| HDFC BANK | ₹1,768.4 (2.18%) | ₹1,765.15 – ₹1,790.15 |
| IndusInd Bank | ₹1,455.5 (1.82%) | ₹1,421.9 – ₹1458 |
Nifty 50 Top Losers
| Stock | Close | Range |
|---|---|---|
| TCS | ₹3968 (-1.23%) | ₹3955 – ₹4,019.89 |
| TITAN | ₹3362 (-1.11%) | ₹3,343.05 – ₹3,421.89 |
| Reliance Industries | ₹3,108.89 (-0.69%) | ₹3086 – ₹3150 |
| Tata Motors | ₹976.9 (-0.45%) | ₹973.59 – ₹987.25 |
| Hindalco | ₹692.04 (-0.4%) | ₹683.5 – ₹702.65 |
Nifty 50 Stocks To Watch for Tomorrow
HCL Technologies: A Look at the Bullish Trend
- Performance Overview: In the last 26 trading sessions (as of July 3, 2024), HCL Technologies has closed higher than the previous day 16 times, indicating a positive trend.
- Recent Trend: HCL has been on a roll, closing higher for the past 5 consecutive trading days, starting from June 26, 2024.
- Returns: If you had invested ₹10,000 in HCL over the past 26 trading sessions, your investment would have grown to ₹10,921, reflecting a 9.21% return.
- Financial Insight: Over the past year, HCL has generated a strong revenue of ₹1,10,741.46 Crore and a profit of ₹15,822.59 Crore.
- As of July 3, 2024, HCL has a Market Capital of ₹3,97,763.09 Crore.
- Summary: The recent performance of HCL Technologies suggests a strong bullish pattern. Investors are advised to keep an eye on the company’s price movements to identify potential short-term and long-term growth opportunities. Learn about HCL’s potential target for tomorrow and explore the potential targets for HCL in 2024 and 2025.
HCL Financial Performance
| Metric | Value | Description |
|---|---|---|
| Market Capital | 3,97,763.09 Crore | Market valuation of HCL’s shares. |
| Revenue (TTM) | 1,10,741.46 Crore | Total revenue generated by HCL over the past twelve months. |
| Net Income (TTM) | +15,822.59 Crore | Net Profit or Loss after all the expenses over the past twelve months. |
| Operating Margin | 17.6% | Income from operations as a percentage of revenue, before taxes and interest. |
| Profit Margin | 14.28% | Net income as a percentage of revenue, after all expenses. |
| Revenue Growth (Quarterly) | +6% | Change in revenue compared to the previous quarter. |
| Earnings Growth (YOY Quarterly) | -0.2% | Change in earnings compared to the same quarter last year. |
| Debt-to-Equity (D/E) Ratio | 8.45 | Company’s total debt divided by total shareholder equity. |
| Total Debt | 5,774.91 Crore | Sum of HCL’s current & long-term financial obligations. |
| Total Cash | 27,213.85 Crore | Total amount of liquid funds available to HCL. |
| Beta | 0.58 | Beta is less than 1 indicating that the HCL’s price is less volatile than the market. |
➲ Divis Lab (Showing Signs of a Downturn)
- Performance Overview: Over the last 26 trading days, Divis Lab’s share price has closed higher 14 times and lower 12 times. This suggests some volatility in the stock’s performance.
- Recent Trend: Divis Lab has seen a slight dip in its share price over the last two days, with no gains since Monday, July 1st, 2024.
- Returns: Over the past 26 trading sessions, Divis Lab has delivered a positive return of 7.57%. This means that if you had invested ₹10,000, your investment would be worth ₹10,757 today.
- Financial Insight: Divis Lab has shown strong financial performance over the past year, generating a revenue of ₹7,844.99 Crore and achieving a profit of ₹1,600 Crore.
- As of Wednesday, July 3rd, 2024, Divis Lab has a Market Capital of ₹1,20,731.32 Crore.
- Summary: While Divis Lab has experienced some recent downward movement, its overall performance remains solid. It’s worth keeping a close eye on the stock’s short-term trajectory. For insights on potential future price movements, check out our projections for Divis Lab’s Target for Tomorrow and Divis Lab Targets for 2024 & 2025.
Divis Lab Financial Performance
| Metric | Value | Description |
|---|---|---|
| Market Capital | 1,20,731.32 Crore | Market valuation of Divis Lab’s shares. |
| Revenue (TTM) | 7,844.99 Crore | Total revenue generated by Divis Lab over the past twelve months. |
| Net Income (TTM) | +1,600 Crore | Net Profit or Loss after all the expenses over the past twelve months. |
| Operating Margin | 27.7% | Income from operations as a percentage of revenue, before taxes and interest. |
| Profit Margin | 20.39% | Net income as a percentage of revenue, after all expenses. |
| Revenue Growth (Quarterly) | +18.09% | Change in revenue compared to the previous quarter. |
| Earnings Growth (YOY Quarterly) | +67.6% | Change in earnings compared to the same quarter last year. |
| Debt-to-Equity (D/E) Ratio | 0.02 | Company’s total debt divided by total shareholder equity. |
| Total Debt | 3 Crore | Sum of Divis Lab’s current & long-term financial obligations. |
| Total Cash | 3,980 Crore | Total amount of liquid funds available to Divis Lab. |
| Beta | 0.34 | Beta is less than 1 indicating that the Divis Lab’s price is less volatile than the market. |
Nifty 500 Performance Overview
The Nifty 500 kicked off the day at ₹22,820.55, displaying a spirited performance. While it encountered some bumps along the way, reaching a low of ₹22,765, it ultimately rallied to a high of ₹22,871.5 before settling at a close of ₹22,856.94 (+0.78%).
Take a look at the top gainers and losers – their movement played a key role in the Nifty 500’s journey today.
Nifty 500 Top Gainers
| Stock | Close | Range |
|---|---|---|
| Castrol | ₹241.78 (12.89%) | ₹214.73 – ₹252 |
| Solar Industries India | ₹11,969.95 (8.62%) | ₹10,725.59 – ₹12,531.29 |
| Gujarat Pipavav Port | ₹230.89 (8.43%) | ₹213.58 – ₹232.95 |
| Housing & Urban Development Corp | ₹301.6 (8.35%) | ₹280.29 – ₹304 |
| Mazagoan Dock Shipbuilders | ₹4690 (8.32%) | ₹4321 – ₹4,725.89 |
Nifty 500 Top Losers
| Stock | Close | Range |
|---|---|---|
| Cholamandalam Financial | ₹1468 (-5.98%) | ₹1,462.5 – ₹1550 |
| JK Paper | ₹600.5 (-5.25%) | ₹597.7 – ₹626 |
| Sumitomo Chemical India | ₹493.95 (-3.64%) | ₹492.45 – ₹515.5 |
| CDSL | ₹2,322.05 (-2.89%) | ₹2,312.19 – ₹2,403.1 |
| Route Mobile | ₹1770 (-2.58%) | ₹1761 – ₹1,825.84 |
Nifty 51 to 500 Stocks To Watch for Tomorrow
➲ MphasiS (Looking Bullish)
- Recent Performance: MphasiS has shown some strong momentum! In the last 26 trading sessions, it closed higher 16 times and lower 10 times.
- Hot Streak: MphasiS is on a roll, with a 7-day green streak – no red days since Monday, June 24th, 2024.
- Returns: Over the past 26 trading sessions, MphasiS has delivered a 4.78% return. This means an investment of ₹10,000 would be worth ₹10,478 today.
- Financial Snapshot: Over the past year, MphasiS generated impressive revenue of ₹13,278.51 Crore and a profit of ₹1,554.81 Crore.
- Market Value: As of Wednesday, July 3rd, 2024, MphasiS has a Market Capitalization of ₹46,445.99 Crore.
- Looking Ahead: MphasiS is showing some strong signs and its bullish pattern makes it a stock worth watching. If you’re interested in exploring potential price targets, check out these links: MphasiS Target for Tomorrow and MphasiS Targets for 2024 & 2025.
MphasiS Financial Performance
| Metric | Value | Description |
|---|---|---|
| Market Capital | 46,445.99 Crore | Market valuation of MphasiS’s shares. |
| Revenue (TTM) | 13,278.51 Crore | Total revenue generated by MphasiS over the past twelve months. |
| Net Income (TTM) | +1,554.81 Crore | Net Profit or Loss after all the expenses over the past twelve months. |
| Operating Margin | 14.88% | Income from operations as a percentage of revenue, before taxes and interest. |
| Profit Margin | 11.7% | Net income as a percentage of revenue, after all expenses. |
| Revenue Growth (Quarterly) | +1.5% | Change in revenue compared to the previous quarter. |
| Earnings Growth (YOY Quarterly) | -3% | Change in earnings compared to the same quarter last year. |
| Debt-to-Equity (D/E) Ratio | 27.16 | Company’s total debt divided by total shareholder equity. |
| Total Debt | 2,388.58 Crore | Sum of MphasiS’s current & long-term financial obligations. |
| Total Cash | 3,578.66 Crore | Total amount of liquid funds available to MphasiS. |
| Beta | 0.73 | Beta is less than 1 indicating that the MphasiS’s price is less volatile than the market. |
➲ Ashok Leyland (Showing Bearish Trends)
- Performance Snapshot: Over the past 26 trading days, Ashok Leyland has seen 13 days where the share price closed higher and 13 days where it closed lower.
- Recent Activity: Ashok Leyland has been on a downward trend for the past four trading days, with the share price closing lower each day since Thursday, June 27th, 2024.
- Returns Breakdown: During this recent 26-day period, Ashok Leyland provided a return of 0.86%. This means that if you had invested ₹10,000, your investment would be worth ₹10,086 today.
- Financial Highlights: Looking at the past 12 months, MphasiS generated a revenue of ₹45,790.63 Crore and recorded a profit of ₹2,483.51 Crore.
- As of Wednesday, July 3rd, 2024, MphasiS has a Market Capital of ₹71,085.09 Crore.
- Summary: Ashok Leyland is currently experiencing a bearish trend. It’s wise for investors to keep a close eye on the stock’s performance. You can find potential target prices for tomorrow and projected target prices for 2024 and 2025 on our website.
Ashok Leyland Financial Performance
| Metric | Value | Description |
|---|---|---|
| Market Capital | 71,085.09 Crore | Market valuation of Ashok Leyland’s shares. |
| Revenue (TTM) | 45,790.63 Crore | Total revenue generated by Ashok Leyland over the past twelve months. |
| Net Income (TTM) | +2,483.51 Crore | Net Profit or Loss after all the expenses over the past twelve months. |
| Operating Margin | 17.45% | Income from operations as a percentage of revenue, before taxes and interest. |
| Profit Margin | 5.42% | Net income as a percentage of revenue, after all expenses. |
| Revenue Growth (Quarterly) | +2.8% | Change in revenue compared to the previous quarter. |
| Earnings Growth (YOY Quarterly) | +13.4% | Change in earnings compared to the same quarter last year. |
| Debt-to-Equity (D/E) Ratio | 345.35 | Company’s total debt divided by total shareholder equity. |
| Total Debt | 40,802.17 Crore | Sum of Ashok Leyland’s current & long-term financial obligations. |
| Total Cash | 8,103.23 Crore | Total amount of liquid funds available to Ashok Leyland. |
| Beta | 0.89 | Beta is less than 1 indicating that the Ashok Leyland’s price is less volatile than the market. |
Top Stocks That Created a New All Time High Today
Top Large Cap Stocks That Created a New All Time High Today
Companies with Market Capital more than 20,000 Crores| Stock | Close | New All-Time High (ATH) | Previous ATH | Previous ATH Date |
|---|---|---|---|---|
| Bajaj Holdings | 9270.00 (+4.19%) | 9349.00 (+%) | Thu 01 Jan 1970 | |
| Cochin Shipyard | 2434.00 (+7.66%) | 2462.60 (+%) | Thu 01 Jan 1970 | |
| Dixon Technologies | 12697.29 (+1.43%) | 12877.25 (+61.3%) | 7983.00 | Fri 12 Apr 2024 |
| Dr Reddy Lab | 6420.00 (+0.78%) | 6525.00 (+%) | Thu 01 Jan 1970 | |
| Federal Bank | 181.21 (+3.53%) | 183.28 (+%) | Thu 01 Jan 1970 |
Top Mid Cap Stocks That Created a New All Time High Today
Companies with Market Capital between 5,000 Crores to 20,000 Crores| Stock | Close | New All-Time High (ATH) | Previous ATH | Previous ATH Date |
|---|---|---|---|---|
| Amber Enterprises | 4443.10 (-1.2%) | 4665.00 (+%) | Thu 01 Jan 1970 | |
| ASK Automotive | 393.14 (+0.84%) | 400.10 (+%) | Thu 01 Jan 1970 | |
| Cello World | 960.09 (+6.55%) | 970.00 (+1.25%) | 958.00 | Wed 24 Apr 2024 |
| Craftsmen Automation | 5761.50 (+1.16%) | 5834.70 (+%) | Thu 01 Jan 1970 | |
| DOMS Industries | 2150.75 (+0.37%) | 2212.00 (+19.82%) | 1846.00 | Mon 01 Apr 2024 |
Top Small Cap Stocks That Created a New All Time High Today
Companies with Market Capital less than 5,000 Crores| Stock | Close | New All-Time High (ATH) | Previous ATH | Previous ATH Date |
|---|---|---|---|---|
| 21ST CENTURY MANAG | 70.64 (+1.99%) | 70.64 (+%) | Thu 01 Jan 1970 | |
| Agarwal Industrial | 1243.00 (+5.29%) | 1298.00 (+%) | Thu 01 Jan 1970 | |
| Ahmedabad Steelcraft | 109.50 (+1.95%) | 109.50 (+%) | Thu 01 Jan 1970 | |
| Automotive Stampings | 1047.40 (+1.83%) | 1094.55 (+%) | Thu 01 Jan 1970 | |
| Ashiana Agro Industries | 23.81 (+4.98%) | 23.81 (+%) | Thu 01 Jan 1970 |