Home / Tue 11 Jun 2024 Market Recap
11 Jun 2024: Nifty closes at ₹23,262 (+0.01%). Apollo Hospitals & Aarti Drugs were bullish. Coal India & PI Industries struggles. Top stocks to watch!
Show Table of Contents
Table of Contents
- 1: Top Indices Performance Overview
- 2: Nifty 50 Performance Overview
- 2.1: Nifty 50 Top Gainers
- 2.2: Nifty 50 Top Losers
- 2.3: Nifty 50 Stocks To Watch for Tomorrow
- 2.3.1: ➲ Apollo Hospitals (Bullish Pattern)
- 2.3.2: ➲ Coal India (Bearish Pattern)
- 3: Nifty 500 Performance Overview
- 3.1: Nifty 500 Top Gainers
- 3.2: Nifty 500 Top Losers
- 3.3: Nifty 51 to 500 Stocks To Watch for Tomorrow
- 3.3.1: ➲ Aarti Drugs (Bullish Pattern)
- 3.3.2: ➲ PI Industries (Bearish Pattern)
- 4: Top Stocks That Created a New All Time High Today
- 4.1: Top Large Cap Stocks That Created a New All Time High Today
- 4.2: Top Mid Cap Stocks That Created a New All Time High Today
- 4.3: Top Small Cap Stocks That Created a New All Time High Today
Top Indices Performance Overview
| Stock | Close | Range |
|---|---|---|
| NIFTY 50 | ₹23262 (0.01%) | ₹23,208.5 – ₹23,387.09 |
| NIFTY BANK | ₹49,652.25 (-0.26%) | ₹49,533.55 – ₹49,968.25 |
| NIFTY FIN SERVICE | ₹22,110.59 (-0.2%) | ₹22,040.94 – ₹22220 |
| NIFTY IT | ₹34,537.3 (0.03%) | ₹34,483.69 – ₹34,751.3 |
| NIFTY AUTO | ₹25,228.9 (0.82%) | ₹25,008.65 – ₹25,340.94 |
| NIFTY ENERGY | ₹40,660.6 (0.37%) | ₹40,396.14 – ₹40,877.35 |
Nifty 50 Performance Overview
Nifty 50 Overview
The Nifty 50 opened at ₹23,273.55 and fluctuated throughout the session. It hit a low of ₹23,208.5 and a high of ₹23,387.09 before closing at ₹23,262, marking a slight gain of 0.01%.
The following table lists the top gainers and losers that contributed to the Nifty 50’s movement today:
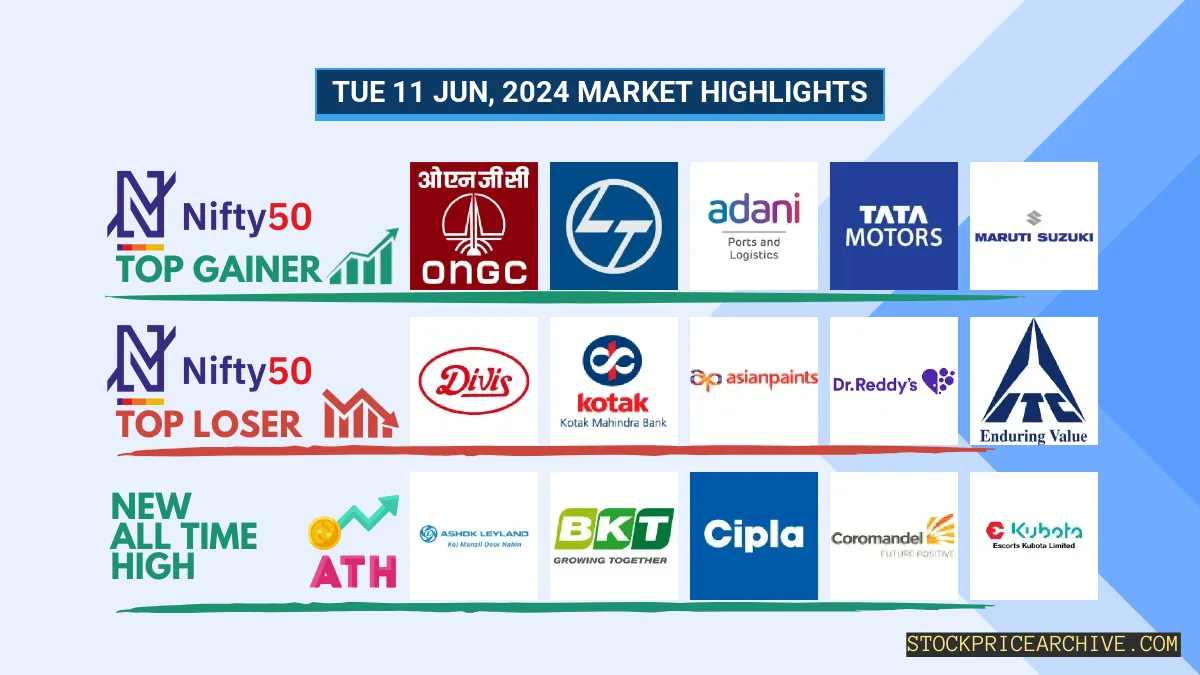
Nifty 50 Top Gainers
| Stock | Close | Range |
|---|---|---|
| ONGC | ₹274 (5.73%) | ₹265.54 – ₹275 |
| Larsen Toubro | ₹3600 (1.58%) | ₹3,553.55 – ₹3639 |
| Adani Ports | ₹1405 (1.51%) | ₹1,384.15 – ₹1,418.8 |
| Tata Motors | ₹987.09 (1.22%) | ₹966.65 – ₹992.54 |
| Maruti Suzuki | ₹12,868.7 (1.18%) | ₹12,655.2 – ₹12,938.95 |
Nifty 50 Top Losers
| Stock | Close | Range |
|---|---|---|
| Divis Lab | ₹4,475.45 (-1.35%) | ₹4,462.35 – ₹4,581.7 |
| Kotak Mahindra Bank | ₹1,722.9 (-1.31%) | ₹1,717.5 – ₹1,744.84 |
| Asian Paints | ₹2903 (-1.18%) | ₹2,895.35 – ₹2,920.19 |
| Dr Reddy Lab | ₹6,039.25 (-1.1%) | ₹6028 – ₹6,090.35 |
| ITC | ₹432.75 (-0.95%) | ₹432.45 – ₹437.7 |
Nifty 50 Stocks To Watch for Tomorrow
➲ Apollo Hospitals (Bullish Pattern)
- Performance Overview: In the last 27 trading sessions, Apollo Hospitals has closed in green 15 times and in red 12 times.
- Recent Trend: Apollo Hospitals has been on a 5-day green streak, without a single day closing in red since Tue 04 Jun 2024.
- Returns: Apollo Hospitals gave a 1.29% returns in the last 27 trading sessions, that means your investment of ₹10,000 would have become ₹10,129
- Financial Insight: Over the past 12 months, Apollo Hospitals has generated a renvenue of ₹19,059.19 Crore and created a profit of ₹898.6 Crore.
- As of Tue 11 Jun 2024, Apollo Hospitals has a Market Capital of ₹86,303.34 Crore.
- Summary: Apollo Hospitals exhibits a robust bullish pattern. Investors should monitor its price movements targets for both short-term and long-term growth prospects: Checkout Apollo Hospitals Target for Tomorrow and Apollo Hospitals Targets for 2024 & 2025.
Apollo Hospitals Financial Performance
| Metric | Value | Description |
|---|---|---|
| Market Capital | 86,303.34 Crore | Market valuation of Apollo Hospitals’s shares. |
| Revenue (TTM) | 19,059.19 Crore | Total revenue generated by Apollo Hospitals over the past twelve months. |
| Net Income (TTM) | +898.6 Crore | Net Profit or Loss after all the expenses over the past twelve months. |
| Operating Margin | 9.11% | Income from operations as a percentage of revenue, before taxes and interest. |
| Profit Margin | 4.71% | Net income as a percentage of revenue, after all expenses. |
| Revenue Growth (Quarterly) | +14.89% | Change in revenue compared to the previous quarter. |
| Earnings Growth (YOY Quarterly) | +75.59% | Change in earnings compared to the same quarter last year. |
| Debt-to-Equity (D/E) Ratio | 72.84 | Company’s total debt divided by total shareholder equity. |
| Total Debt | 5,332.6 Crore | Sum of Apollo Hospitals’s current & long-term financial obligations. |
| Total Cash | 1,617.79 Crore | Total amount of liquid funds available to Apollo Hospitals. |
| Beta | 0.56 | Beta is less than 1 indicating that the Apollo Hospitals’s price is less volatile than the market. |
➲ Coal India (Bearish Pattern)
- Performance Overview: In the last 27 trading sessions, Coal India has closed in red 13 times and in green 14 times.
- Recent Trend: Coal India has been on a 2-day red streak, without a single day closing in green since Fri 07 Jun 2024.
- Returns: Coal India gave a -0.3% returns in the last 27 trading sessions, that means your investment of ₹10,000 would have become ₹9,970
- Financial Insight: Over the past 12 months, Apollo Hospitals has generated a renvenue of ₹1,30,325.64 Crore and created a profit of ₹37,402.28 Crore.
- As of Tue 11 Jun 2024, Apollo Hospitals has a Market Capital of ₹2,83,824.51 Crore.
- Summary: Coal India is currently experiencing a bearish phase. We advise investors to keep a close watch, especially on Coal India Target for Tomorrow and Coal India Targets for 2024 & 2025.
Coal India Financial Performance
| Metric | Value | Description |
|---|---|---|
| Market Capital | 2,83,824.51 Crore | Market valuation of Coal India’s shares. |
| Revenue (TTM) | 1,30,325.64 Crore | Total revenue generated by Coal India over the past twelve months. |
| Net Income (TTM) | +37,402.28 Crore | Net Profit or Loss after all the expenses over the past twelve months. |
| Operating Margin | 27.27% | Income from operations as a percentage of revenue, before taxes and interest. |
| Profit Margin | 28.69% | Net income as a percentage of revenue, after all expenses. |
| Revenue Growth (Quarterly) | -25.2% | Change in revenue compared to the previous quarter. |
| Earnings Growth (YOY Quarterly) | +56.89% | Change in earnings compared to the same quarter last year. |
| Debt-to-Equity (D/E) Ratio | 7.8 | Company’s total debt divided by total shareholder equity. |
| Total Debt | 6,523.02 Crore | Sum of Coal India’s current & long-term financial obligations. |
| Total Cash | 33,486.27 Crore | Total amount of liquid funds available to Coal India. |
| Beta | 0.29 | Beta is less than 1 indicating that the Coal India’s price is less volatile than the market. |
Nifty 500 Performance Overview
Nifty 500 overview:
The Nifty 500 opened its doors at ₹21,857.55 and experienced a session of ups and downs, reaching a low of ₹21,782.55 and a high of ₹21,961.34 before settling the day at ₹21,852.5 (+0.2%) at close.
The session was influenced by top-performing stocks and underperforming stocks.
Nifty 500 Top Gainers
| Stock | Close | Range |
|---|---|---|
| NBCC | ₹157.19 (9.95%) | ₹148.53 – ₹159.49 |
| HFCL | ₹107.5 (9.28%) | ₹97.1 – ₹108.33 |
| Triveni Engineering & Industries | ₹368.35 (8.54%) | ₹336.25 – ₹372.54 |
| Ircon International | ₹271.5 (7.89%) | ₹257.1 – ₹275.29 |
| Home First Finance Company | ₹929.84 (7.54%) | ₹873.75 – ₹962.4 |
Nifty 500 Top Losers
| Stock | Close | Range |
|---|---|---|
| PNC Infratech | ₹479.25 (-8.12%) | ₹470.04 – ₹504.79 |
| IRB Infrastructure Developers | ₹66.44 (-5.31%) | ₹64.03 – ₹66.75 |
| InterGlobe Aviation – INDIGO | ₹4374 (-4.22%) | ₹4361 – ₹4,464.6 |
| IIFL Finance | ₹471.1 (-3.85%) | ₹470 – ₹498.7 |
| Avanti Feeds | ₹610.29 (-3.79%) | ₹610 – ₹633.5 |
Nifty 51 to 500 Stocks To Watch for Tomorrow
➲ Aarti Drugs (Bullish Pattern)
- Performance Overview: Over the past 27 trading sessions, Aarti Drugs has closed in green 16 times and in red 10 times.
- Recent Trend: Aarti Drugs has been on a 5-day green streak, without closing in red since Tuesday, June 4, 2024.
- Returns: In the last 27 trading sessions, Aarti Drugs delivered a 2.11% return. Consequently, an investment of ₹10,000 would have grown to ₹10,210.99.
- Financial Insight: In the past 12 months, Aarti Drugs has generated a revenue of ₹2,528.57 Crore and a profit of ₹171.42 Crore.
- As of Tuesday, June 11, 2024, Aarti Drugs has a Market Capital of ₹4,609.16 Crore.
- Summary: Aarti Drugs exhibits a robust bullish pattern. Investors should monitor its price movements to identify potential opportunities for both short-term and long-term growth. For more detailed insights, consider these resources: Aarti Drugs Target for Tomorrow and Aarti Drugs Targets for 2024 & 2025.
Aarti Drugs Financial Performance
| Metric | Value | Description |
|---|---|---|
| Market Capital | 4,609.16 Crore | Market valuation of Aarti Drugs’s shares. |
| Revenue (TTM) | 2,528.57 Crore | Total revenue generated by Aarti Drugs over the past twelve months. |
| Net Income (TTM) | +171.42 Crore | Net Profit or Loss after all the expenses over the past twelve months. |
| Operating Margin | 11.82% | Income from operations as a percentage of revenue, before taxes and interest. |
| Profit Margin | 6.77% | Net income as a percentage of revenue, after all expenses. |
| Revenue Growth (Quarterly) | -16.5% | Change in revenue compared to the previous quarter. |
| Earnings Growth (YOY Quarterly) | -15.5% | Change in earnings compared to the same quarter last year. |
| Debt-to-Equity (D/E) Ratio | 44.01 | Company’s total debt divided by total shareholder equity. |
| Total Debt | 564.28 Crore | Sum of Aarti Drugs’s current & long-term financial obligations. |
| Total Cash | 20.77 Crore | Total amount of liquid funds available to Aarti Drugs. |
| Beta | 0.86 | Beta is less than 1 indicating that the Aarti Drugs’s price is less volatile than the market. |
➲ PI Industries (Bearish Pattern)
- Performance Overview: In the last 27 trading sessions, PI Industries has closed in red 15 times and in green 11 times. It has been on a 4-day red streak, without a single day closing in green since Wed, Jun 5, 2024.
- Returns: Over this period, PI Industries gave a modest 0.03% return. An investment of ₹10,000 would have become ₹10,003.
- Financial Insight: Over the past 12 months, PI Industries has generated a revenue of ₹7,665.79 Crore and created a profit of ₹1,681.49 Crore.
- As of Tue, Jun 11, 2024, PI Industries has a Market Capital of ₹55,077.84 Crore.
- Summary: PI Industries is currently experiencing a bearish phase. Investors should monitor its performance closely, especially its Target for Tomorrow and Targets for 2024 & 2025.
PI Industries Financial Performance
| Metric | Value | Description |
|---|---|---|
| Market Capital | 55,077.84 Crore | Market valuation of PI Industries’s shares. |
| Revenue (TTM) | 7,665.79 Crore | Total revenue generated by PI Industries over the past twelve months. |
| Net Income (TTM) | +1,681.49 Crore | Net Profit or Loss after all the expenses over the past twelve months. |
| Operating Margin | 20.89% | Income from operations as a percentage of revenue, before taxes and interest. |
| Profit Margin | 21.93% | Net income as a percentage of revenue, after all expenses. |
| Revenue Growth (Quarterly) | +11.2% | Change in revenue compared to the previous quarter. |
| Earnings Growth (YOY Quarterly) | +31.7% | Change in earnings compared to the same quarter last year. |
| Debt-to-Equity (D/E) Ratio | 2.18 | Company’s total debt divided by total shareholder equity. |
| Total Debt | 190.6 Crore | Sum of PI Industries’s current & long-term financial obligations. |
| Total Cash | 3,949.9 Crore | Total amount of liquid funds available to PI Industries. |
| Beta | 0.62 | Beta is less than 1 indicating that the PI Industries’s price is less volatile than the market. |
Top Stocks That Created a New All Time High Today
Top Large Cap Stocks That Created a New All Time High Today
Companies with Market Capital more than 20,000 Crores| Stock | Close | New All-Time High (ATH) | Previous ATH | Previous ATH Date |
|---|---|---|---|---|
| Apar Industries | 8157.00 (-0.81%) | 8446.90 (+7.6%) | 7850.00 | Wed 24 Apr 2024 |
| Ashok Leyland | 238.85 (+3.21%) | 238.85 (+%) | Thu 01 Jan 1970 | |
| Balkrishna Industries | 3231.19 (-0.6%) | 3283.50 (+%) | Thu 01 Jan 1970 | |
| CEBBCO | 657.79 (+5.44%) | 682.00 (+57.21%) | 433.80 | Mon 01 Jan 2024 |
| Cipla | 1535.00 (+0.04%) | 1546.30 (+%) | Thu 01 Jan 1970 |
Top Mid Cap Stocks That Created a New All Time High Today
Companies with Market Capital between 5,000 Crores to 20,000 Crores| Stock | Close | New All-Time High (ATH) | Previous ATH | Previous ATH Date |
|---|---|---|---|---|
| Arvind | 380.00 (+3.74%) | 393.14 (+18.13%) | 332.79 | Tue 23 Apr 2024 |
| Azad Engineering | 1696.69 (+4.99%) | 1696.69 (+%) | Thu 01 Jan 1970 | |
| BASF | 4728.39 (+3.72%) | 4847.70 (+%) | Thu 01 Jan 1970 | |
| Bikaji Foods | 697.50 (+3%) | 723.29 (+%) | Thu 01 Jan 1970 | |
| CMS Info Systems | 482.95 (+1.77%) | 487.00 (+%) | Thu 01 Jan 1970 |
Top Small Cap Stocks That Created a New All Time High Today
Companies with Market Capital less than 5,000 Crores| Stock | Close | New All-Time High (ATH) | Previous ATH | Previous ATH Date |
|---|---|---|---|---|
| Ace Software Exports | 240.05 (+1.99%) | 240.05 (+59.73%) | 150.28 | Mon 01 Apr 2024 |
| Advait Infratech | 1765.00 (-2.9%) | 1897.00 (+14.09%) | 1662.60 | Mon 01 Apr 2024 |
| Ahmedabad Steelcraft | 81.45 (+1.99%) | 81.45 (+%) | Thu 01 Jan 1970 | |
| Automotive Stampings | 962.25 (+9.55%) | 970.90 (+%) | Thu 01 Jan 1970 | |
| Ashiana Housing | 411.00 (+5.98%) | 421.00 (+18.29%) | 355.89 | Fri 12 Apr 2024 |