Home / Thu 13 Jun 2024 Market Recap
13 Jun 2024: Nifty 50 Closes at ₹23,399.34 (+0.32%), Apollo Hospitals & Hindustan Unilever Lead Key Trends
Show Table of Contents
Table of Contents
- 1: Top Indices Performance Overview
- 2: Nifty 50 Performance Overview
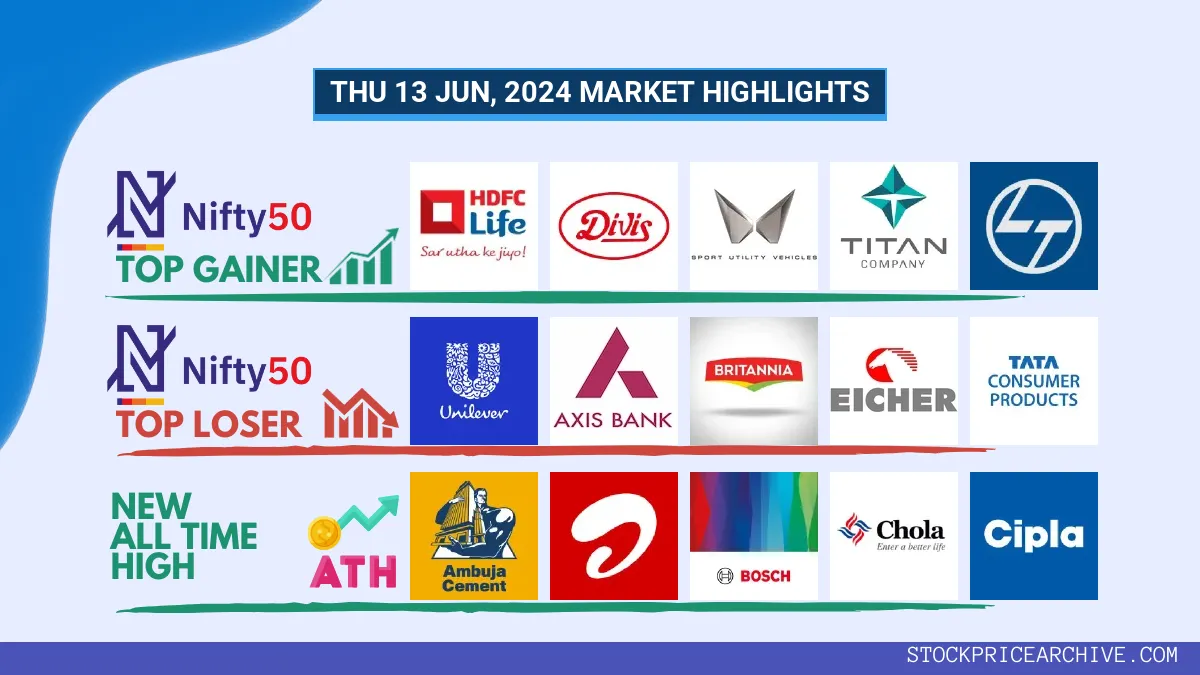
- 2.1: Nifty 50 Top Gainers
- 2.2: Nifty 50 Top Losers
- 2.3: Nifty 50 Stocks To Watch for Tomorrow
- 2.3.1: ➲ Apollo Hospitals (Bullish Pattern)
- 2.3.2: ➲ Hindustan Unilever (Bearish Pattern)
- 3: Nifty 500 Performance Overview
- 3.1: Nifty 500 Top Gainers
- 3.2: Nifty 500 Top Losers
- 3.3: Nifty 51 to 500 Stocks To Watch for Tomorrow
- 3.3.1: ➲ V-Mart (Bullish Pattern)
- 3.3.2: ➲ Allcargo Logistics (Bearish Pattern)
- 4: Top Stocks That Created a New All Time High Today
- 4.1: Top Large Cap Stocks That Created a New All Time High Today
- 4.2: Top Mid Cap Stocks That Created a New All Time High Today
- 4.3: Top Small Cap Stocks That Created a New All Time High Today
Top Indices Performance Overview
| Stock | Close | Range |
|---|---|---|
| NIFTY 50 | ₹23,399.34 (0.32%) | ₹23,353.9 – ₹23,481.05 |
| NIFTY BANK | ₹49,889.3 (-0.02%) | ₹49,799.64 – ₹50,186.44 |
| NIFTY FIN SERVICE | ₹22,311.4 (0.35%) | ₹22,274.4 – ₹22,386.4 |
| NIFTY IT | ₹34,902.05 (1.02%) | ₹34,783.19 – ₹35,039.55 |
| NIFTY AUTO | ₹25,393.19 (0.69%) | ₹25,162.5 – ₹25,482.3 |
| NIFTY ENERGY | ₹40,943.25 (-0.13%) | ₹40,803.44 – ₹41,357.69 |
Nifty 50 Performance Overview
The Nifty 50 commenced at ₹23,454.55 and exhibited variations throughout the session. It plunged to a low of ₹23,353.9 and ascended to a high of ₹23,481.05. The index eventually concluded the session at ₹23,399.34, signifying a (+0.32%) increase from the previous close.Nifty 50 Top Gainers
| Stock | Close | Range |
|---|---|---|
| HDFC Life | ₹591 (3.19%) | ₹565 – ₹598.4 |
| Divis Lab | ₹4,593.5 (3.17%) | ₹4,496.85 – ₹4617 |
| Mahindra & Mahindra | ₹2,861.69 (2.65%) | ₹2789 – ₹2,879.1 |
| TITAN | ₹3470 (2.59%) | ₹3390 – ₹3,477.1 |
| Larsen Toubro | ₹3702 (1.97%) | ₹3635 – ₹3,715.89 |
Nifty 50 Top Losers
| Stock | Close | Range |
|---|---|---|
| Hindustan Unilever | ₹2489 (-1.57%) | ₹2,446.44 – ₹2,505.8 |
| Axis Bank | ₹1,174.65 (-1.12%) | ₹1,173.44 – ₹1202 |
| Britannia | ₹5,379.45 (-1.11%) | ₹5,341.7 – ₹5,449.95 |
| Eicher Motors | ₹4,801.5 (-1.02%) | ₹4768 – ₹4,889.6 |
| Tata Consumer Products | ₹1114 (-0.95%) | ₹1,104.05 – ₹1133 |
Nifty 50 Stocks To Watch for Tomorrow
➲ Apollo Hospitals (Bullish Pattern)
- Price Performance: Apollo Hospitals has recorded gains in 15 of the past 27 trading sessions. This positive performance equates to a 1.31% return on investment. A hypothetical investment of ₹10,000 would now be worth ₹10,131.
- Recent Trend: The stock has been on a 6-day green streak, with no red days since Tuesday, June 4, 2024.
- Financial Strength: In the last 12 months, Apollo Hospitals has achieved a revenue of ₹19,059.19 Crore . The company’s profit during this period amounted to ₹898.6 Crore.
- Market Metrics: As of Wednesday, June 12, 2024, Apollo Hospitals has a Market Capital of ₹86,303.34 Crore.
- Investment Outlook: Apollo Hospitals presents a compelling bullish trend, signaling potential growth opportunities for investors. Interested individuals can further explore the company’s performance through our short-term targets and long-term targets for 2024 & 2025.
Apollo Hospitals Financial Performance
| Metric | Value | Description |
|---|---|---|
| Market Capital | 86,303.34 Crore | Market valuation of Apollo Hospitals’s shares. |
| Revenue (TTM) | 19,059.19 Crore | Total revenue generated by Apollo Hospitals over the past twelve months. |
| Net Income (TTM) | +898.6 Crore | Net Profit or Loss after all the expenses over the past twelve months. |
| Operating Margin | 9.11% | Income from operations as a percentage of revenue, before taxes and interest. |
| Profit Margin | 4.71% | Net income as a percentage of revenue, after all expenses. |
| Revenue Growth (Quarterly) | +14.89% | Change in revenue compared to the previous quarter. |
| Earnings Growth (YOY Quarterly) | +75.59% | Change in earnings compared to the same quarter last year. |
| Debt-to-Equity (D/E) Ratio | 72.84 | Company’s total debt divided by total shareholder equity. |
| Total Debt | 5,332.6 Crore | Sum of Apollo Hospitals’s current & long-term financial obligations. |
| Total Cash | 1,617.79 Crore | Total amount of liquid funds available to Apollo Hospitals. |
| Beta | 0.56 | Beta is less than 1 indicating that the Apollo Hospitals’s price is less volatile than the market. |
➲ Hindustan Unilever (Bearish Pattern)
- Performance Overview: In the past 27 trading sessions, Hindustan Unilever has closed in the red for 15 sessions and closed in the green for 12.
- Recent Trend: Hindustan Unilever has been on a 3-day red streak, without a single day closing in the green since Friday, June 7th, 2024.
- Returns: Hindustan Unilever has provided a return of 11.71% over the past 27 trading sessions, which means an investment of ₹10,000 would have grown to ₹11,171.
- Financial Insight: Over the past 12 months, Hindustan Unilever has generated a revenue of ₹61,895.99 Crore and a profit of ₹10,276.99 Crore.
- As of Wednesday, June 12th, 2024, Hindustan Unilever has a Market Capital of ₹6,05,700.54 Crore.
- Summary: Hindustan Unilever is currently experiencing a bearish trend. Investors should be cautious and closely monitor the stock’s movement, particularly its Tomorrow’s Target and Targets for 2024 & 2025.
Hindustan Unilever Financial Performance
| Metric | Value | Description |
|---|---|---|
| Market Capital | 6,05,700.54 Crore | Market valuation of Hindustan Unilever’s shares. |
| Revenue (TTM) | 61,895.99 Crore | Total revenue generated by Hindustan Unilever over the past twelve months. |
| Net Income (TTM) | +10,276.99 Crore | Net Profit or Loss after all the expenses over the past twelve months. |
| Operating Margin | 20.92% | Income from operations as a percentage of revenue, before taxes and interest. |
| Profit Margin | 16.6% | Net income as a percentage of revenue, after all expenses. |
| Revenue Growth (Quarterly) | -1.66% | Change in revenue compared to the previous quarter. |
| Earnings Growth (YOY Quarterly) | -1.6% | Change in earnings compared to the same quarter last year. |
| Debt-to-Equity (D/E) Ratio | 2.88 | Company’s total debt divided by total shareholder equity. |
| Total Debt | 1,484 Crore | Sum of Hindustan Unilever’s current & long-term financial obligations. |
| Total Cash | 11,888.99 Crore | Total amount of liquid funds available to Hindustan Unilever. |
| Beta | 0.07 | Beta is less than 1 indicating that the Hindustan Unilever’s price is less volatile than the market. |
Nifty 500 Performance Overview
The Nifty 500 commenced the day at ₹21,934.34. During the trading session, it witnessed fluctuations, recording a low of ₹21,905.19 and a high of ₹22,023.59. Finally, it concluded at ₹21,952.94, reflecting a 0.46% gain.
Refer to the provided table to discover the notable gainers and losers that impacted today’s Nifty 500 performance.
Nifty 500 Top Gainers
| Stock | Close | Range |
|---|---|---|
| Shree Renuka Sugars | ₹49.41 (11.88%) | ₹44.95 – ₹49.95 |
| Delta Corp | ₹135.28 (11.4%) | ₹121.6 – ₹138.88 |
| Oracle Financial Services Software | ₹9700 (10.94%) | ₹8802 – ₹9760 |
| Usha Martin | ₹413.5 (9.31%) | ₹375 – ₹423.95 |
| Aegis Logistics | ₹836.25 (9.1%) | ₹767.15 – ₹887.5 |
Nifty 500 Top Losers
| Stock | Close | Range |
|---|---|---|
| Sanofi India | ₹6,513.04 (-35.34%) | ₹5,892.79 – ₹6,513.04 |
| Brightcom Group | ₹9.38 (-5.07%) | ₹9.38 – ₹9.38 |
| Aavas Financiers | ₹1846 (-3.23%) | ₹1,823.05 – ₹1,920.94 |
| Marico | ₹610.79 (-2.98%) | ₹605.34 – ₹635 |
| G R Infra | ₹1,665.84 (-2.81%) | ₹1,657.8 – ₹1,725.15 |
Nifty 51 to 500 Stocks To Watch for Tomorrow
➲ V-Mart (Bullish Pattern)
- Performance Overview: In the last 27 trading sessions, V-Mart has closed in green 15 times and in red 12 times, indicating an upward trend.
- Recent Trend: V-Mart has been on a 8-day green streak, without a single negative day since Friday, May 31, 2024. This consistent upward movement suggests bullish momentum.
- Returns: V-Mart has delivered impressive returns over the past 27 trading sessions, delivering 33.34% to investors. This means that if you had invested ₹10,000, it would have grown to approximately ₹13,334.
- Financial Performance: Over the past year, V-Mart has shown strong financial performance with a revenue of ₹2,806.54 Crore and a profit of ₹96.76 Crore. This indicates strong fundamental strength and the company’s potential for growth.
- As of Wednesday, June 12, 2024, V-Mart has a Market Capital of ₹4,490.33 Crore.
- Bullish Pattern: V-Mart exhibits a clear bullish pattern, with a series of higher highs and higher lows. This pattern suggests that investors should monitor its price movements closely for both short-term and long-term growth prospects. Checkout V-Mart Target for Tomorrow and V-Mart Targets for 2024 & 2025.
V-Mart Financial Performance
| Metric | Value | Description |
|---|---|---|
| Market Capital | 4,490.33 Crore | Market valuation of V-Mart’s shares. |
| Revenue (TTM) | 2,806.54 Crore | Total revenue generated by V-Mart over the past twelve months. |
| Net Income (TTM) | -96.76 Crore | Net Profit or Loss after all the expenses over the past twelve months. |
| Operating Margin | -3.07% | Income from operations as a percentage of revenue, before taxes and interest. |
| Profit Margin | -3.45% | Net income as a percentage of revenue, after all expenses. |
| Revenue Growth (Quarterly) | +12.6% | Change in revenue compared to the previous quarter. |
| Earnings Growth (YOY Quarterly) | +12.57% | Change in earnings compared to the same quarter last year. |
| Debt-to-Equity (D/E) Ratio | 186.24 | Company’s total debt divided by total shareholder equity. |
| Total Debt | 1,391.25 Crore | Sum of V-Mart’s current & long-term financial obligations. |
| Total Cash | 31.93 Crore | Total amount of liquid funds available to V-Mart. |
| Beta | 0.58 | Beta is less than 1 indicating that the V-Mart’s price is less volatile than the market. |
➲ Allcargo Logistics (Bearish Pattern)
- Performance Overview: In the past 26 trading sessions, Allcargo Logistics has closed in red 15 times and in green 11 times. It’s important to note that the stock has been on a 4-day red streak, with the last green close being on Thu 06 Jun 2024.
- Returns: Over the last 26 trading sessions, Allcargo Logistics has given a -7.88% return, meaning an investment of ₹10,000 would now be worth approximately ₹9,212.
- Financial Snapshot: In the past 12 months, Allcargo Logistics has generated a revenue of ₹13,187.82 Crore and a profit of ₹149.69 Crore. As of Wed 12 Jun 2024, it has a Market Capitalization of ₹6,555.15 Crore.
- Summary: Allcargo Logistics is currently experiencing a bearish trend. Investors should closely monitor the stock, particularly its performance against its Tomorrow’s Target and 2024 & 2025 Targets.
Allcargo Logistics Financial Performance
| Metric | Value | Description |
|---|---|---|
| Market Capital | 6,555.15 Crore | Market valuation of Allcargo Logistics’s shares. |
| Revenue (TTM) | 13,187.82 Crore | Total revenue generated by Allcargo Logistics over the past twelve months. |
| Net Income (TTM) | +149.69 Crore | Net Profit or Loss after all the expenses over the past twelve months. |
| Operating Margin | 5.6% | Income from operations as a percentage of revenue, before taxes and interest. |
| Profit Margin | 1.13% | Net income as a percentage of revenue, after all expenses. |
| Revenue Growth (Quarterly) | +111.9% | Change in revenue compared to the previous quarter. |
| Earnings Growth (YOY Quarterly) | +298.3% | Change in earnings compared to the same quarter last year. |
| Debt-to-Equity (D/E) Ratio | 0.7 | Company’s total debt divided by total shareholder equity. |
| Total Debt | 1,846.14 Crore | Sum of Allcargo Logistics’s current & long-term financial obligations. |
| Beta | 0.84 | Beta is less than 1 indicating that the Allcargo Logistics’s price is less volatile than the market. |
Top Stocks That Created a New All Time High Today
Top Large Cap Stocks That Created a New All Time High Today
Companies with Market Capital more than 20,000 Crores| Stock | Close | New All-Time High (ATH) | Previous ATH | Previous ATH Date |
|---|---|---|---|---|
| Aegis Logistics | 836.25 (+9.1%) | 887.50 (+60.21%) | 553.95 | Thu 18 Apr 2024 |
| Ambuja Cements | 664.50 (-0.63%) | 680.45 (+5.24%) | 646.54 | Wed 24 Apr 2024 |
| Apar Industries | 8511.95 (+4.47%) | 8679.90 (+10.57%) | 7850.00 | Wed 24 Apr 2024 |
| Bharat Forge | 1636.94 (+0.32%) | 1655.00 (+%) | Thu 01 Jan 1970 | |
| Bharti Airtel | 1425.75 (-0.88%) | 1455.94 (+7.76%) | 1351.00 | Tue 23 Apr 2024 |
Top Mid Cap Stocks That Created a New All Time High Today
Companies with Market Capital between 5,000 Crores to 20,000 Crores| Stock | Close | New All-Time High (ATH) | Previous ATH | Previous ATH Date |
|---|---|---|---|---|
| ASK Automotive | 342.29 (+8.15%) | 346.79 (+%) | Thu 01 Jan 1970 | |
| Astra Microwave Products | 926.50 (+4.44%) | 981.00 (+36.21%) | 720.20 | Tue 23 Apr 2024 |
| BASF | 4901.54 (+1.07%) | 4999.00 (+%) | Thu 01 Jan 1970 | |
| Bikaji Foods | 714.75 (+1.5%) | 727.95 (+%) | Thu 01 Jan 1970 | |
| CMS Info Systems | 487.29 (-0.72%) | 502.39 (+%) | Thu 01 Jan 1970 |
Top Small Cap Stocks That Created a New All Time High Today
Companies with Market Capital less than 5,000 Crores| Stock | Close | New All-Time High (ATH) | Previous ATH | Previous ATH Date |
|---|---|---|---|---|
| Aayush Food and Herbs | 279.50 (+2.54%) | 285.89 (+17.96%) | 242.35 | Thu 25 Apr 2024 |
| Ace Software Exports | 249.70 (+1.98%) | 249.70 (+66.15%) | 150.28 | Mon 01 Apr 2024 |
| ACGL | 2374.00 (+6.38%) | 2440.00 (+%) | Thu 01 Jan 1970 | |
| Advait Infratech | 1848.00 (-0.79%) | 1949.00 (+17.22%) | 1662.60 | Mon 01 Apr 2024 |
| Ahmedabad Steelcraft | 84.74 (+1.99%) | 84.74 (+%) | Thu 01 Jan 1970 |