Home / Thu 09 May 2024 Market Recap
9 May 2024: Nifty Drops to ₹21,966.15 (-1.55%) on Energy Losses, While Bajaj Auto & Hero MotoCorp Emerge as Top Gainers with Promising Outlook
Show Table of Contents
Table of Contents
- 1: Top Indices Performance Overview
- 2: Nifty 50 Performance Overview
- 2.1: Nifty 50 Top Gainers
- 2.2: Nifty 50 Top Losers
- 2.3: Nifty 50 Stocks To Watch for Tomorrow
- 2.3.1: ➲ Bajaj Auto (Bullish Pattern)
- 3: Nifty 500 Performance Overview
- 3.1: Nifty 500 Top Gainers
- 3.2: Nifty 500 Top Losers
- 3.3: Nifty 51 to 500 Stocks To Watch for Tomorrow
- 3.3.1: ➲ Bajaj Holdings (Bullish Pattern)
- 4: Top Stocks That Created a New All Time High Today
- 4.1: Top Large Cap Stocks That Created a New All Time High Today
- 4.2: Top Mid Cap Stocks That Created a New All Time High Today
- 4.3: Top Small Cap Stocks That Created a New All Time High Today
Top Indices Performance Overview
| Stock | Close | Range |
|---|---|---|
| NIFTY 50 | ₹21,966.15 (-1.55%) | ₹21,933.84 – ₹22,304.09 |
| NIFTY BANK | ₹47,515.44 (-1.06%) | ₹47,440.64 – ₹48,256.55 |
| NIFTY FIN SERVICE | ₹21,111.75 (-1.61%) | ₹21,073.3 – ₹21,471.9 |
| NIFTY IT | ₹33,145.5 (-0.56%) | ₹33,007.25 – ₹33,454.75 |
| NIFTY AUTO | ₹22,637.94 (0.73%) | ₹22,496.19 – ₹22,994.3 |
| NIFTY ENERGY | ₹38,512.94 (-2.88%) | ₹38,375.6 – ₹39,739.05 |
Nifty 50 Performance Overview
The Nifty 50 commenced the session at ₹22,257.59, navigating a dynamic range of fluctuations throughout the day. It descended to an intraday low of ₹21,933.84 and rose to a high of ₹22,304.09 before concluding at ₹21,966.15, posting a loss of -1.55%.
Stay tuned as we delve into the top performers and underachievers that shaped today’s Nifty 50 movement.
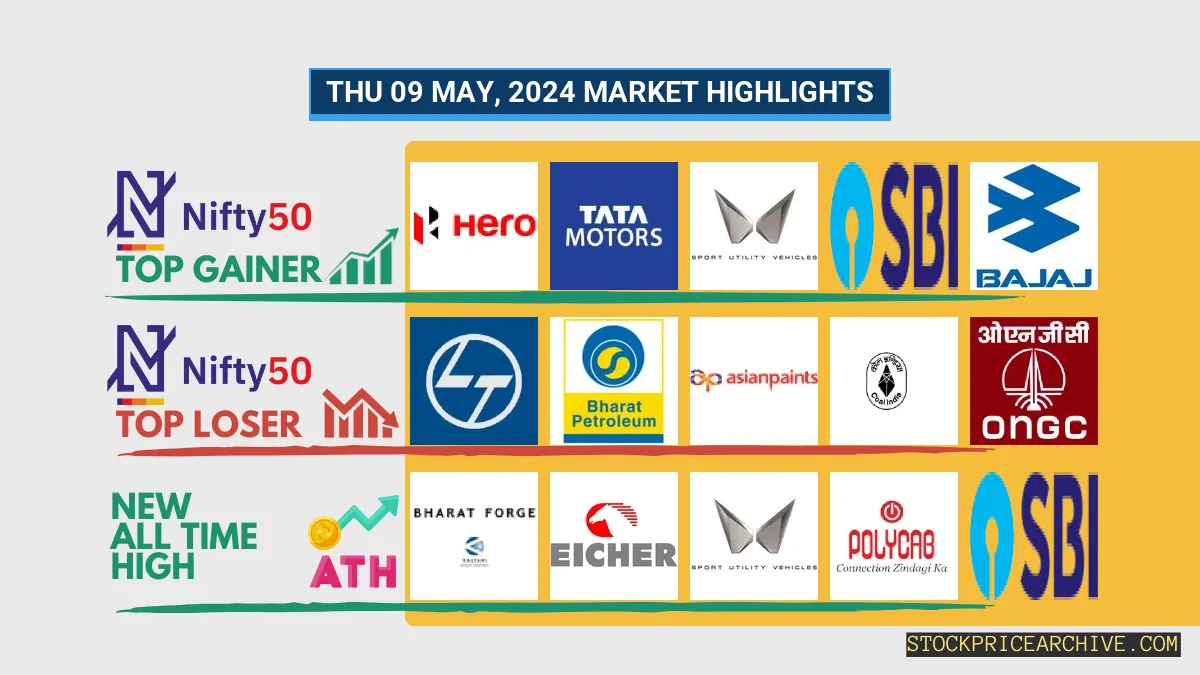
Nifty 50 Top Gainers
| Stock | Close | Range |
|---|---|---|
| Hero MotoCorp | ₹4,760.95 (3.76%) | ₹4,641.35 – ₹4,920.04 |
| Tata Motors | ₹1030 (1.76%) | ₹1008 – ₹1,043.19 |
| Mahindra & Mahindra | ₹2,216.05 (1.48%) | ₹2,186.3 – ₹2,256.64 |
| SBI | ₹819.95 (1.12%) | ₹803.75 – ₹839.5 |
| Bajaj Auto | ₹8845 (1.07%) | ₹8788 – ₹9,001.4 |
Nifty 50 Top Losers
| Stock | Close | Range |
|---|---|---|
| Larsen Toubro | ₹3,289.94 (-5.54%) | ₹3,268.39 – ₹3,376.8 |
| Bharat Petroleum | ₹591.65 (-4.88%) | ₹590.7 – ₹624.45 |
| Asian Paints | ₹2,710.94 (-4.84%) | ₹2,704.5 – ₹2,853.94 |
| Coal India | ₹444 (-4.63%) | ₹441.79 – ₹467.64 |
| ONGC | ₹266.2 (-3.85%) | ₹263.25 – ₹278.04 |
Nifty 50 Stocks To Watch for Tomorrow
➲ Bajaj Auto (Bullish Pattern)
- Performance Overview: Bajaj Auto has been oscillating in the market for the past 24 trading sessions, closing in green 11 times and in red 12 times. This suggests a relatively balanced market sentiment.
- Recent Trend: On a more positive note, Bajaj Auto has displayed a 2-day green streak, without a single day closing in red since Tuesday, May 7, 2024. This indicates a recent upswing in investor confidence.
- Returns: Looking at the returns, Bajaj Auto has experienced a moderate decline of -4.09% in the last 24 trading sessions. This means that an investment of ₹10,000 would have decreased to ₹9,591 during this period.
- Financial Insight: Bajaj Auto’s financial performance in the 2023-Q3 Income Statement showcases a net profit of ₹2,032.62 Crore, indicating the company’s profitability.
- As of Thursday, May 9, 2024, Bajaj Auto holds a substantial Market Capital of ₹2,42,269.63 Crore, reflecting its sizable presence in the market.
- Summary: Considering the recent price movements and financial indicators, Bajaj Auto exhibits a robust bullish pattern. Investors should keep a close eye on its price actions and evaluate both short-term and long-term growth prospects. To gain further insights, explore our in-depth analysis: Bajaj Auto Target for Tomorrow and Bajaj Auto Targets for 2024 & 2025.
Bajaj Auto Financial Performance
| Metric | Value | Description |
|---|---|---|
| Market Capital | 2,42,269.63 Crore | Market valuation of Bajaj Auto’s shares. |
| Revenue (TTM) | 46,306.44 Crore | Total revenue generated by Bajaj Auto over the past twelve months. |
| Net Income (TTM) | +7,708.24 Crore | Net Profit or Loss after all the expenses over the past twelve months. |
| Operating Margin | 21.41% | Income from operations as a percentage of revenue, before taxes and interest. |
| Profit Margin | 16.64% | Net income as a percentage of revenue, after all expenses. |
| Revenue Growth (Quarterly) | +34.3% | Change in revenue compared to the previous quarter. |
| Earnings Growth (YOY Quarterly) | +18% | Change in earnings compared to the same quarter last year. |
| Debt-to-Equity (D/E) Ratio | 6.16 | Company’s total debt divided by total shareholder equity. |
| Total Debt | 1,785.9 Crore | Sum of Bajaj Auto’s current & long-term financial obligations. |
| Total Cash | 6,386.91 Crore | Total amount of liquid funds available to Bajaj Auto. |
| Beta | 0.9 | Beta is less than 1 indicating that the Bajaj Auto’s price is less volatile than the market. |
Nifty 500 Performance Overview
The Nifty 500 commenced trading at ₹20,691.68. During the session, it fluctuated, touching a low of ₹20,320.15 and a high of ₹20,735.3, before concluding the day at ₹20,354.34, a decline of 1.74%.
Let’s examine the notable gainers and losers that shaped today’s Nifty 500 movement.
Nifty 500 Top Gainers
| Stock | Close | Range |
|---|---|---|
| SKF India | ₹4932 (7.88%) | ₹4842 – ₹5,049.04 |
| Vijaya Diagnostic Centre | ₹727 (7.29%) | ₹683.4 – ₹737 |
| Adani Power | ₹615.2 (5.19%) | ₹587.45 – ₹620.7 |
| One 97 Communications | ₹333 (5%) | ₹310.89 – ₹333 |
| Tata Investment Corporation | ₹6,875.25 (4.99%) | ₹6805 – ₹6,875.25 |
Nifty 500 Top Losers
| Stock | Close | Range |
|---|---|---|
| Piramal Enterprises | ₹813.25 (-9.15%) | ₹811.2 – ₹866.65 |
| Motilal Oswal Financial Services | ₹2150 (-8.16%) | ₹2,139.89 – ₹2360 |
| Manappuram Finance | ₹166.75 (-7.88%) | ₹165.05 – ₹174.2 |
| Orient Electric | ₹214.39 (-6.69%) | ₹213.14 – ₹233 |
| Sterlite Technologies | ₹116.8 (-6.3%) | ₹115.5 – ₹123.85 |
Nifty 51 to 500 Stocks To Watch for Tomorrow
➲ Bajaj Holdings (Bullish Pattern)
- Performance Overview: In the last 24 trading sessions, Bajaj Holdings has closed in green 12 times (50%) and in red 12 times (50%).
- Recent Trend: Bajaj Holdings has been on a 3-day green streak, without a single day closing in red since Monday, May 6, 2024.
- Returns: Bajaj Holdings gave a -1.54% return in the last 24 trading sessions, meaning an investment of ₹10,000 would have become ₹9,846
- Financial Insight: Bajaj Holdings reported a net profit of ₹1,644.92 Crore in their 2023-Q3 Income Statement.
- As of Thursday, May 9, 2024, Bajaj Holdings has a Market Capital of ₹92,146.42 Crore.
- Summary: Bajaj Holdings exhibits a robust bullish pattern. Investors should monitor its price movements for both short-term and long-term growth prospects: Checkout Bajaj Holdings Target for Tomorrow and Bajaj Holdings Targets for 2024 & 2025.
Bajaj Holdings Financial Performance
| Metric | Value | Description |
|---|---|---|
| Market Capital | 92,146.42 Crore | Market valuation of Bajaj Holdings’s shares. |
| Revenue (TTM) | 1,713.46 Crore | Total revenue generated by Bajaj Holdings over the past twelve months. |
| Net Income (TTM) | +7,267.21 Crore | Net Profit or Loss after all the expenses over the past twelve months. |
| Operating Margin | 96.43% | Income from operations as a percentage of revenue, before taxes and interest. |
| Profit Margin | 424.12% | Net income as a percentage of revenue, after all expenses. |
| Revenue Growth (Quarterly) | +1058.3% | Change in revenue compared to the previous quarter. |
| Earnings Growth (YOY Quarterly) | +100.8% | Change in earnings compared to the same quarter last year. |
| Debt-to-Equity (D/E) Ratio | 0.09 | Company’s total debt divided by total shareholder equity. |
| Total Debt | 62.56 Crore | Sum of Bajaj Holdings’s current & long-term financial obligations. |
| Total Cash | 53.96 Crore | Total amount of liquid funds available to Bajaj Holdings. |
| Beta | 0.61 | Beta is less than 1 indicating that the Bajaj Holdings’s price is less volatile than the market. |
Top Stocks That Created a New All Time High Today
Top Large Cap Stocks That Created a New All Time High Today
Companies with Market Capital more than 20,000 Crores| Stock | Close | New All-Time High (ATH) | Previous ATH | Previous ATH Date |
|---|---|---|---|---|
| Bharat Forge | 1408.75 (+0.25%) | 1462.94 (+%) | Thu 01 Jan 1970 | |
| Eicher Motors | 4573.20 (-0.59%) | 4706.70 (+2.95%) | 4571.64 | Wed 24 Apr 2024 |
| Mahindra & Mahindra | 2216.05 (+1.48%) | 2256.64 (+7.02%) | 2108.60 | Wed 10 Apr 2024 |
| Polycab India | 5828.10 (-1.58%) | 5949.00 (+%) | Thu 01 Jan 1970 | |
| SBI | 819.95 (+1.12%) | 839.50 (+5.81%) | 793.40 | Thu 07 Mar 2024 |
Top Mid Cap Stocks That Created a New All Time High Today
Companies with Market Capital between 5,000 Crores to 20,000 Crores| Stock | Close | New All-Time High (ATH) | Previous ATH | Previous ATH Date |
|---|---|---|---|---|
| CEBBCO | 422.60 (+3.52%) | 448.64 (+3.42%) | 433.80 | Mon 01 Jan 2024 |
| Ingersoll Rand | 4310.00 (-1.95%) | 4469.95 (+11.19%) | 4020.10 | Thu 18 Apr 2024 |
| Jupiter Wagons | 426.00 (+4.34%) | 448.75 (+3.39%) | 434.00 | Tue 23 Jan 2024 |
| Kirloskar Brothers | 1342.75 (-2.77%) | 1430.00 (+8.13%) | 1322.44 | Wed 24 Apr 2024 |
| Kirloskar Oil Engines | 1053.00 (+1.83%) | 1169.94 (+%) | Thu 01 Jan 1970 |
Top Small Cap Stocks That Created a New All Time High Today
Companies with Market Capital less than 5,000 Crores| Stock | Close | New All-Time High (ATH) | Previous ATH | Previous ATH Date |
|---|---|---|---|---|
| Aayush Food and Herbs | 279.79 (+1.98%) | 279.80 (+15.45%) | 242.35 | Thu 25 Apr 2024 |
| ABIRAFN | 77.13 (+4.99%) | 77.13 (+54.97%) | 49.77 | Thu 25 Apr 2024 |
| Ace Software Exports | 158.80 (+1.99%) | 158.80 (+5.66%) | 150.28 | Mon 01 Apr 2024 |
| AMBO AGRITEC LIMITED | 51.50 (-1.35%) | 56.00 (+%) | Thu 01 Jan 1970 | |
| ASHSI | 61.99 (+19.99%) | 61.99 (+%) | Thu 01 Jan 1970 |