Home / Fri 19 Jul 2024 Market Recap
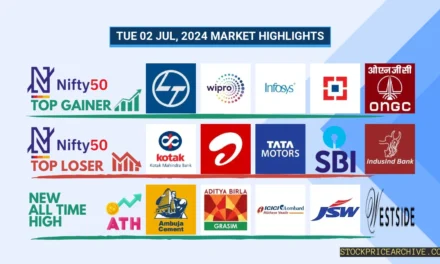
19 Jul 2024: Nifty 50 Closes at ₹24,530.9 (-1.09%), ITC [Bullish] closing higher for the past 6 days, HDFC Bank [Bearish] closing lower for the past 4 days
![19 Jul 2024: Nifty 50 Closes at ₹24,530.9 (-1.09%), ITC [Bullish] closing higher for the past 6 days, HDFC Bank [Bearish] closing lower for the past 4 days](https://stockpricearchive.com/wp-content/uploads/2024/07/fri-19-jul-2024-market-highlights.webp)
Show Table of Contents
Table of Contents
- 1: Top Indices Performance Overview
- 2: Nifty 50 Performance Overview
- 2.1: Nifty 50 Top Gainers
- 2.2: Nifty 50 Top Losers
- 2.3: Nifty 50 Stocks To Watch for Tomorrow
- 2.3.1: ➲ ITC (Strong Upward Trend)
- 2.3.2: ➲ HDFC BANK (Showing Bearish Signs)
- 3: Nifty 500 Performance Overview
- 3.1: Nifty 500 Top Gainers
- 3.2: Nifty 500 Top Losers
- 3.3: Nifty 51 to 500 Stocks To Watch for Tomorrow
- 3.3.1: Karur Vysya Bank (Bullish Pattern)
- 3.3.2: ➲ Chalet Hotels (Showing Bearish Signs)
- 4: Top Stocks That Created a New All Time High Today
- 4.1: Top Large Cap Stocks That Created a New All Time High Today
- 4.2: Top Mid Cap Stocks That Created a New All Time High Today
- 4.3: Top Small Cap Stocks That Created a New All Time High Today
Top Indices Performance Overview
| Stock | Close | Range |
|---|---|---|
| NIFTY 50 | ₹24,530.9 (-1.09%) | ₹24,508.15 – ₹24,854.8 |
| NIFTY BANK | ₹52,221.6 (-0.76%) | ₹52,146.3 – ₹52,586.75 |
| NIFTY FIN SERVICE | ₹23,575.3 (-0.88%) | ₹23,569.44 – ₹23,761.44 |
| NIFTY IT | ₹39,866.44 (-0.36%) | ₹39,833.85 – ₹40,589.35 |
| NIFTY AUTO | ₹24,971.05 (-2.37%) | ₹24,931.8 – ₹25,569.15 |
| NIFTY ENERGY | ₹42,113.5 (-2.6%) | ₹41,974.05 – ₹43,245.14 |
Nifty 50 Performance Overview
The Nifty 50 started the day at ₹24,853.8, showing some volatility throughout the trading session. It dipped to a low of ₹24,508.15 before climbing back up to a high of ₹24,854.8. Ultimately, it closed the day at ₹24,530.9, down 1.09% from its opening price.
Keep an eye on the top gainers and losers, as they played a key role in shaping the Nifty 50’s movement today.
Nifty 50 Top Gainers
| Stock | Close | Range |
|---|---|---|
| Infosys | ₹1,792.94 (1.98%) | ₹1,786.44 – ₹1844 |
| ITC | ₹474.54 (0.91%) | ₹469.39 – ₹479.39 |
| Asian Paints | ₹2949 (0.59%) | ₹2918 – ₹2,979.94 |
| HCL | ₹1,594.75 (0.01%) | ₹1,588.59 – ₹1,616.44 |
| Britannia | ₹5870 (-0.03%) | ₹5860 – ₹5,977.29 |
Nifty 50 Top Losers
| Stock | Close | Range |
|---|---|---|
| Tata Steel | ₹158.1 (-4.97%) | ₹157.19 – ₹166.09 |
| JSW Steel | ₹889.45 (-4.51%) | ₹886.54 – ₹927.5 |
| Bharat Petroleum | ₹305.04 (-4.12%) | ₹301.79 – ₹316 |
| Hindalco | ₹662 (-4.06%) | ₹658.65 – ₹685.7 |
| UltraTech Cement | ₹11240 (-3.5%) | ₹11,228.65 – ₹11645 |
Nifty 50 Stocks To Watch for Tomorrow
➲ ITC (Strong Upward Trend)
- Recent Performance: Over the last 25 trading days, ITC has closed higher on 16 occasions and lower on 8. This shows a positive trend overall.
- Current Streak: ITC has enjoyed a strong upward trend, closing higher for the past 6 trading days, with no dips since Wednesday, July 10th, 2024.
- Returns: Investing ₹10,000 in ITC over the last 25 trading days would have yielded a return of 8.61%, bringing your total investment to ₹10,861.
- Financial Snapshot: ITC has demonstrated financial strength, generating ₹70,880.99 Crore in revenue and ₹20,458.77 Crore in profit over the past 12 months.
- As of Friday, July 19th, 2024, ITC boasts a substantial Market Capital of ₹5,72,821.75 Crore.
- In Summary: ITC is exhibiting a positive and robust upward trend. Investors might want to keep a close eye on its price movements for both short-term and long-term growth possibilities. Check out ITC Target for Tomorrow and ITC Targets for 2024 & 2025 to learn more.
ITC Financial Performance
| Metric | Value | Description |
|---|---|---|
| Market Capital | 5,72,821.75 Crore | Market valuation of ITC’s shares. |
| Revenue (TTM) | 70,880.99 Crore | Total revenue generated by ITC over the past twelve months. |
| Net Income (TTM) | +20,458.77 Crore | Net Profit or Loss after all the expenses over the past twelve months. |
| Operating Margin | 34.08% | Income from operations as a percentage of revenue, before taxes and interest. |
| Profit Margin | 28.86% | Net income as a percentage of revenue, after all expenses. |
| Revenue Growth (Quarterly) | +1.6% | Change in revenue compared to the previous quarter. |
| Earnings Growth (YOY Quarterly) | -1.1% | Change in earnings compared to the same quarter last year. |
| Debt-to-Equity (D/E) Ratio | 0.4 | Company’s total debt divided by total shareholder equity. |
| Total Debt | 303.72 Crore | Sum of ITC’s current & long-term financial obligations. |
| Total Cash | 19,903.92 Crore | Total amount of liquid funds available to ITC. |
| Beta | 0.25 | Beta is less than 1 indicating that the ITC’s price is less volatile than the market. |
➲ HDFC BANK (Showing Bearish Signs)
- Performance Overview: Over the past 25 trading days, HDFC BANK has closed lower than the previous day 13 times and higher 12 times.
- Recent Trend: HDFC BANK has been on a downward trend for the last four days, with no gains since Friday, July 12, 2024.
- Returns: HDFC BANK has delivered a modest 1.52% return over the last 25 trading sessions. This means that if you had invested ₹10,000, your investment would have grown to ₹10,152.
- Financial Insight: Over the last year, HDFC BANK has generated a revenue of ₹2,28,837.94 Crore and a profit of ₹64,062.04 Crore.
- As of Friday, July 19, 2024, HDFC BANK has a Market Capital of ₹12,33,959.41 Crore.
- Summary: HDFC BANK is currently showing bearish signs. Keep a close eye on the stock, especially the HDFC BANK Target for Tomorrow and HDFC BANK Targets for 2024 & 2025.
HDFC BANK Financial Performance
| Metric | Value | Description |
|---|---|---|
| Market Capital | 12,33,959.41 Crore | Market valuation of HDFC BANK’s shares. |
| Revenue (TTM) | 2,28,837.94 Crore | Total revenue generated by HDFC BANK over the past twelve months. |
| Net Income (TTM) | +64,062.04 Crore | Net Profit or Loss after all the expenses over the past twelve months. |
| Operating Margin | 26.55% | Income from operations as a percentage of revenue, before taxes and interest. |
| Profit Margin | 27.99% | Net income as a percentage of revenue, after all expenses. |
| Revenue Growth (Quarterly) | +113.19% | Change in revenue compared to the previous quarter. |
| Earnings Growth (YOY Quarterly) | +39.9% | Change in earnings compared to the same quarter last year. |
| Debt-to-Equity (D/E) Ratio | 1.62 | Company’s total debt divided by total shareholder equity. |
| Total Debt | 7,30,615.46 Crore | Sum of HDFC BANK’s current & long-term financial obligations. |
| Total Cash | 2,28,834.51 Crore | Total amount of liquid funds available to HDFC BANK. |
| Beta | 0.83 | Beta is less than 1 indicating that the HDFC BANK’s price is less volatile than the market. |
Nifty 500 Performance Overview
The Nifty 500 started the day at ₹23,224.55. It saw some ups and downs throughout the trading session, reaching a high of ₹23,224.59 and a low of ₹22,833.34 before closing at ₹22,840.4 (-1.6%).
This movement was influenced by a few key stocks, with some showing gains and others taking a dip. You can find the top gainers and losers in the table below.
Nifty 500 Top Gainers
| Stock | Close | Range |
|---|---|---|
| Rail Vikas Nigam | ₹613.79 (4.71%) | ₹570.29 – ₹637.9 |
| Tata Teleservices | ₹100.7 (3.48%) | ₹93.4 – ₹111.4 |
| Teamlease Services | ₹2,930.25 (2.96%) | ₹2,837.1 – ₹3019 |
| Zydus Wellness | ₹2191 (2.45%) | ₹2,103.05 – ₹2,195.1 |
| One 97 Communications | ₹455 (2.18%) | ₹425.6 – ₹471.95 |
Nifty 500 Top Losers
| Stock | Close | Range |
|---|---|---|
| Apar Industries | ₹7990 (-7.06%) | ₹7,941.5 – ₹8,606.45 |
| JK Paper | ₹549 (-6.55%) | ₹546 – ₹599 |
| Cummins India | ₹3550 (-6.51%) | ₹3,549.6 – ₹3,833.89 |
| Amber Enterprises | ₹4144 (-6.43%) | ₹4,089.94 – ₹4,442.1 |
| Mastek | ₹2,628.05 (-6.41%) | ₹2620 – ₹2820 |
Nifty 51 to 500 Stocks To Watch for Tomorrow
Karur Vysya Bank (Bullish Pattern)
- Performance Overview: Over the past 25 trading days, Karur Vysya Bank has closed higher 12 times and lower 13 times.
- Recent Trend: Karur Vysya Bank has been on a 6-day winning streak, closing higher each day since Wednesday, July 10, 2024.
- Returns: Karur Vysya Bank has yielded a -0.13% return over the last 25 trading days. This means an investment of ₹10,000 would have become ₹9,987.
- Financial Insight: Over the past year, Karur Vysya Bank has generated revenue of ₹4,738.94 Crore and recorded a profit of ₹1,604.81 Crore.
- As of Friday, July 19, 2024, Karur Vysya Bank has a Market Capital of ₹15,692.25 Crore.
- Summary: Karur Vysya Bank shows a strong bullish pattern. Investors should keep an eye on its price movements to identify potential short-term and long-term growth opportunities: Checkout Karur Vysya Bank Target for Tomorrow and Karur Vysya Bank Targets for 2024 & 2025.
Karur Vysya Bank Financial Performance
| Metric | Value | Description |
|---|---|---|
| Market Capital | 15,692.25 Crore | Market valuation of Karur Vysya Bank’s shares. |
| Revenue (TTM) | 4,738.94 Crore | Total revenue generated by Karur Vysya Bank over the past twelve months. |
| Net Income (TTM) | +1,604.81 Crore | Net Profit or Loss after all the expenses over the past twelve months. |
| Operating Margin | 43.09% | Income from operations as a percentage of revenue, before taxes and interest. |
| Profit Margin | 33.86% | Net income as a percentage of revenue, after all expenses. |
| Revenue Growth (Quarterly) | +33% | Change in revenue compared to the previous quarter. |
| Earnings Growth (YOY Quarterly) | +35% | Change in earnings compared to the same quarter last year. |
| Debt-to-Equity (D/E) Ratio | 0.24 | Company’s total debt divided by total shareholder equity. |
| Total Debt | 2,478.34 Crore | Sum of Karur Vysya Bank’s current & long-term financial obligations. |
| Total Cash | 5,658.56 Crore | Total amount of liquid funds available to Karur Vysya Bank. |
| Beta | 0.91 | Beta is less than 1 indicating that the Karur Vysya Bank’s price is less volatile than the market. |
➲ Chalet Hotels (Showing Bearish Signs)
- Performance Snapshot: Over the last 25 trading days, Chalet Hotels has closed lower than the previous day’s price 19 times. It closed higher on 6 days.
- Recent Trend: Chalet Hotels has been on a downward trend for the past 11 days, without a single day of gain since Wednesday, July 3, 2024.
- Returns: If you had invested ₹10,000 in Chalet Hotels over the past 25 trading days, your investment would have decreased to ₹9,004, representing a return of -9.96%.
- Financial Insight: In the past 12 months, Chalet Hotels generated revenue of ₹1,417.25 Crore and recorded a profit of ₹278.16 Crore.
- As of Friday, July 19, 2024, Chalet Hotels has a Market Capital of ₹18,298.23 Crore.
- Summary: Chalet Hotels is currently facing a challenging period. It’s important to stay informed about its performance. You can check out the potential target for tomorrow and potential targets for the rest of 2024 and 2025 to stay updated.
Chalet Hotels Financial Performance
| Metric | Value | Description |
|---|---|---|
| Market Capital | 18,298.23 Crore | Market valuation of Chalet Hotels’s shares. |
| Revenue (TTM) | 1,417.25 Crore | Total revenue generated by Chalet Hotels over the past twelve months. |
| Net Income (TTM) | +278.16 Crore | Net Profit or Loss after all the expenses over the past twelve months. |
| Operating Margin | 34.84% | Income from operations as a percentage of revenue, before taxes and interest. |
| Profit Margin | 19.62% | Net income as a percentage of revenue, after all expenses. |
| Revenue Growth (Quarterly) | +22.5% | Change in revenue compared to the previous quarter. |
| Earnings Growth (YOY Quarterly) | +124.5% | Change in earnings compared to the same quarter last year. |
| Debt-to-Equity (D/E) Ratio | 162.36 | Company’s total debt divided by total shareholder equity. |
| Total Debt | 3,005.18 Crore | Sum of Chalet Hotels’s current & long-term financial obligations. |
| Total Cash | 133.1 Crore | Total amount of liquid funds available to Chalet Hotels. |
| Beta | 0.35 | Beta is less than 1 indicating that the Chalet Hotels’s price is less volatile than the market. |
Top Stocks That Created a New All Time High Today
Top Large Cap Stocks That Created a New All Time High Today
Companies with Market Capital more than 20,000 Crores| Stock | Close | New All-Time High (ATH) | Previous ATH | Previous ATH Date |
|---|---|---|---|---|
| AIA Engineering | 4270.00 (+1.02%) | 4698.95 (+%) | Thu 01 Jan 1970 | |
| Britannia | 5870.00 (-0.03%) | 5977.29 (+%) | Thu 01 Jan 1970 | |
| Emami | 796.90 (+0.63%) | 813.34 (+%) | Thu 01 Jan 1970 | |
| Godrej Consumer | 1451.90 (-0.92%) | 1476.94 (+%) | Thu 01 Jan 1970 | |
| KPIL | 1342.00 (+1.92%) | 1427.84 (+16.94%) | 1221.00 | Fri 19 Apr 2024 |
Top Mid Cap Stocks That Created a New All Time High Today
Companies with Market Capital between 5,000 Crores to 20,000 Crores| Stock | Close | New All-Time High (ATH) | Previous ATH | Previous ATH Date |
|---|---|---|---|---|
| Manappuram Finance | 217.00 (-4.96%) | 230.39 (+%) | Thu 01 Jan 1970 | |
| Power Mech Projects | 6047.39 (+0.22%) | 6118.00 (+%) | Thu 01 Jan 1970 | |
| UCIL | 195.70 (+1.98%) | 195.70 (+%) | Thu 01 Jan 1970 | |
| VST Industries | 4573.10 (+10.72%) | 4849.75 (+%) | Thu 01 Jan 1970 |
Top Small Cap Stocks That Created a New All Time High Today
Companies with Market Capital less than 5,000 Crores| Stock | Close | New All-Time High (ATH) | Previous ATH | Previous ATH Date |
|---|---|---|---|---|
| Ace Software Exports | 314.95 (+1.99%) | 314.95 (+109.57%) | 150.28 | Mon 01 Apr 2024 |
| Ahmedabad Steelcraft | 135.89 (+1.98%) | 135.89 (+%) | Thu 01 Jan 1970 | |
| Almondz Global Securities | 168.03 (+4.99%) | 168.03 (+%) | Thu 01 Jan 1970 | |
| Ashish Polyplast | 91.63 (-1.99%) | 95.35 (+%) | Thu 01 Jan 1970 | |
| Bits | 5.50 (+1.85%) | 5.50 (+%) | Thu 01 Jan 1970 |