Home / Wed 10 Jul 2024 Market Recap
10 Jul 2024: Nifty Closes at ₹24,312.4 (-0.5%), Dr Reddy’s Lab on 7 days Green Streak. Asian Paints Up +3.14%, Shoppers Stop Up +15.35%, Rail Vikas Nigam Up +13.54%
Show Table of Contents
Table of Contents
- 1: Top Indices Performance Overview
- 2: Nifty 50 Performance Overview
- 2.1: Nifty 50 Top Gainers
- 2.2: Nifty 50 Top Losers
- 2.3: Nifty 50 Stocks To Watch for Tomorrow
- 2.3.1: Dr Reddy’s Lab: A Bullish Stock to Watch
- 2.3.2: LTIMindtree (Bearish Pattern)
- 3: Nifty 500 Performance Overview
- 3.1: Nifty 500 Top Gainers
- 3.2: Nifty 500 Top Losers
- 3.3: Nifty 51 to 500 Stocks To Watch for Tomorrow
- 3.3.1: Colgate Palmolive: A Bullish Trend Emerges
- 3.3.2: ➲ SKF India (Bearish Pattern)
- 4: Top Stocks That Created a New All Time High Today
- 4.1: Top Large Cap Stocks That Created a New All Time High Today
- 4.2: Top Mid Cap Stocks That Created a New All Time High Today
- 4.3: Top Small Cap Stocks That Created a New All Time High Today
Top Indices Performance Overview
| Stock | Close | Range |
|---|---|---|
| NIFTY 50 | ₹24,312.4 (-0.5%) | ₹24,141.8 – ₹24,461.05 |
| NIFTY BANK | ₹52,217.3 (-0.67%) | ₹52,075.39 – ₹52,528.8 |
| NIFTY FIN SERVICE | ₹23,606.8 (-0.24%) | ₹23,478.4 – ₹23,643.75 |
| NIFTY IT | ₹37,280.75 (-1.03%) | ₹37,110.35 – ₹37,824.64 |
| NIFTY AUTO | ₹25,302.8 (-2.02%) | ₹25,094.09 – ₹25,906.09 |
| NIFTY ENERGY | ₹42,675.44 (0.15%) | ₹41,763.19 – ₹42,801.1 |
Nifty 50 Performance Overview
The Nifty 50 started the day at ₹24,451.4, showing some ups and downs throughout the session. It dipped to a low of ₹24,141.8 but managed to climb back up, reaching a high of ₹24,461.05 before settling at ₹24,312.4 for the day, a slight decrease of -0.5%.
The top gainers and losers had a noticeable impact on the Nifty 50’s movement today.
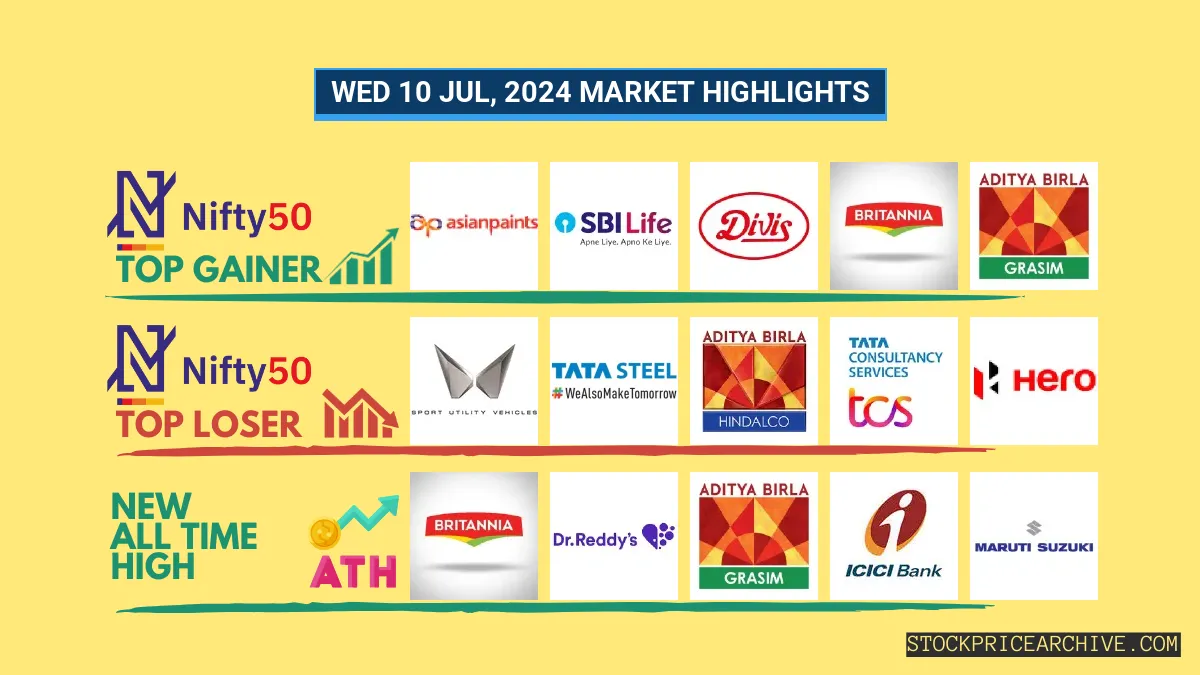
Nifty 50 Top Gainers
| Stock | Close | Range |
|---|---|---|
| Asian Paints | ₹2,996.44 (3.14%) | ₹2,894.35 – ₹3,014.5 |
| SBI Life Insurance | ₹1,558.8 (2.23%) | ₹1,518.59 – ₹1,562.5 |
| Divis Lab | ₹4,636.95 (1.86%) | ₹4,536.79 – ₹4,651.85 |
| Britannia | ₹5,755.54 (1.52%) | ₹5,670.04 – ₹5800 |
| GRASIM | ₹2,802.14 (1.46%) | ₹2741 – ₹2,812.25 |
Nifty 50 Top Losers
| Stock | Close | Range |
|---|---|---|
| Mahindra & Mahindra | ₹2,729.89 (-6.69%) | ₹2698 – ₹2,840.1 |
| Tata Steel | ₹168.2 (-2.1%) | ₹167.02 – ₹172.89 |
| Hindalco | ₹693.29 (-1.94%) | ₹685.29 – ₹712.09 |
| TCS | ₹3913 (-1.82%) | ₹3902 – ₹4,003.3 |
| Hero MotoCorp | ₹5,508.75 (-1.44%) | ₹5,470.6 – ₹5650 |
Nifty 50 Stocks To Watch for Tomorrow
Dr Reddy’s Lab: A Bullish Stock to Watch
- Recent Performance: Over the last 26 trading days, Dr Reddy’s Lab has closed higher 19 times, indicating a positive trend. It’s important to note that the stock also closed lower seven times during this period.
- Hot Streak: Dr Reddy’s Lab has been on a roll, closing higher for the past seven trading days, starting on July 1, 2024. This strong momentum suggests continued investor interest.
- Returns: In the last 26 trading sessions, Dr Reddy’s Lab has provided a 13.52% return. This means that if you had invested ₹10,000, your investment would be worth ₹11,352 today.
- Financial Strength: In the past year, Dr Reddy’s Lab generated a revenue of ₹27,916.39 Crore and earned a profit of ₹5,568.4 Crore. These numbers reflect the company’s solid financial performance.
- Market Standing: As of July 10, 2024, Dr Reddy’s Lab has a market capitalization of ₹1,08,632.32 Crore, a measure of the company’s overall value.
- Outlook: Dr Reddy’s Lab shows a positive and promising trend, attracting investors. For those interested in its potential, consider checking out the short-term and long-term price targets for the company: Dr Reddy’s Lab Target for Tomorrow and Dr Reddy’s Lab Targets for 2024 & 2025.
Dr Reddy Lab Financial Performance
| Metric | Value | Description |
|---|---|---|
| Market Capital | 1,08,632.32 Crore | Market valuation of Dr Reddy Lab’s shares. |
| Revenue (TTM) | 27,916.39 Crore | Total revenue generated by Dr Reddy Lab over the past twelve months. |
| Net Income (TTM) | +5,568.4 Crore | Net Profit or Loss after all the expenses over the past twelve months. |
| Operating Margin | 18.31% | Income from operations as a percentage of revenue, before taxes and interest. |
| Profit Margin | 19.94% | Net income as a percentage of revenue, after all expenses. |
| Revenue Growth (Quarterly) | +12.5% | Change in revenue compared to the previous quarter. |
| Earnings Growth (YOY Quarterly) | +36.29% | Change in earnings compared to the same quarter last year. |
| Debt-to-Equity (D/E) Ratio | 7.13 | Company’s total debt divided by total shareholder equity. |
| Total Debt | 2,002 Crore | Sum of Dr Reddy Lab’s current & long-term financial obligations. |
| Total Cash | 8,146.99 Crore | Total amount of liquid funds available to Dr Reddy Lab. |
| Beta | 0.34 | Beta is less than 1 indicating that the Dr Reddy Lab’s price is less volatile than the market. |
LTIMindtree (Bearish Pattern)
- Performance Overview: Over the past 26 trading days, LTIMindtree has closed higher 14 times and lower 11 times. This indicates some volatility in its recent performance.
- Recent Trend: LTIMindtree has been on a 6-day losing streak, with no gains since Tuesday, July 2, 2024.
- Returns: LTIMindtree has yielded a 15.63% return in the last 26 trading sessions. This means an investment of ₹10,000 would have grown to ₹11,562.99 during that period.
- Financial Insight: In the past 12 months, LTIMindtree generated a revenue of ₹35,516.99 Crore and a profit of ₹4,582.1 Crore. This suggests the company is financially strong and profitable.
- As of Wednesday, July 10, 2024, LTIMindtree has a Market Capitalization of ₹1,60,487.2 Crore. This signifies its significant size and presence in the market.
- Summary: While LTIMindtree is currently experiencing a bearish trend, it’s important to stay informed and observe its performance. We suggest keeping a close eye on the stock’s future direction, especially the LTIMindtree Target for Tomorrow and LTIMindtree Targets for 2024 & 2025.
LTIMindtree Financial Performance
| Metric | Value | Description |
|---|---|---|
| Market Capital | 1,60,487.2 Crore | Market valuation of LTIMindtree’s shares. |
| Revenue (TTM) | 35,516.99 Crore | Total revenue generated by LTIMindtree over the past twelve months. |
| Net Income (TTM) | +4,582.1 Crore | Net Profit or Loss after all the expenses over the past twelve months. |
| Operating Margin | 14.71% | Income from operations as a percentage of revenue, before taxes and interest. |
| Profit Margin | 12.9% | Net income as a percentage of revenue, after all expenses. |
| Revenue Growth (Quarterly) | +2.29% | Change in revenue compared to the previous quarter. |
| Earnings Growth (YOY Quarterly) | -1.2% | Change in earnings compared to the same quarter last year. |
| Debt-to-Equity (D/E) Ratio | 10.33 | Company’s total debt divided by total shareholder equity. |
| Total Debt | 2,070.6 Crore | Sum of LTIMindtree’s current & long-term financial obligations. |
| Total Cash | 9,569.39 Crore | Total amount of liquid funds available to LTIMindtree. |
| Beta | 0.7 | Beta is less than 1 indicating that the LTIMindtree’s price is less volatile than the market. |
Nifty 500 Performance Overview
The Nifty 500 started the day at ₹23,124.15, showing a bit of a rollercoaster ride throughout the session. It dipped to a low of ₹22,685.65 before rallying to a high of ₹23,125.3. In the end, it closed at ₹22,977.65, a slight decrease of 0.39%.
Take a look at the table below to see which stocks were the biggest gainers and losers, influencing the Nifty 500’s movement today.
Nifty 500 Top Gainers
| Stock | Close | Range |
|---|---|---|
| Shoppers Stop | ₹884.9 (15.35%) | ₹767 – ₹920 |
| Rail Vikas Nigam | ₹616.29 (13.54%) | ₹557.75 – ₹618.4 |
| Indigo Paints | ₹1,538.19 (10.65%) | ₹1,390.94 – ₹1560 |
| Rajesh Exports | ₹315.5 (10.16%) | ₹286 – ₹329.45 |
| Pfizer | ₹5005 (6.22%) | ₹4,741.6 – ₹5050 |
Nifty 500 Top Losers
| Stock | Close | Range |
|---|---|---|
| Blue Star | ₹1,711.05 (-7.27%) | ₹1,701.19 – ₹1,872.5 |
| Mahindra & Mahindra | ₹2,729.89 (-6.69%) | ₹2698 – ₹2,840.1 |
| Fertilisers & Chemicals Travancore | ₹1,047.15 (-5.27%) | ₹1,022.9 – ₹1094 |
| Bombay Burmah Trading Corp | ₹2,258.6 (-5.1%) | ₹2215 – ₹2344 |
| Hitachi Energy | ₹12,857.5 (-4.69%) | ₹12,767.25 – ₹13,684.65 |
Nifty 51 to 500 Stocks To Watch for Tomorrow
Colgate Palmolive: A Bullish Trend Emerges
- Performance Overview: Over the past 26 trading sessions, Colgate Palmolive has closed in the green 17 times and in the red 9 times. This indicates a positive overall trend.
- Recent Trend: Colgate Palmolive has been on a strong 10-day winning streak, with no red days since Wednesday, June 26, 2024. This uninterrupted bullish streak suggests a potential for continued growth.
- Returns: In the last 26 trading sessions, Colgate Palmolive has delivered a 12.15% return. This means that an investment of ₹10,000 would have grown to ₹11,215. That’s a healthy return in a relatively short period.
- Financial Insight: Over the past 12 months, Colgate Palmolive has generated a revenue of ₹5,680.42 Crore and a profit of ₹1,323.65 Crore. These strong financial figures point towards the company’s solid performance and its potential to continue delivering value to investors.
- As of Wednesday, July 10, 2024, Colgate Palmolive has a Market Capital of ₹79,161.51 Crore. This indicates the company’s significant size and its strong position in the market.
- Summary: Colgate Palmolive is currently exhibiting a robust bullish pattern. Investors should closely monitor its price movements to capitalize on both short-term and long-term growth opportunities. For insights on potential targets, check out Colgate Palmolive Target for Tomorrow and Colgate Palmolive Targets for 2024 & 2025.
Colgate Palmolive Financial Performance
| Metric | Value | Description |
|---|---|---|
| Market Capital | 79,161.51 Crore | Market valuation of Colgate Palmolive’s shares. |
| Revenue (TTM) | 5,680.42 Crore | Total revenue generated by Colgate Palmolive over the past twelve months. |
| Net Income (TTM) | +1,323.65 Crore | Net Profit or Loss after all the expenses over the past twelve months. |
| Operating Margin | 33.08% | Income from operations as a percentage of revenue, before taxes and interest. |
| Profit Margin | 23.3% | Net income as a percentage of revenue, after all expenses. |
| Revenue Growth (Quarterly) | +10.3% | Change in revenue compared to the previous quarter. |
| Earnings Growth (YOY Quarterly) | +20.1% | Change in earnings compared to the same quarter last year. |
| Debt-to-Equity (D/E) Ratio | 3.82 | Company’s total debt divided by total shareholder equity. |
| Total Debt | 71.74 Crore | Sum of Colgate Palmolive’s current & long-term financial obligations. |
| Total Cash | 888.99 Crore | Total amount of liquid funds available to Colgate Palmolive. |
| Beta | 0.31 | Beta is less than 1 indicating that the Colgate Palmolive’s price is less volatile than the market. |
➲ SKF India (Bearish Pattern)
- Performance Overview: In the past 26 trading sessions, SKF India has closed lower than the previous day 17 times and higher 9 times.
- Recent Trend: SKF India has been on a downward trend for the past 7 days, closing lower each day since Monday, July 1, 2024.
- Returns: Over the last 26 trading sessions, SKF India has experienced a return of -1.96%. This means that if you had invested ₹10,000 in SKF India 26 days ago, your investment would be worth ₹9,804 today.
- Financial Insight: Over the past year, SKF India has generated revenue of ₹4,570.13 Crore and earned a profit of ₹551.8 Crore.
- As of Wednesday, July 10, 2024, SKF India has a Market Capital of ₹30,991.69 Crore.
- Summary: SKF India is currently experiencing a bearish phase, with its price moving lower in recent sessions. We recommend investors stay informed about SKF India’s near-term prospects by checking out the SKF India Target for Tomorrow and SKF India Targets for 2024 & 2025.
SKF India Financial Performance
| Metric | Value | Description |
|---|---|---|
| Market Capital | 30,991.69 Crore | Market valuation of SKF India’s shares. |
| Revenue (TTM) | 4,570.13 Crore | Total revenue generated by SKF India over the past twelve months. |
| Net Income (TTM) | +551.8 Crore | Net Profit or Loss after all the expenses over the past twelve months. |
| Operating Margin | 16.16% | Income from operations as a percentage of revenue, before taxes and interest. |
| Profit Margin | 12.07% | Net income as a percentage of revenue, after all expenses. |
| Revenue Growth (Quarterly) | +9.9% | Change in revenue compared to the previous quarter. |
| Earnings Growth (YOY Quarterly) | +42.2% | Change in earnings compared to the same quarter last year. |
| Debt-to-Equity (D/E) Ratio | 0.43 | Company’s total debt divided by total shareholder equity. |
| Total Debt | 11.76 Crore | Sum of SKF India’s current & long-term financial obligations. |
| Total Cash | 1,222.11 Crore | Total amount of liquid funds available to SKF India. |
| Beta | 0.47 | Beta is less than 1 indicating that the SKF India’s price is less volatile than the market. |
Top Stocks That Created a New All Time High Today
Top Large Cap Stocks That Created a New All Time High Today
Companies with Market Capital more than 20,000 Crores| Stock | Close | New All-Time High (ATH) | Previous ATH | Previous ATH Date |
|---|---|---|---|---|
| Aurobindo Pharma | 1337.09 (+0.35%) | 1344.19 (+%) | Thu 01 Jan 1970 | |
| Bharat Electronics | 333.85 (-0.29%) | 340.50 (+%) | Thu 01 Jan 1970 | |
| Britannia | 5755.54 (+1.52%) | 5800.00 (+%) | Thu 01 Jan 1970 | |
| Dr Reddy Lab | 6592.54 (+0.14%) | 6604.45 (+%) | Thu 01 Jan 1970 | |
| Emami | 769.75 (-0.94%) | 806.04 (+%) | Thu 01 Jan 1970 |
Top Mid Cap Stocks That Created a New All Time High Today
Companies with Market Capital between 5,000 Crores to 20,000 Crores| Stock | Close | New All-Time High (ATH) | Previous ATH | Previous ATH Date |
|---|---|---|---|---|
| CAMS | 4075.64 (+2.2%) | 4327.75 (+%) | Thu 01 Jan 1970 | |
| Concord Biotech | 1702.55 (+0.34%) | 1799.00 (+11.94%) | 1607.00 | Wed 10 Jan 2024 |
| GENUSPOWER | 360.75 (-3.37%) | 381.00 (+%) | Thu 01 Jan 1970 | |
| GMR Power And Urban Infra | 93.57 (-1.24%) | 99.00 (+%) | Thu 01 Jan 1970 | |
| HSCL | 432.85 (+1.69%) | 442.89 (+%) | Thu 01 Jan 1970 |
Top Small Cap Stocks That Created a New All Time High Today
Companies with Market Capital less than 5,000 Crores| Stock | Close | New All-Time High (ATH) | Previous ATH | Previous ATH Date |
|---|---|---|---|---|
| 21ST CENTURY MANAG | 77.95 (+1.98%) | 77.95 (+%) | Thu 01 Jan 1970 | |
| Ace Software Exports | 279.79 (+1.98%) | 279.79 (+86.17%) | 150.28 | Mon 01 Apr 2024 |
| Abans Holdings | 526.95 (+0.03%) | 542.90 (+24.63%) | 435.60 | Wed 10 Apr 2024 |
| Ahmedabad Steelcraft | 120.75 (+1.98%) | 120.75 (+%) | Thu 01 Jan 1970 | |
| AMBALALSA | 70.66 (+15.41%) | 72.50 (+%) | Thu 01 Jan 1970 |