


Home / Tue 02 Jul 2024 Market Recap
02 Jul 2024: Nifty Closes at ₹24,117.8 (-0.1%), GRASIM enjoying a 7-day winning streak, Nifty 500 Dips – Top Stocks & Analysis
Show Table of Contents
Table of Contents
- 1: Top Indices Performance Overview
- 2: Nifty 50 Performance Overview
- 2.1: Nifty 50 Top Gainers
- 2.2: Nifty 50 Top Losers
- 2.3: Nifty 50 Stocks To Watch for Tomorrow
- 2.3.1: ➲ GRASIM (Looking Strong)
- 2.3.2: ➲ Eicher Motors (Recent Bearish Trend)
- 3: Nifty 500 Performance Overview
- 3.1: Nifty 500 Top Gainers
- 3.2: Nifty 500 Top Losers
- 3.3: Nifty 51 to 500 Stocks To Watch for Tomorrow
- 3.3.1: Gujarat Gas (Bullish Pattern)
- 3.3.2: Hindustan Petroleum (Bearish Trend)
- 4: Top Stocks That Created a New All Time High Today
- 4.1: Top Large Cap Stocks That Created a New All Time High Today
- 4.2: Top Mid Cap Stocks That Created a New All Time High Today
- 4.3: Top Small Cap Stocks That Created a New All Time High Today
Top Indices Performance Overview
| Stock | Close | Range |
|---|---|---|
| NIFTY 50 | ₹24,117.8 (-0.1%) | ₹24,058.19 – ₹24,234.19 |
| NIFTY BANK | ₹52,148.1 (-0.82%) | ₹52,000.05 – ₹52,820.3 |
| NIFTY FIN SERVICE | ₹23,490.05 (-0.6%) | ₹23,397.75 – ₹23,745.94 |
| NIFTY IT | ₹37,271.3 (1.09%) | ₹36,963.75 – ₹37,525.44 |
| NIFTY AUTO | ₹25,125.09 (-0.79%) | ₹25,039.59 – ₹25,396.9 |
| NIFTY ENERGY | ₹41,724.35 (0.37%) | ₹41,422.6 – ₹41,933.35 |
Nifty 50 Performance Overview
The Nifty 50 started the day at ₹24,232.44. It had a bit of a roller coaster ride, reaching a high of ₹24,234.19 and dipping down to ₹24,058.19 before settling at ₹24,117.8 (-0.1%) at the end of the trading session.
The top gainers and losers of the day played a key role in the Nifty 50’s movements.
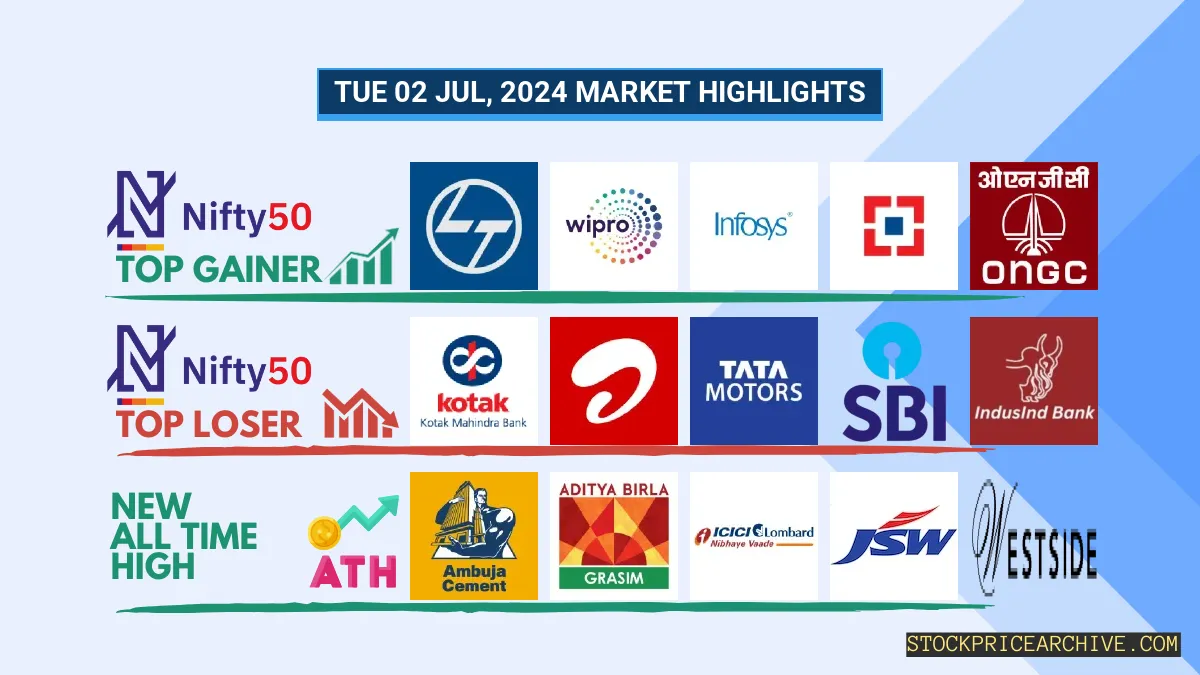
Nifty 50 Top Gainers
| Stock | Close | Range |
|---|---|---|
| Larsen Toubro | ₹3,622.94 (2.73%) | ₹3536 – ₹3,633.39 |
| WIPRO | ₹538.2 (2.05%) | ₹528.29 – ₹545 |
| Infosys | ₹1,618.5 (1.74%) | ₹1,590.05 – ₹1,633.75 |
| HDFC BANK | ₹1728 (1.33%) | ₹1703 – ₹1,734.9 |
| ONGC | ₹275.64 (0.98%) | ₹271.54 – ₹279.75 |
Nifty 50 Top Losers
| Stock | Close | Range |
|---|---|---|
| Kotak Mahindra Bank | ₹1,763.15 (-2.49%) | ₹1,737.19 – ₹1,809.94 |
| Bharti Airtel | ₹1,419.9 (-2.35%) | ₹1,417.05 – ₹1473 |
| Tata Motors | ₹981.29 (-2.08%) | ₹979.09 – ₹1005 |
| SBI | ₹826.15 (-1.88%) | ₹823.15 – ₹846.29 |
| IndusInd Bank | ₹1431 (-1.78%) | ₹1,420.75 – ₹1459 |
Nifty 50 Stocks To Watch for Tomorrow
➲ GRASIM (Looking Strong)
- Recent Performance: Over the past 26 trading days, GRASIM has closed higher 17 times and lower 9 times. This suggests a positive trend overall.
- Positive Momentum: GRASIM has enjoyed a 7-day winning streak, closing higher each day since Friday, June 21, 2024.
- Solid Returns: GRASIM delivered a 12.48% return during the last 26 trading sessions. If you had invested ₹10,000 during this period, it would be worth ₹11,248 today.
- Financially Sound: Over the last 12 months, GRASIM generated a strong revenue of ₹1,30,978.48 Crore and a healthy profit of ₹5,624.48 Crore.
- Market Presence: As of Tuesday, July 2, 2024, GRASIM has a Market Capital of ₹1,84,966.87 Crore, demonstrating its significant presence in the market.
- Outlook: GRASIM is showing positive signs and looks strong. Investors might want to watch its price movements closely to explore both short-term and long-term growth opportunities. Checkout GRASIM Target for Tomorrow and GRASIM Targets for 2024 & 2025 for potential insights.
GRASIM Financial Performance
| Metric | Value | Description |
|---|---|---|
| Market Capital | 1,84,966.87 Crore | Market valuation of GRASIM’s shares. |
| Revenue (TTM) | 1,30,978.48 Crore | Total revenue generated by GRASIM over the past twelve months. |
| Net Income (TTM) | +5,624.48 Crore | Net Profit or Loss after all the expenses over the past twelve months. |
| Operating Margin | 17.39% | Income from operations as a percentage of revenue, before taxes and interest. |
| Profit Margin | 4.29% | Net income as a percentage of revenue, after all expenses. |
| Revenue Growth (Quarterly) | +12.7% | Change in revenue compared to the previous quarter. |
| Earnings Growth (YOY Quarterly) | +0.1% | Change in earnings compared to the same quarter last year. |
| Debt-to-Equity (D/E) Ratio | 98.71 | Company’s total debt divided by total shareholder equity. |
| Total Debt | 1,37,155.05 Crore | Sum of GRASIM’s current & long-term financial obligations. |
| Total Cash | 22,925.35 Crore | Total amount of liquid funds available to GRASIM. |
| Beta | 0.54 | Beta is less than 1 indicating that the GRASIM’s price is less volatile than the market. |
➲ Eicher Motors (Recent Bearish Trend)
- Performance Overview: Over the past 26 trading days, Eicher Motors has closed lower 18 times and higher 8 times.
- Recent Trend: Eicher Motors has been on a downward slide for the past 6 trading days, with no gains since Monday, June 24th, 2024.
- Returns: During this period, Eicher Motors has shown a -4.66% return. This means if you had invested ₹10,000, it would be worth ₹9,534 today.
- Financial Insight: Over the past 12 months, GRASIM has generated a revenue of ₹16,535.77 Crore and a profit of ₹4,001.01 Crore.
- As of Tuesday, July 2nd, 2024, GRASIM has a Market Capital of ₹1,27,358.95 Crore.
- Summary: Eicher Motors is currently experiencing some challenges and has been trending downward recently. It’s wise to keep a close eye on its performance, particularly its potential movement in the short term. You can find projections for tomorrow and for the rest of 2024 and 2025 at the links below. Eicher Motors Target for Tomorrow and Eicher Motors Targets for 2024 & 2025.
Eicher Motors Financial Performance
| Metric | Value | Description |
|---|---|---|
| Market Capital | 1,27,358.95 Crore | Market valuation of Eicher Motors’s shares. |
| Revenue (TTM) | 16,535.77 Crore | Total revenue generated by Eicher Motors over the past twelve months. |
| Net Income (TTM) | +4,001.01 Crore | Net Profit or Loss after all the expenses over the past twelve months. |
| Operating Margin | 22.63% | Income from operations as a percentage of revenue, before taxes and interest. |
| Profit Margin | 24.19% | Net income as a percentage of revenue, after all expenses. |
| Revenue Growth (Quarterly) | +15.4% | Change in revenue compared to the previous quarter. |
| Earnings Growth (YOY Quarterly) | +18.2% | Change in earnings compared to the same quarter last year. |
| Debt-to-Equity (D/E) Ratio | 2.32 | Company’s total debt divided by total shareholder equity. |
| Total Debt | 419.44 Crore | Sum of Eicher Motors’s current & long-term financial obligations. |
| Total Cash | 327.23 Crore | Total amount of liquid funds available to Eicher Motors. |
| Beta | 0.59 | Beta is less than 1 indicating that the Eicher Motors’s price is less volatile than the market. |
Nifty 500 Performance Overview
The Nifty 500 kicked off the day at ₹22,806.05, showing a bit of a rollercoaster ride throughout the session. It dipped to a low of ₹22,592.69 but managed to climb back up, reaching a high of ₹22,809.5. By the closing bell, it settled at ₹22,675, marking a slight decrease of -0.24% for the day.
This movement was influenced by the top gainers and losers among the stocks, which you can see in the table below.
Nifty 500 Top Gainers
| Stock | Close | Range |
|---|---|---|
| JK Paper | ₹633.75 (18.49%) | ₹540.5 – ₹638.75 |
| TV18 Broadcast | ₹45.55 (9.67%) | ₹41.64 – ₹45.68 |
| Solar Industries India | ₹11,019.09 (9.11%) | ₹10,201.2 – ₹11190 |
| EPL | ₹219.89 (8.85%) | ₹203.66 – ₹221.95 |
| Archean Chemical | ₹729.34 (7.11%) | ₹685.9 – ₹742 |
Nifty 500 Top Losers
| Stock | Close | Range |
|---|---|---|
| Oil India | ₹486 (-31.92%) | ₹481.39 – ₹510.89 |
| Angel One | ₹2,359.35 (-8.51%) | ₹2,318.14 – ₹2,443.5 |
| Max Healthcare | ₹914 (-4.38%) | ₹904.25 – ₹952.7 |
| Prism Johnson | ₹169.82 (-4.03%) | ₹169 – ₹177.95 |
| Motilal Oswal Financial Services | ₹568.04 (-3.97%) | ₹564.04 – ₹586.5 |
Nifty 51 to 500 Stocks To Watch for Tomorrow
Gujarat Gas (Bullish Pattern)
- Performance Overview: In the last 26 trading sessions, Gujarat Gas has closed higher 18 times and lower 8 times. This indicates a positive trend for the stock.
- Recent Trend: Gujarat Gas has been on a 7-day green streak, showing consistent growth since Friday, June 21st, 2024.
- Returns: Gujarat Gas delivered a solid 16.02% return in the past 26 trading sessions. If you had invested ₹10,000 during this period, your investment would have grown to ₹11,602.
- Financial Insight: Over the past 12 months, Gujarat Gas has generated a revenue of ₹15,690.19 Crore and a profit of ₹1,143.69 Crore, demonstrating strong financial performance.
- As of Tuesday, July 2nd, 2024, Gujarat Gas has a Market Capital of ₹44,535.39 Crore.
- Summary: Gujarat Gas is showing strong signs of bullish activity. Investors should keep a close eye on its price movements to identify both short-term and long-term opportunities for growth. Checkout Gujarat Gas Target for Tomorrow and Gujarat Gas Targets for 2024 & 2025 to explore potential targets.
Gujarat Gas Financial Performance
| Metric | Value | Description |
|---|---|---|
| Market Capital | 44,535.39 Crore | Market valuation of Gujarat Gas’s shares. |
| Revenue (TTM) | 15,690.19 Crore | Total revenue generated by Gujarat Gas over the past twelve months. |
| Net Income (TTM) | +1,143.69 Crore | Net Profit or Loss after all the expenses over the past twelve months. |
| Operating Margin | 11.36% | Income from operations as a percentage of revenue, before taxes and interest. |
| Profit Margin | 7.28% | Net income as a percentage of revenue, after all expenses. |
| Revenue Growth (Quarterly) | +5.2% | Change in revenue compared to the previous quarter. |
| Earnings Growth (YOY Quarterly) | +10.8% | Change in earnings compared to the same quarter last year. |
| Debt-to-Equity (D/E) Ratio | 1.94 | Company’s total debt divided by total shareholder equity. |
| Total Debt | 150.25 Crore | Sum of Gujarat Gas’s current & long-term financial obligations. |
| Total Cash | 926.12 Crore | Total amount of liquid funds available to Gujarat Gas. |
| Beta | 0.36 | Beta is less than 1 indicating that the Gujarat Gas’s price is less volatile than the market. |
Hindustan Petroleum (Bearish Trend)
- Performance Snapshot: In the last 26 trading sessions (from June 7th, 2024, to July 2nd, 2024), Hindustan Petroleum closed in the red 15 times and in the green 11 times. This tells us that the stock has been a bit volatile lately.
- Recent Movement: Hindustan Petroleum has been on a 8-day downward trend, without a single day closing in the green since Thursday, June 20th, 2024.
- Returns: Hindustan Petroleum has delivered a -39.56% return over the last 26 trading sessions. This means an investment of ₹10,000 would have become ₹6,044.
- Financial Insights: Over the past 12 months, Hindustan Petroleum has generated a revenue of ₹4,32,034.7 Crore and a profit of ₹16,014.6 Crore.
- As of Tuesday, July 2nd, 2024, Hindustan Petroleum has a Market Capital of ₹70,494.67 Crore.
- Summary: Hindustan Petroleum is currently in a bearish phase. It’s important to keep an eye on the stock’s direction, especially considering the recent downward trend. You might want to check out Hindustan Petroleum’s Target for Tomorrow and Hindustan Petroleum Targets for 2024 & 2025 for a more in-depth look.
Hindustan Petroleum Financial Performance
| Metric | Value | Description |
|---|---|---|
| Market Capital | 70,494.67 Crore | Market valuation of Hindustan Petroleum’s shares. |
| Revenue (TTM) | 4,32,034.7 Crore | Total revenue generated by Hindustan Petroleum over the past twelve months. |
| Net Income (TTM) | +16,014.6 Crore | Net Profit or Loss after all the expenses over the past twelve months. |
| Operating Margin | 2.84% | Income from operations as a percentage of revenue, before taxes and interest. |
| Profit Margin | 3.7% | Net income as a percentage of revenue, after all expenses. |
| Revenue Growth (Quarterly) | +7.1% | Change in revenue compared to the previous quarter. |
| Earnings Growth (YOY Quarterly) | -24.9% | Change in earnings compared to the same quarter last year. |
| Debt-to-Equity (D/E) Ratio | 142.11 | Company’s total debt divided by total shareholder equity. |
| Total Debt | 66,683.81 Crore | Sum of Hindustan Petroleum’s current & long-term financial obligations. |
| Total Cash | 5,656.12 Crore | Total amount of liquid funds available to Hindustan Petroleum. |
| Beta | 0.88 | Beta is less than 1 indicating that the Hindustan Petroleum’s price is less volatile than the market. |
Top Stocks That Created a New All Time High Today
Top Large Cap Stocks That Created a New All Time High Today
Companies with Market Capital more than 20,000 Crores| Stock | Close | New All-Time High (ATH) | Previous ATH | Previous ATH Date |
|---|---|---|---|---|
| 3M India | 38760.05 (+2.38%) | 40800.00 (+%) | Thu 01 Jan 1970 | |
| ACC | 2772.25 (+0.82%) | 2843.85 (+%) | Thu 01 Jan 1970 | |
| Ambuja Cements | 693.00 (-0.29%) | 706.79 (+9.31%) | 646.54 | Wed 24 Apr 2024 |
| Century Textile | 2387.50 (+3.66%) | 2419.94 (+24.59%) | 1942.25 | Mon 22 Apr 2024 |
| CIE Automotive India | 601.00 (+2.54%) | 609.84 (+%) | Thu 01 Jan 1970 |
Top Mid Cap Stocks That Created a New All Time High Today
Companies with Market Capital between 5,000 Crores to 20,000 Crores| Stock | Close | New All-Time High (ATH) | Previous ATH | Previous ATH Date |
|---|---|---|---|---|
| Aarti Pharmalabs | 645.20 (+1.57%) | 662.50 (+%) | Thu 01 Jan 1970 | |
| ASK Automotive | 389.85 (+3.23%) | 391.89 (+%) | Thu 01 Jan 1970 | |
| Craftsmen Automation | 5700.00 (+2.22%) | 5791.20 (+%) | Thu 01 Jan 1970 | |
| DOMS Industries | 2142.64 (+1.13%) | 2179.89 (+18.08%) | 1846.00 | Mon 01 Apr 2024 |
| Elecon Engineering | 1353.55 (+1.91%) | 1400.00 (+16.86%) | 1197.94 | Fri 19 Apr 2024 |
Top Small Cap Stocks That Created a New All Time High Today
Companies with Market Capital less than 5,000 Crores| Stock | Close | New All-Time High (ATH) | Previous ATH | Previous ATH Date |
|---|---|---|---|---|
| 21ST CENTURY MANAG | 69.26 (+1.98%) | 69.26 (+%) | Thu 01 Jan 1970 | |
| Ahmedabad Steelcraft | 107.40 (+1.99%) | 107.40 (+%) | Thu 01 Jan 1970 | |
| Alicon Castalloy | 1317.09 (-0.14%) | 1397.90 (+%) | Thu 01 Jan 1970 | |
| Allsec Technologies | 1177.80 (-3.53%) | 1249.44 (+%) | Thu 01 Jan 1970 | |
| AMBO AGRITEC LIMITED | 95.00 (-1.66%) | 101.00 (+%) | Thu 01 Jan 1970 |
![19 Jul 2024: Nifty 50 Closes at ₹24,530.9 (-1.09%), ITC [Bullish] closing higher for the past 6 days, HDFC Bank [Bearish] closing lower for the past 4 days](https://stockpricearchive.com/wp-content/uploads/2024/07/fri-19-jul-2024-market-highlights-440x264.webp)


