Home / Thu 04 Jul 2024 Market Recap
04 Jul 2024: Nifty Closed at ₹24,304.65 (+0.07%), HCL Technologies shows a strong bullish pattern, while TITAN is trending downwards.
Show Table of Contents
Table of Contents
- 1: Top Indices Performance Overview
- 2: Nifty 50 Performance Overview
- 2.1: Nifty 50 Top Gainers
- 2.2: Nifty 50 Top Losers
- 2.3: Nifty 50 Stocks To Watch for Tomorrow
- 2.3.1: HCL Technologies (Bullish Pattern)
- 2.3.2: ➲ TITAN (Bearish Trend)
- 3: Nifty 500 Performance Overview
- 3.1: Nifty 500 Top Gainers
- 3.2: Nifty 500 Top Losers
- 3.3: Nifty 51 to 500 Stocks To Watch for Tomorrow
- 3.3.1: ➲ MphasiS (Looking Strong)
- 3.3.2: ➲ Ashok Leyland (Bearish Pattern)
- 4: Top Stocks That Created a New All Time High Today
- 4.1: Top Large Cap Stocks That Created a New All Time High Today
- 4.2: Top Mid Cap Stocks That Created a New All Time High Today
- 4.3: Top Small Cap Stocks That Created a New All Time High Today
Top Indices Performance Overview
| Stock | Close | Range |
|---|---|---|
| NIFTY 50 | ₹24,304.65 (0.07%) | ₹24,281.19 – ₹24,400.65 |
| NIFTY BANK | ₹53,083.75 (-0.02%) | ₹52,819.39 – ₹53,357.69 |
| NIFTY FIN SERVICE | ₹23,870.19 (-0.23%) | ₹23,810.75 – ₹24,045.94 |
| NIFTY IT | ₹37,728.14 (1.1%) | ₹37,401.69 – ₹37,934.85 |
| NIFTY AUTO | ₹25,395.25 (0.84%) | ₹25,246.75 – ₹25,415.25 |
| NIFTY ENERGY | ₹41,872.3 (0.21%) | ₹41,759.19 – ₹42,128.85 |
Nifty 50 Performance Overview
The Nifty 50 started the day at ₹24,369.59, showing its usual dynamism with some ups and downs throughout the session. It dipped to a low of ₹24,281.19 before rallying to a high of ₹24,400.65. By the closing bell, it had settled at ₹24,304.65, a gain of +0.07% for the day.
Let’s take a look at the top gainers and losers that contributed to the Nifty 50’s performance today.
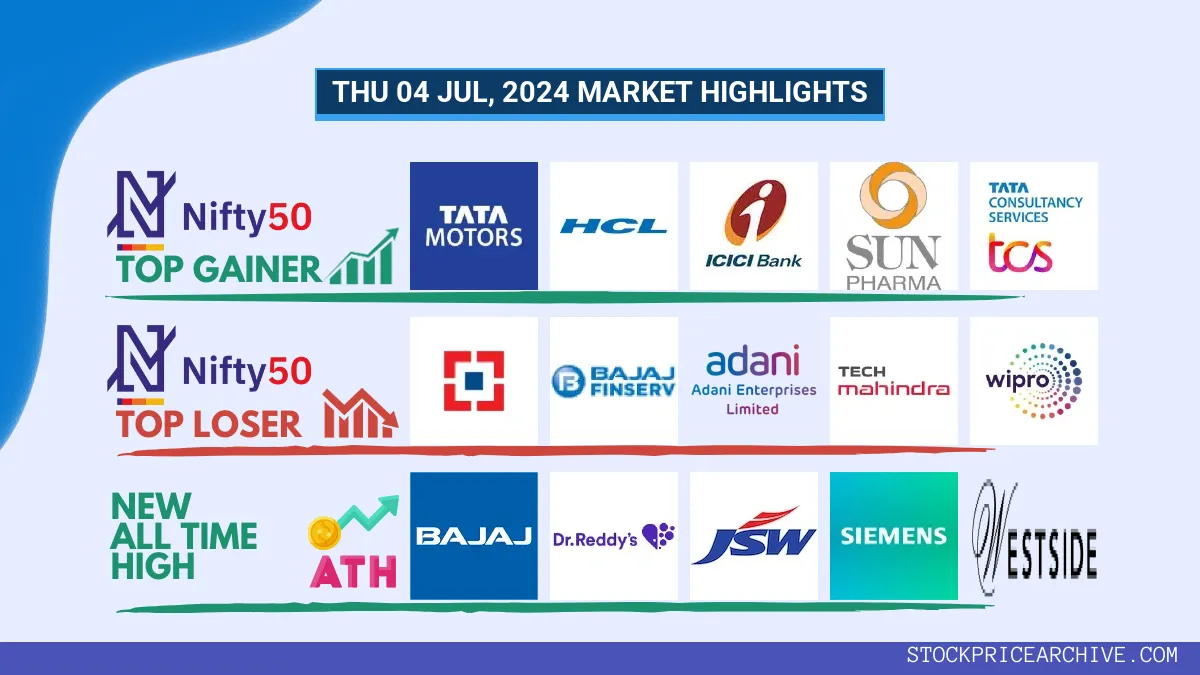
Nifty 50 Top Gainers
| Stock | Close | Range |
|---|---|---|
| Tata Motors | ₹1,002.79 (2.78%) | ₹980 – ₹1004 |
| HCL | ₹1520 (2.63%) | ₹1,487.3 – ₹1,534.34 |
| ICICI BANK | ₹1,231.94 (2.52%) | ₹1,214.55 – ₹1,234.3 |
| Sun Pharma | ₹1,557.9 (1.56%) | ₹1526 – ₹1,570.9 |
| TCS | ₹4,019.94 (1.37%) | ₹3,982.55 – ₹4,047.3 |
Nifty 50 Top Losers
| Stock | Close | Range |
|---|---|---|
| HDFC BANK | ₹1728 (-2.3%) | ₹1,724.94 – ₹1,758.8 |
| Bajaj Finance | ₹7,109.85 (-2.06%) | ₹7,100.1 – ₹7,315.6 |
| Adani Enterprises | ₹3143 (-1.51%) | ₹3,138.69 – ₹3,189.55 |
| Tech Mahindra | ₹1461 (-1.28%) | ₹1,453.55 – ₹1492 |
| WIPRO | ₹532.25 (-1.26%) | ₹529.09 – ₹548.75 |
Nifty 50 Stocks To Watch for Tomorrow
HCL Technologies (Bullish Pattern)
- Performance Overview: Over the past 26 trading days (from June 10th to July 4th, 2024), HCL has closed higher 16 times and lower 10 times.
- Recent Trend: HCL has been on a winning streak, closing higher for the last six consecutive trading days, starting on Wednesday, June 26th, 2024.
- Returns: If you had invested ₹10,000 in HCL 26 trading days ago, your investment would have grown to ₹11,127, representing a return of 11.27%.
- Financial Insight: In the past year, HCL generated a revenue of ₹1,10,844.97 Crore and a profit of ₹15,837.38 Crore.
- As of Thursday, July 4th, 2024, HCL has a market capitalization of ₹3,99,279.57 Crore.
- Summary: HCL’s recent performance indicates a strong bullish trend. Investors may want to consider monitoring its price movements to identify potential opportunities for both short-term and long-term growth. Checkout HCL Target for Tomorrow and HCL Targets for 2024 & 2025.
HCL Financial Performance
| Metric | Value | Description |
|---|---|---|
| Market Capital | 3,99,279.57 Crore | Market valuation of HCL’s shares. |
| Revenue (TTM) | 1,10,844.97 Crore | Total revenue generated by HCL over the past twelve months. |
| Net Income (TTM) | +15,837.38 Crore | Net Profit or Loss after all the expenses over the past twelve months. |
| Operating Margin | 17.6% | Income from operations as a percentage of revenue, before taxes and interest. |
| Profit Margin | 14.28% | Net income as a percentage of revenue, after all expenses. |
| Revenue Growth (Quarterly) | +6% | Change in revenue compared to the previous quarter. |
| Earnings Growth (YOY Quarterly) | -0.2% | Change in earnings compared to the same quarter last year. |
| Debt-to-Equity (D/E) Ratio | 8.45 | Company’s total debt divided by total shareholder equity. |
| Total Debt | 5,780.31 Crore | Sum of HCL’s current & long-term financial obligations. |
| Total Cash | 27,239.29 Crore | Total amount of liquid funds available to HCL. |
| Beta | 0.58 | Beta is less than 1 indicating that the HCL’s price is less volatile than the market. |
➲ TITAN (Bearish Trend)
- Recent Performance: TITAN has been on a bit of a roller coaster ride lately. Over the past 26 trading sessions (from June 9th to July 4th), it has closed higher 11 times and lower 15 times.
- Short-Term Trend: Looking at the most recent trading days, TITAN has been trending downward. It’s been on a three-day losing streak, closing lower every day since July 1st.
- Returns: While TITAN has seen some ups and downs, the overall return over the past 26 trading sessions has been a slight decrease of 2.04%. This means an investment of ₹10,000 would be worth ₹9,796 today.
- Financial Snapshot: Over the past 12 months, TITAN generated a strong revenue of ₹51,084 Crore and a healthy profit of ₹3,495.99 Crore.
- As of July 4th, 2024, TITAN has a Market Capital of ₹3,06,218.19 Crore.
- What’s Next? TITAN is currently facing some bearish pressure. It’s wise to keep a close eye on its movement, especially considering its short-term trends. You might want to check out the TITAN Target for Tomorrow and the TITAN Targets for 2024 & 2025 for more insights.
TITAN Financial Performance
| Metric | Value | Description |
|---|---|---|
| Market Capital | 3,06,218.19 Crore | Market valuation of TITAN’s shares. |
| Revenue (TTM) | 51,084 Crore | Total revenue generated by TITAN over the past twelve months. |
| Net Income (TTM) | +3,495.99 Crore | Net Profit or Loss after all the expenses over the past twelve months. |
| Operating Margin | 8.26% | Income from operations as a percentage of revenue, before taxes and interest. |
| Profit Margin | 6.84% | Net income as a percentage of revenue, after all expenses. |
| Revenue Growth (Quarterly) | +20.6% | Change in revenue compared to the previous quarter. |
| Earnings Growth (YOY Quarterly) | +5.6% | Change in earnings compared to the same quarter last year. |
| Debt-to-Equity (D/E) Ratio | 165.31 | Company’s total debt divided by total shareholder equity. |
| Total Debt | 15,527.99 Crore | Sum of TITAN’s current & long-term financial obligations. |
| Total Cash | 3,192 Crore | Total amount of liquid funds available to TITAN. |
| Beta | 0.46 | Beta is less than 1 indicating that the TITAN’s price is less volatile than the market. |
Nifty 500 Performance Overview
The Nifty 500 started the day at ₹22,937.8, showing some ups and downs throughout the session. It reached a low of ₹22,867.8 and a high of ₹22,962.15 before closing at ₹22,918.3, up 0.29% for the day.
Take a look at the table below to see the top gainers and losers that impacted the Nifty 500’s movement today.
Nifty 500 Top Gainers
| Stock | Close | Range |
|---|---|---|
| Mazagoan Dock Shipbuilders | ₹5,621.45 (20%) | ₹4,671.25 – ₹5,621.45 |
| Galaxy Surfactants | ₹3128 (12.83%) | ₹2,776.3 – ₹3,206.75 |
| NBCC | ₹186.5 (10.33%) | ₹170.8 – ₹189.89 |
| Cochin Shipyard | ₹2,679.94 (9.99%) | ₹2412 – ₹2,679.94 |
| Concord Biotech | ₹1722 (8.31%) | ₹1,580.25 – ₹1,743.09 |
Nifty 500 Top Losers
| Stock | Close | Range |
|---|---|---|
| Home First Finance Company | ₹1072 (-4.42%) | ₹1,060.8 – ₹1,114.5 |
| Aavas Financiers | ₹1,795.94 (-3.4%) | ₹1,778.3 – ₹1,859.8 |
| PB Fintech | ₹1,419.09 (-2.99%) | ₹1,405.55 – ₹1470 |
| EPL | ₹221 (-2.88%) | ₹220.5 – ₹226.5 |
| The Ramco Cements | ₹818.09 (-2.62%) | ₹816.5 – ₹839 |
Nifty 51 to 500 Stocks To Watch for Tomorrow
➲ MphasiS (Looking Strong)
- Performance Overview: Over the past 26 trading days, MphasiS has closed higher 17 times and lower 9 times. That’s a solid performance!
- Recent Trend: MphasiS has been on an impressive 8-day winning streak, with no closing in the red since Monday, June 24, 2024.
- Returns: MphasiS delivered a strong 8.12% return over the last 26 trading sessions. This means that an investment of ₹10,000 would have grown to ₹10,812.
- Financial Insight: Over the past 12 months, MphasiS has generated a substantial revenue of ₹13,278.51 Crore and generated a profit of ₹1,554.81 Crore.
- As of Thursday, July 4, 2024, MphasiS has a Market Capital of ₹48,575.86 Crore.
- Summary: MphasiS is showing a robust and bullish pattern. Investors are keeping a close eye on its price movements for both short-term and long-term growth opportunities. Check out MphasiS Target for Tomorrow and MphasiS Targets for 2024 & 2025.
MphasiS Financial Performance
| Metric | Value | Description |
|---|---|---|
| Market Capital | 48,575.86 Crore | Market valuation of MphasiS’s shares. |
| Revenue (TTM) | 13,278.51 Crore | Total revenue generated by MphasiS over the past twelve months. |
| Net Income (TTM) | +1,554.81 Crore | Net Profit or Loss after all the expenses over the past twelve months. |
| Operating Margin | 10.11% | Income from operations as a percentage of revenue, before taxes and interest. |
| Profit Margin | 11.7% | Net income as a percentage of revenue, after all expenses. |
| Revenue Growth (Quarterly) | +1.5% | Change in revenue compared to the previous quarter. |
| Earnings Growth (YOY Quarterly) | -3% | Change in earnings compared to the same quarter last year. |
| Debt-to-Equity (D/E) Ratio | 27.16 | Company’s total debt divided by total shareholder equity. |
| Total Debt | 2,388.58 Crore | Sum of MphasiS’s current & long-term financial obligations. |
| Total Cash | 3,407.02 Crore | Total amount of liquid funds available to MphasiS. |
| Beta | 0.73 | Beta is less than 1 indicating that the MphasiS’s price is less volatile than the market. |
➲ Ashok Leyland (Bearish Pattern)
- Performance Overview: Ashok Leyland has had a bit of a mixed bag over the last 26 trading sessions. It closed in the red 14 times and in the green 12 times.
- Recent Trend: Things have been a little rough for Ashok Leyland lately. It’s been on a 5-day red streak, with no green days since Thursday, June 27, 2024.
- Returns: Over the past 26 trading sessions, Ashok Leyland provided a 2.1% return. This means that if you invested ₹10,000, your investment would have grown to ₹10,209.99.
- Financial Insight: In the past 12 months, Ashok Leyland generated a revenue of ₹45,790.63 Crore and made a profit of ₹2,483.51 Crore.
- As of Thursday, July 4, 2024, Ashok Leyland has a Market Capital of ₹68,870.78 Crore.
- Summary: Ashok Leyland is currently facing a bearish trend. It’s a good idea for investors to keep a close eye on its performance. You may want to check out the Ashok Leyland Target for Tomorrow and Ashok Leyland Targets for 2024 & 2025 for more insights.
Ashok Leyland Financial Performance
| Metric | Value | Description |
|---|---|---|
| Market Capital | 68,870.78 Crore | Market valuation of Ashok Leyland’s shares. |
| Revenue (TTM) | 45,790.63 Crore | Total revenue generated by Ashok Leyland over the past twelve months. |
| Net Income (TTM) | +2,483.51 Crore | Net Profit or Loss after all the expenses over the past twelve months. |
| Operating Margin | 17.45% | Income from operations as a percentage of revenue, before taxes and interest. |
| Profit Margin | 5.42% | Net income as a percentage of revenue, after all expenses. |
| Revenue Growth (Quarterly) | +2.8% | Change in revenue compared to the previous quarter. |
| Earnings Growth (YOY Quarterly) | +13.4% | Change in earnings compared to the same quarter last year. |
| Debt-to-Equity (D/E) Ratio | 345.35 | Company’s total debt divided by total shareholder equity. |
| Total Debt | 40,802.17 Crore | Sum of Ashok Leyland’s current & long-term financial obligations. |
| Total Cash | 8,103.23 Crore | Total amount of liquid funds available to Ashok Leyland. |
| Beta | 0.89 | Beta is less than 1 indicating that the Ashok Leyland’s price is less volatile than the market. |
Top Stocks That Created a New All Time High Today
Top Large Cap Stocks That Created a New All Time High Today
Companies with Market Capital more than 20,000 Crores| Stock | Close | New All-Time High (ATH) | Previous ATH | Previous ATH Date |
|---|---|---|---|---|
| Apar Industries | 8567.95 (-1.18%) | 8880.34 (+13.12%) | 7850.00 | Wed 24 Apr 2024 |
| Bajaj Holdings | 9841.00 (+5.85%) | 9979.95 (+%) | Thu 01 Jan 1970 | |
| CEBBCO | 721.84 (+4.04%) | 736.34 (+69.74%) | 433.80 | Mon 01 Jan 2024 |
| Cochin Shipyard | 2679.94 (+9.99%) | 2679.94 (+%) | Thu 01 Jan 1970 | |
| Dr Reddy Lab | 6475.00 (+0.76%) | 6540.04 (+%) | Thu 01 Jan 1970 |
Top Mid Cap Stocks That Created a New All Time High Today
Companies with Market Capital between 5,000 Crores to 20,000 Crores| Stock | Close | New All-Time High (ATH) | Previous ATH | Previous ATH Date |
|---|---|---|---|---|
| Arvind | 385.64 (+0.92%) | 398.75 (+19.82%) | 332.79 | Tue 23 Apr 2024 |
| AstraZeneca Pharma | 7159.95 (+11.9%) | 7546.75 (+%) | Thu 01 Jan 1970 | |
| Cello World | 989.59 (+3.07%) | 1025.00 (+6.99%) | 958.00 | Wed 24 Apr 2024 |
| Concord Biotech | 1722.00 (+8.31%) | 1743.09 (+8.46%) | 1607.00 | Wed 10 Jan 2024 |
| Dodla Dairy | 1116.00 (+9.16%) | 1144.94 (+%) | Thu 01 Jan 1970 |
Top Small Cap Stocks That Created a New All Time High Today
Companies with Market Capital less than 5,000 Crores| Stock | Close | New All-Time High (ATH) | Previous ATH | Previous ATH Date |
|---|---|---|---|---|
| 21ST CENTURY MANAG | 72.05 (+1.99%) | 72.05 (+%) | Thu 01 Jan 1970 | |
| Ace Software Exports | 258.60 (+1.99%) | 258.60 (+72.07%) | 150.28 | Mon 01 Apr 2024 |
| ADC India Communications | 2204.19 (+8.22%) | 2247.75 (+%) | Thu 01 Jan 1970 | |
| Ahmedabad Steelcraft | 111.65 (+1.96%) | 111.65 (+%) | Thu 01 Jan 1970 | |
| Ashiana Agro Industries | 25.00 (+4.99%) | 25.00 (+%) | Thu 01 Jan 1970 |