Home / Mon 19 Aug 2024 Market Recap
19 Aug 2024: Nifty closed at ₹24,580.34 (+0.15%), Mankind Pharma closing in the green for the past 9 days!
Show Table of Contents
Table of Contents
- 1: Top Indices Performance Overview
- 2: Nifty 50 Performance Overview
- 2.1: Nifty 50 Top Gainers
- 2.2: Nifty 50 Top Losers
- 2.3: Nifty 50 Stocks To Watch for Tomorrow
- 2.3.1: ➲ HCL (Looking Bullish)
- 2.3.2: ➲ SBI Life Insurance (Showing Bearish Trends)
- 3: Nifty 500 Performance Overview
- 3.1: Nifty 500 Top Gainers
- 3.2: Nifty 500 Top Losers
- 3.3: Nifty 51 to 500 Stocks To Watch for Tomorrow
- 3.3.1: Mankind Pharma: A Bullish Outlook
- 3.3.2: ➲ Timken India (Bearish Trend)
- 4: Top Stocks That Created a New All Time High Today
- 4.1: Top Large Cap Stocks That Created a New All Time High Today
- 4.2: Top Mid Cap Stocks That Created a New All Time High Today
- 4.3: Top Small Cap Stocks That Created a New All Time High Today
Top Indices Performance Overview
| Stock | Close | Range |
|---|---|---|
| NIFTY 50 | ₹24,580.34 (0.15%) | ₹24,525.55 – ₹24,633.09 |
| NIFTY BANK | ₹50,418.85 (-0.2%) | ₹50,285.35 – ₹50,726.94 |
| NIFTY FIN SERVICE | ₹22,941.8 (-0.15%) | ₹22,872.09 – ₹23,065.59 |
| NIFTY IT | ₹41,249.25 (0.9%) | ₹40,744.69 – ₹41,271.6 |
| NIFTY AUTO | ₹25,387.9 (-0.82%) | ₹25,355.69 – ₹25,713.55 |
| NIFTY ENERGY | ₹43,353.64 (1.38%) | ₹43,059.5 – ₹43,444.64 |
Nifty 50 Performance Overview
The Nifty 50 started the day at ₹24,630.55. Throughout the session, it saw some ups and downs, reaching a low of ₹24,525.55 and a high of ₹24,633.09, before finally closing at ₹24,580.34 (+0.15%).
This movement was influenced by the day’s top gainers and losers, which you can find in the table below.
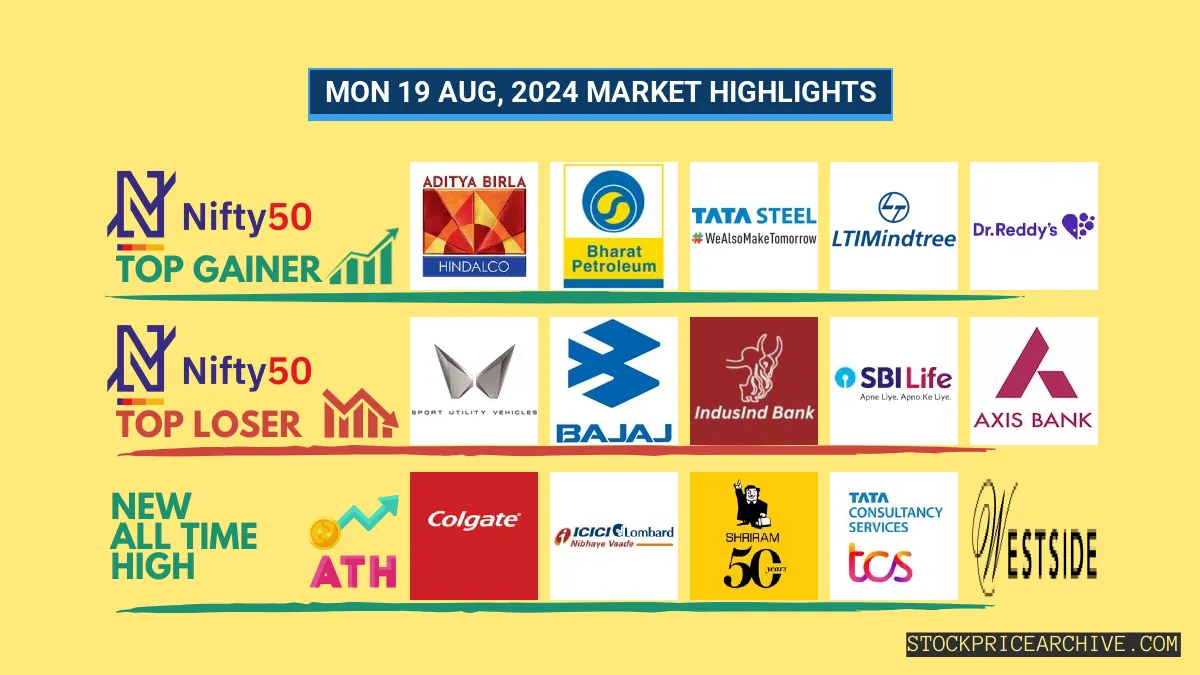
Nifty 50 Top Gainers
| Stock | Close | Range |
|---|---|---|
| Hindalco | ₹658.84 (3.89%) | ₹639.29 – ₹660.2 |
| Bharat Petroleum | ₹343.54 (3.32%) | ₹337 – ₹345.5 |
| Tata Steel | ₹153.96 (2.96%) | ₹150.38 – ₹154.3 |
| LTIMindtree | ₹5,677.89 (2.05%) | ₹5,571.1 – ₹5,710.14 |
| Dr Reddy Lab | ₹6,914.6 (1.78%) | ₹6,823.64 – ₹6,923.75 |
Nifty 50 Top Losers
| Stock | Close | Range |
|---|---|---|
| Mahindra & Mahindra | ₹2,765.14 (-2.66%) | ₹2,760.1 – ₹2,855.35 |
| Bajaj Auto | ₹9,765.79 (-1.24%) | ₹9,761.5 – ₹9,924.34 |
| IndusInd Bank | ₹1,349.59 (-1.07%) | ₹1,345.75 – ₹1,375.8 |
| SBI Life Insurance | ₹1,671.55 (-1.03%) | ₹1666 – ₹1,696.8 |
| Axis Bank | ₹1155 (-1.02%) | ₹1,150.55 – ₹1,170.75 |
Nifty 50 Stocks To Watch for Tomorrow
➲ HCL (Looking Bullish)
- Recent Performance: Over the past 24 trading days, HCL has closed higher 13 times and lower 10 times. That means it’s been a bit of a mixed bag, but overall it’s showing some positive momentum.
- Current Trend: HCL has been on a roll! It’s had a 4-day winning streak – no red days since Monday, August 12th, 2024.
- Returns: If you had invested ₹10,000 in HCL over the past 24 trading days, you’d be up ₹607! That’s a 6.07% return – not bad at all.
- Financial Snapshot: HCL has been doing well financially. Over the past year, it generated a revenue of ₹1,12,771.71 Crore and a profit of ₹16,470 Crore.
- As of Monday, August 19th, 2024, HCL has a Market Capital of ₹4,40,057.3 Crore. This tells us that investors value the company quite highly.
- Key Takeaway: HCL is showing strong signs of a bullish pattern. Investors might want to keep a close eye on its price movements to see if it continues on this path. To get a sense of where HCL could be headed, check out its potential price targets:
HCL Financial Performance
| Metric | Value | Description |
|---|---|---|
| Market Capital | 4,40,057.3 Crore | Market valuation of HCL’s shares. |
| Revenue (TTM) | 1,12,771.71 Crore | Total revenue generated by HCL over the past twelve months. |
| Net Income (TTM) | +16,470 Crore | Net Profit or Loss after all the expenses over the past twelve months. |
| Operating Margin | 17.09% | Income from operations as a percentage of revenue, before taxes and interest. |
| Profit Margin | 14.6% | Net income as a percentage of revenue, after all expenses. |
| Revenue Growth (Quarterly) | +5.09% | Change in revenue compared to the previous quarter. |
| Earnings Growth (YOY Quarterly) | +15.3% | Change in earnings compared to the same quarter last year. |
| Debt-to-Equity (D/E) Ratio | 8.17 | Company’s total debt divided by total shareholder equity. |
| Total Debt | 5,531.97 Crore | Sum of HCL’s current & long-term financial obligations. |
| Total Cash | 26,417.49 Crore | Total amount of liquid funds available to HCL. |
| Beta | 0.61 | Beta is less than 1 indicating that the HCL’s price is less volatile than the market. |
➲ SBI Life Insurance (Showing Bearish Trends)
- Performance Overview: Over the past 24 trading days, SBI Life Insurance has closed lower 12 times and higher 12 times. This suggests a bit of a mixed bag recently.
- Recent Trend: SBI Life Insurance has been on a 2-day decline, with no gains since Wednesday, August 14, 2024.
- Returns: SBI Life Insurance delivered a 6.95% return over the last 24 trading sessions. This means an investment of ₹10,000 would have grown to ₹10,695 during that period.
- Financial Insight: In the past year, SBI Life Insurance has generated a revenue of ₹1,31,999.05 Crore and recorded a profit of ₹1,893.78 Crore.
- As of Monday, August 19, 2024, SBI Life Insurance has a Market Capital of ₹1,43,843.31 Crore.
- Summary: SBI Life Insurance is currently showing bearish trends. We recommend investors stay alert and closely watch its performance. Consider checking out the SBI Life Insurance Target for Tomorrow and SBI Life Insurance Targets for 2024 & 2025 for more insights.
SBI Life Insurance Financial Performance
| Metric | Value | Description |
|---|---|---|
| Market Capital | 1,43,843.31 Crore | Market valuation of SBI Life Insurance’s shares. |
| Revenue (TTM) | 1,31,999.05 Crore | Total revenue generated by SBI Life Insurance over the past twelve months. |
| Net Income (TTM) | +1,893.78 Crore | Net Profit or Loss after all the expenses over the past twelve months. |
| Operating Margin | 2.34% | Income from operations as a percentage of revenue, before taxes and interest. |
| Profit Margin | 1.43% | Net income as a percentage of revenue, after all expenses. |
| Revenue Growth (Quarterly) | +70.19% | Change in revenue compared to the previous quarter. |
| Earnings Growth (YOY Quarterly) | +4.39% | Change in earnings compared to the same quarter last year. |
| Total Cash | 4,745.89 Crore | Total amount of liquid funds available to SBI Life Insurance. |
| Beta | 0.59 | Beta is less than 1 indicating that the SBI Life Insurance’s price is less volatile than the market. |
Nifty 500 Performance Overview
The Nifty 500 kicked off the day at ₹23,173.5, showing its usual spunk with a bit of back-and-forth action. It dipped to a low of ₹23,104.19 before reaching a peak of ₹23,195.5, eventually settling at a close of ₹23,149.65 (+0.4%).
Check out the table below to see the top gainers and losers that made a splash in today’s Nifty 500 performance.
Nifty 500 Top Gainers
| Stock | Close | Range |
|---|---|---|
| Godfrey Phillips | ₹5,442.6 (20%) | ₹4525 – ₹5,442.6 |
| Firstsource Solutions | ₹338.85 (16.68%) | ₹306.14 – ₹343.54 |
| IIFL Finance | ₹458.79 (13.29%) | ₹409 – ₹460 |
| Triveni Engineering & Industries | ₹465.25 (12.04%) | ₹415.79 – ₹482 |
| Angel One | ₹2357 (9.11%) | ₹2,179.3 – ₹2,379.94 |
Nifty 500 Top Losers
| Stock | Close | Range |
|---|---|---|
| V-Guard Industries | ₹483.54 (-7.75%) | ₹481.39 – ₹525.9 |
| Suprajit Engineering | ₹583.15 (-6.02%) | ₹580 – ₹629 |
| Mazagoan Dock Shipbuilders | ₹4,724.45 (-5.04%) | ₹4710 – ₹4,887.79 |
| Hindustan Zinc | ₹495.04 (-4.79%) | ₹488.75 – ₹498.54 |
| Suven Pharmaceuticals | ₹965.84 (-3.79%) | ₹955.54 – ₹1,002.29 |
Nifty 51 to 500 Stocks To Watch for Tomorrow
Mankind Pharma: A Bullish Outlook
- Recent Performance: Over the past 24 trading sessions, Mankind Pharma has been on a roll, closing higher on 13 days and lower on 11 days.
- Hot Streak: This stock is on a hot streak, closing in the green for the past 9 consecutive trading days, with the last red day being Monday, August 5th, 2024.
- Returns: If you had invested ₹10,000 in Mankind Pharma over the last 24 trading sessions, you would have seen a healthy return of 7.36%, bringing your investment to ₹10,735.99.
- Financial Strength: In the past year, Mankind Pharma has generated impressive revenue of ₹10,649.57 Crore, along with a strong profit of ₹1,962.51 Crore.
- Market Value: As of Monday, August 19th, 2024, Mankind Pharma boasts a market capitalization of ₹92,184.17 Crore.
- Looking Ahead: The current bullish pattern for Mankind Pharma is encouraging. Investors are watching closely to see where the price will go next, both in the short and long term. To explore potential short-term targets, check out Mankind Pharma Target for Tomorrow. For a longer-term perspective, visit Mankind Pharma Targets for 2024 & 2025.
Mankind Pharma Financial Performance
| Metric | Value | Description |
|---|---|---|
| Market Capital | 92,184.17 Crore | Market valuation of Mankind Pharma’s shares. |
| Revenue (TTM) | 10,649.57 Crore | Total revenue generated by Mankind Pharma over the past twelve months. |
| Net Income (TTM) | +1,962.51 Crore | Net Profit or Loss after all the expenses over the past twelve months. |
| Operating Margin | 19.83% | Income from operations as a percentage of revenue, before taxes and interest. |
| Profit Margin | 18.42% | Net income as a percentage of revenue, after all expenses. |
| Revenue Growth (Quarterly) | +12.2% | Change in revenue compared to the previous quarter. |
| Earnings Growth (YOY Quarterly) | +10.19% | Change in earnings compared to the same quarter last year. |
| Debt-to-Equity (D/E) Ratio | 2.16 | Company’s total debt divided by total shareholder equity. |
| Total Debt | 207.17 Crore | Sum of Mankind Pharma’s current & long-term financial obligations. |
| Total Cash | 3,386.49 Crore | Total amount of liquid funds available to Mankind Pharma. |
➲ Timken India (Bearish Trend)
- Recent Performance: Over the last 24 trading days, Timken India has closed lower 16 times and higher 8 times. That means the stock has seen more downward movement than upward movement recently.
- Current Trend: Timken India has been on a downward slide for the past 6 trading days, with no positive closes since Thursday, August 8th, 2024.
- Returns: If you had invested ₹10,000 in Timken India over the past 24 trading days, you would have seen a return of -10.37%, leaving you with ₹8,963.
- Financial Snapshot: Over the past year, Timken India generated a revenue of ₹2,909.54 Crore and a profit of ₹392.14 Crore.
- As of Monday, August 19th, 2024, Timken India has a Market Capitalization of ₹31,142.42 Crore.
- Summary: Timken India is currently in a bearish phase, meaning the stock price is trending downward. It’s important to keep a close eye on the stock, especially as we look towards future performance. You can find more information about potential future stock price movement on the following pages: Timken India Target for Tomorrow and Timken India Targets for 2024 & 2025.
Timken India Financial Performance
| Metric | Value | Description |
|---|---|---|
| Market Capital | 31,142.42 Crore | Market valuation of Timken India’s shares. |
| Revenue (TTM) | 2,909.54 Crore | Total revenue generated by Timken India over the past twelve months. |
| Net Income (TTM) | +392.14 Crore | Net Profit or Loss after all the expenses over the past twelve months. |
| Operating Margin | 19.7% | Income from operations as a percentage of revenue, before taxes and interest. |
| Profit Margin | 13.47% | Net income as a percentage of revenue, after all expenses. |
| Revenue Growth (Quarterly) | +11.89% | Change in revenue compared to the previous quarter. |
| Earnings Growth (YOY Quarterly) | +35.4% | Change in earnings compared to the same quarter last year. |
| Debt-to-Equity (D/E) Ratio | 1.04 | Company’s total debt divided by total shareholder equity. |
| Total Debt | 25.36 Crore | Sum of Timken India’s current & long-term financial obligations. |
| Total Cash | 491.85 Crore | Total amount of liquid funds available to Timken India. |
| Beta | 0.47 | Beta is less than 1 indicating that the Timken India’s price is less volatile than the market. |
Top Stocks That Created a New All Time High Today
Top Large Cap Stocks That Created a New All Time High Today
Companies with Market Capital more than 20,000 Crores| Stock | Close | New All-Time High (ATH) | Previous ATH | Previous ATH Date |
|---|---|---|---|---|
| Ashok Leyland | 257.95 (+0.78%) | 259.89 (+%) | Thu 01 Jan 1970 | |
| Aurobindo Pharma | 1519.19 (+1.5%) | 1536.65 (+%) | Thu 01 Jan 1970 | |
| CDSL | 2882.44 (+3.38%) | 2954.69 (+39.46%) | 2118.60 | Tue 23 Apr 2024 |
| Colgate Palmolive | 3547.05 (+0.25%) | 3570.00 (+26.82%) | 2814.89 | Wed 03 Apr 2024 |
| Fortis | 523.20 (-1.81%) | 542.50 (+%) | Thu 01 Jan 1970 |
Top Mid Cap Stocks That Created a New All Time High Today
Companies with Market Capital between 5,000 Crores to 20,000 Crores| Stock | Close | New All-Time High (ATH) | Previous ATH | Previous ATH Date |
|---|---|---|---|---|
| Balrampur Chinni | 532.20 (+1.84%) | 544.50 (+%) | Thu 01 Jan 1970 | |
| Bombay Burmah Trading Corp | 2379.89 (+4.2%) | 2502.89 (+%) | Thu 01 Jan 1970 | |
| Caplin Point Laboratories | 1834.65 (+15.6%) | 1899.00 (+%) | Thu 01 Jan 1970 | |
| ENTERO | 1300.34 (+4.96%) | 1309.00 (+%) | Thu 01 Jan 1970 | |
| Firstsource Solutions | 338.85 (+10.12%) | 343.54 (+%) | Thu 01 Jan 1970 |
Top Small Cap Stocks That Created a New All Time High Today
Companies with Market Capital less than 5,000 Crores| Stock | Close | New All-Time High (ATH) | Previous ATH | Previous ATH Date |
|---|---|---|---|---|
| 20 Microns | 327.60 (+10.48%) | 340.00 (+%) | Thu 01 Jan 1970 | |
| 21ST CENTURY MANAG | 101.03 (+1.99%) | 101.03 (+%) | Thu 01 Jan 1970 | |
| Bits | 8.06 (+1.89%) | 8.06 (+%) | Thu 01 Jan 1970 | |
| BTTL | 61.16 (+19.99%) | 61.16 (+%) | Thu 01 Jan 1970 | |
| Ceenik Exports | 1239.09 (+1.99%) | 1239.09 (+142.38%) | 511.20 | Wed 24 Apr 2024 |