Home / Fri 21 Jun 2024 Market Recap
21 Jun 2024: Nifty 50 Closes at ₹23,453.15 (-0.49%), Adani Ports & Hero MotoCorp Show Contrasting Trends – Top Stocks to Watch!
Show Table of Contents
Table of Contents
- 1: Top Indices Performance Overview
- 2: Nifty 50 Performance Overview
- 2.1: Nifty 50 Top Gainers
- 2.2: Nifty 50 Top Losers
- 2.3: Nifty 50 Stocks To Watch for Tomorrow
- 2.3.1: Adani Ports (Bullish Pattern)
- 2.3.2: ➲ Hero MotoCorp (Bearish Trend)
- 3: Nifty 500 Performance Overview
- 3.1: Nifty 500 Top Gainers
- 3.2: Nifty 500 Top Losers
- 3.3: Nifty 51 to 500 Stocks To Watch for Tomorrow
- 3.3.1: Mahindra Holidays & Resorts: A Bullish Outlook
- 3.3.2: ➲ ZFCVINDIA (Bearish Pattern)
- 4: Top Stocks That Created a New All Time High Today
- 4.1: Top Large Cap Stocks That Created a New All Time High Today
- 4.2: Top Mid Cap Stocks That Created a New All Time High Today
- 4.3: Top Small Cap Stocks That Created a New All Time High Today
Top Indices Performance Overview
| Stock | Close | Range |
|---|---|---|
| NIFTY 50 | ₹23,453.15 (-0.49%) | ₹23,399.5 – ₹23,664.94 |
| NIFTY BANK | ₹51,557.5 (-0.44%) | ₹51,228.1 – ₹51909 |
| NIFTY FIN SERVICE | ₹22,945.3 (-0.4%) | ₹22,815.65 – ₹23,098.4 |
| NIFTY IT | ₹35,092.55 (0.44%) | ₹35,062.35 – ₹35,873.3 |
| NIFTY AUTO | ₹25,058.09 (-0.84%) | ₹25,017.65 – ₹25,435.94 |
| NIFTY ENERGY | ₹40,444.5 (-0.76%) | ₹40,364.3 – ₹40,876.05 |
Nifty 50 Performance Overview
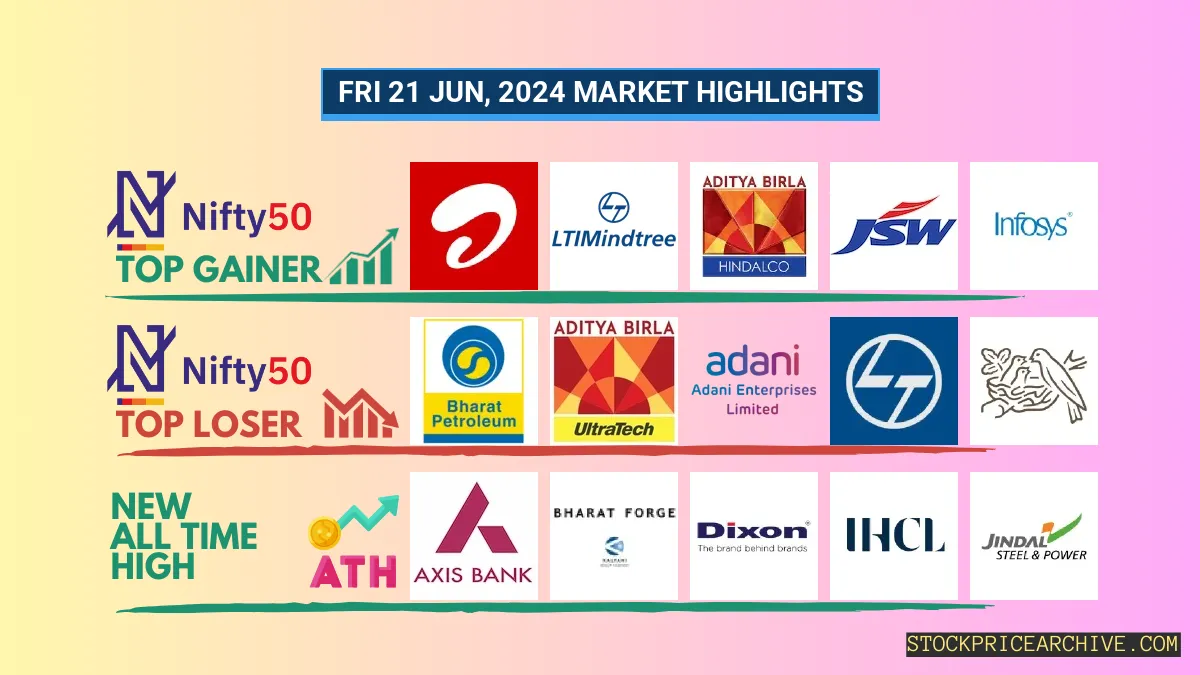
The Nifty 50 started the day at ₹23,664.94, but it wasn’t a smooth ride. It bounced around, hitting a low of ₹23,399.5 and reaching a high of ₹23,664.94 before settling at ₹23,453.15. That’s a -0.49% dip for the day.
This movement was influenced by some notable gainers and losers, which you can see in the table below.
Nifty 50 Top Gainers
| Stock | Close | Range |
|---|---|---|
| Bharti Airtel | ₹1403 (1.58%) | ₹1,373.55 – ₹1,423.9 |
| LTIMindtree | ₹5122 (1.37%) | ₹5,110.6 – ₹5,273.29 |
| Hindalco | ₹683.25 (0.99%) | ₹677.2 – ₹691.2 |
| JSW Steel | ₹936.9 (0.77%) | ₹923.25 – ₹944 |
| Infosys | ₹1,525.09 (0.63%) | ₹1,523.84 – ₹1,557.5 |
Nifty 50 Top Losers
| Stock | Close | Range |
|---|---|---|
| Bharat Petroleum | ₹308.29 (-50.78%) | ₹305.25 – ₹318.75 |
| UltraTech Cement | ₹10,625.09 (-2.56%) | ₹10,611.84 – ₹10,956.84 |
| Adani Enterprises | ₹3192 (-2.07%) | ₹3,177.1 – ₹3,277.1 |
| Larsen Toubro | ₹3524 (-1.96%) | ₹3516 – ₹3,605.75 |
| Nestle India | ₹2,491.39 (-1.91%) | ₹2,488.5 – ₹2548 |
Nifty 50 Stocks To Watch for Tomorrow
Adani Ports (Bullish Pattern)
- Performance Overview: In the last 26 trading sessions, Adani Ports closed higher 18 times and lower 8 times. This indicates a generally positive trend for the stock.
- Recent Trend: Adani Ports has been on a 6-day winning streak, with no closing losses since Wednesday, June 12th, 2024.
- Returns: Adani Ports delivered a 9.11% return in the last 26 trading sessions. If you had invested ₹10,000, it would now be worth ₹10,911.
- Financial Insight: Over the past 12 months, Adani Ports generated revenue of ₹26,710.55 Crore and earned a profit of ₹8,565.8 Crore. These numbers demonstrate the company’s strong financial performance.
- As of Friday, June 21st, 2024, Adani Ports has a Market Capital of ₹3,08,835.2 Crore.
- Summary: Adani Ports shows a strong bullish pattern. Investors should closely watch the stock’s price movements for both short-term and long-term growth opportunities. Checkout Adani Ports Target for Tomorrow and Adani Ports Targets for 2024 & 2025.
Adani Ports Financial Performance
| Metric | Value | Description |
|---|---|---|
| Market Capital | 3,08,835.2 Crore | Market valuation of Adani Ports’s shares. |
| Revenue (TTM) | 26,710.55 Crore | Total revenue generated by Adani Ports over the past twelve months. |
| Net Income (TTM) | +8,565.8 Crore | Net Profit or Loss after all the expenses over the past twelve months. |
| Operating Margin | 45.2% | Income from operations as a percentage of revenue, before taxes and interest. |
| Profit Margin | 30.36% | Net income as a percentage of revenue, after all expenses. |
| Revenue Growth (Quarterly) | +19% | Change in revenue compared to the previous quarter. |
| Earnings Growth (YOY Quarterly) | +76.2% | Change in earnings compared to the same quarter last year. |
| Debt-to-Equity (D/E) Ratio | 90.39 | Company’s total debt divided by total shareholder equity. |
| Total Debt | 49,303.7 Crore | Sum of Adani Ports’s current & long-term financial obligations. |
| Total Cash | 4,870.64 Crore | Total amount of liquid funds available to Adani Ports. |
| Beta | 0.59 | Beta is less than 1 indicating that the Adani Ports’s price is less volatile than the market. |
➲ Hero MotoCorp (Bearish Trend)
- Performance Overview: In the last 26 trading sessions, Hero MotoCorp has shown some ups and downs. The stock closed in the red 14 times and in the green 12 times.
- Recent Trend: Hero MotoCorp has been on a bit of a downward slide, closing in the red for the past five trading days. The last green close was on Thursday, June 13, 2024.
- Returns: While there have been some dips, Hero MotoCorp still managed to deliver a 7.64% return over the past 26 trading sessions. That means if you had invested ₹10,000, it would be worth ₹10,764 today.
- Financial Insight: Let’s take a look at the bigger picture. Over the past 12 months, Hero MotoCorp has brought in a revenue of ₹37,788.62 Crore and achieved a profit of ₹3,744.82 Crore. This gives us some insight into the company’s financial performance.
- As of Friday, June 21, 2024, Hero MotoCorp has a Market Capital of ₹1,16,043.96 Crore. This reflects the total value of the company’s outstanding shares.
- Summary: Right now, Hero MotoCorp is experiencing a bearish trend. We encourage investors to keep a close eye on the stock’s movements, particularly the Hero MotoCorp Target for Tomorrow and Hero MotoCorp Targets for 2024 & 2025. Stay informed and make smart decisions!
Hero MotoCorp Financial Performance
| Metric | Value | Description |
|---|---|---|
| Market Capital | 1,16,043.96 Crore | Market valuation of Hero MotoCorp’s shares. |
| Revenue (TTM) | 37,788.62 Crore | Total revenue generated by Hero MotoCorp over the past twelve months. |
| Net Income (TTM) | +3,744.82 Crore | Net Profit or Loss after all the expenses over the past twelve months. |
| Operating Margin | 12.44% | Income from operations as a percentage of revenue, before taxes and interest. |
| Profit Margin | 9.91% | Net income as a percentage of revenue, after all expenses. |
| Revenue Growth (Quarterly) | +14% | Change in revenue compared to the previous quarter. |
| Earnings Growth (YOY Quarterly) | +16.1% | Change in earnings compared to the same quarter last year. |
| Debt-to-Equity (D/E) Ratio | 3.4 | Company’s total debt divided by total shareholder equity. |
| Total Debt | 606.4 Crore | Sum of Hero MotoCorp’s current & long-term financial obligations. |
| Total Cash | 5,001.54 Crore | Total amount of liquid funds available to Hero MotoCorp. |
| Beta | 0.87 | Beta is less than 1 indicating that the Hero MotoCorp’s price is less volatile than the market. |
Nifty 500 Performance Overview
The Nifty 500 kicked off the day at ₹22,389.5, showing a bit of a roller coaster ride throughout the session. It dipped down to a low of ₹22,187.19, but then rallied back up to reach a peak of ₹22,392.9. By the closing bell, it settled at ₹22,203.84, representing a slight decrease of -0.46% for the day.
The ups and downs were influenced by the top gainers and losers, which you can see in the table below.
Nifty 500 Top Gainers
| Stock | Close | Range |
|---|---|---|
| Cera Sanitaryware | ₹9,090.29 (9.58%) | ₹8300 – ₹9,222.5 |
| HLE Glascoat | ₹481.6 (6.83%) | ₹451.29 – ₹485.45 |
| Aster Healthcare | ₹380 (6.66%) | ₹345.1 – ₹380.2 |
| Rail Vikas Nigam | ₹409.75 (5.74%) | ₹384.45 – ₹417.25 |
| Zensar Technolgies | ₹758 (5.14%) | ₹730 – ₹782 |
Nifty 500 Top Losers
| Stock | Close | Range |
|---|---|---|
| Bharat Petroleum | ₹308.29 (-50.78%) | ₹305.25 – ₹318.75 |
| Hindustan Petroleum | ₹341.7 (-34.77%) | ₹336 – ₹352.54 |
| Chambal Fertilizers | ₹517.75 (-7.19%) | ₹515.09 – ₹574.15 |
| RCF | ₹207.25 (-6.75%) | ₹206.5 – ₹227.67 |
| gnfc | ₹714.95 (-6.61%) | ₹712.09 – ₹765.9 |
Nifty 51 to 500 Stocks To Watch for Tomorrow
Mahindra Holidays & Resorts: A Bullish Outlook
- Performance Overview: In the last 26 trading sessions, Mahindra Holidays & Resorts has closed higher than the previous day’s closing price 18 times and lower 8 times.
- Recent Trend: Mahindra Holidays & Resorts has been on a strong upward trend, closing higher for the past 8 consecutive trading days. The last time the stock closed lower was on Monday, June 10, 2024.
- Returns: Over the past 26 trading sessions, Mahindra Holidays & Resorts has delivered a 17.25% return. This means if you had invested ₹10,000 on June 1, 2024, your investment would be worth ₹11,724.99 today.
- Financial Insight: During the past 12 months, Mahindra Holidays & Resorts generated revenue of ₹2,704.59 Crore and generated a profit of ₹115.52 Crore.
- As of Friday, June 21, 2024, Mahindra Holidays & Resorts has a Market Capital of ₹8,624.71 Crore.
- Summary: The recent price movements of Mahindra Holidays & Resorts suggest a strong bullish trend. Investors may want to keep an eye on its future price movement to explore potential opportunities for both short-term and long-term growth. Check out Mahindra Holidays & Resorts Target for Tomorrow and Mahindra Holidays & Resorts Targets for 2024 & 2025 for more insight.
Mahindra Holidays & Resorts Financial Performance
| Metric | Value | Description |
|---|---|---|
| Market Capital | 8,624.71 Crore | Market valuation of Mahindra Holidays & Resorts’s shares. |
| Revenue (TTM) | 2,704.59 Crore | Total revenue generated by Mahindra Holidays & Resorts over the past twelve months. |
| Net Income (TTM) | +115.52 Crore | Net Profit or Loss after all the expenses over the past twelve months. |
| Operating Margin | 12.71% | Income from operations as a percentage of revenue, before taxes and interest. |
| Profit Margin | 4.27% | Net income as a percentage of revenue, after all expenses. |
| Revenue Growth (Quarterly) | +12.4% | Change in revenue compared to the previous quarter. |
| Earnings Growth (YOY Quarterly) | +46% | Change in earnings compared to the same quarter last year. |
| Debt-to-Equity (D/E) Ratio | 513.39 | Company’s total debt divided by total shareholder equity. |
| Total Debt | 2,738.28 Crore | Sum of Mahindra Holidays & Resorts’s current & long-term financial obligations. |
| Total Cash | 942.25 Crore | Total amount of liquid funds available to Mahindra Holidays & Resorts. |
| Beta | 0.16 | Beta is less than 1 indicating that the Mahindra Holidays & Resorts’s price is less volatile than the market. |
➲ ZFCVINDIA (Bearish Pattern)
- Performance Overview: Over the last 26 trading days, ZFCVINDIA closed lower 15 times and higher 11 times.
- Recent Trend: ZFCVINDIA has been on a 7-day downward streak, without a single day closing higher since Tuesday, June 11, 2024.
- Returns: ZFCVINDIA delivered an 18.3% return over the past 26 trading days. This means an investment of ₹10,000 would have grown to ₹11,830 during this period.
- Financial Insight: Over the past 12 months, Mahindra Holidays & Resorts generated a revenue of ₹3,833.94 Crore and recorded a profit of ₹407.45 Crore.
- As of Friday, June 21, 2024, Mahindra Holidays & Resorts has a Market Capital of ₹25,703.46 Crore.
- Summary: ZFCVINDIA is currently experiencing a bearish phase. We recommend investors keep a close eye on its performance, particularly the ZFCVINDIA Target for Tomorrow and ZFCVINDIA Targets for 2024 & 2025.
ZFCVINDIA Financial Performance
| Metric | Value | Description |
|---|---|---|
| Market Capital | 25,703.46 Crore | Market valuation of ZFCVINDIA’s shares. |
| Revenue (TTM) | 3,833.94 Crore | Total revenue generated by ZFCVINDIA over the past twelve months. |
| Net Income (TTM) | +407.45 Crore | Net Profit or Loss after all the expenses over the past twelve months. |
| Operating Margin | 11.94% | Income from operations as a percentage of revenue, before taxes and interest. |
| Profit Margin | 10.62% | Net income as a percentage of revenue, after all expenses. |
| Revenue Growth (Quarterly) | +2.6% | Change in revenue compared to the previous quarter. |
| Earnings Growth (YOY Quarterly) | +18% | Change in earnings compared to the same quarter last year. |
| Debt-to-Equity (D/E) Ratio | 2.46 | Company’s total debt divided by total shareholder equity. |
| Total Debt | 63.82 Crore | Sum of ZFCVINDIA’s current & long-term financial obligations. |
| Total Cash | 1,361.81 Crore | Total amount of liquid funds available to ZFCVINDIA. |
| Beta | -0.04 | Beta is less than 1 indicating that the ZFCVINDIA’s price is less volatile than the market. |
Top Stocks That Created a New All Time High Today
Top Large Cap Stocks That Created a New All Time High Today
Companies with Market Capital more than 20,000 Crores| Stock | Close | New All-Time High (ATH) | Previous ATH | Previous ATH Date |
|---|---|---|---|---|
| Axis Bank | 1234.15 (-0.44%) | 1243.84 (+%) | Thu 01 Jan 1970 | |
| BASF | 5225.00 (-0.19%) | 5315.00 (+%) | Thu 01 Jan 1970 | |
| Bayer Cropscience | 6477.00 (+4.28%) | 6667.39 (+%) | Thu 01 Jan 1970 | |
| Bharat Forge | 1752.19 (-2.19%) | 1804.50 (+%) | Thu 01 Jan 1970 | |
| Dixon Technologies | 11539.09 (+0.46%) | 11679.40 (+46.3%) | 7983.00 | Fri 12 Apr 2024 |
Top Mid Cap Stocks That Created a New All Time High Today
Companies with Market Capital between 5,000 Crores to 20,000 Crores| Stock | Close | New All-Time High (ATH) | Previous ATH | Previous ATH Date |
|---|---|---|---|---|
| Blue Jet Healthcare | 424.50 (-0.08%) | 442.79 (+%) | Thu 01 Jan 1970 | |
| Chambal Fertilizers | 517.75 (-7.19%) | 574.15 (+%) | Thu 01 Jan 1970 | |
| Dhanuka Agritech | 1688.50 (+0.16%) | 1733.00 (+24.14%) | 1395.90 | Mon 22 Apr 2024 |
| Gallantt Metal | 360.00 (+2.21%) | 362.00 (+31.02%) | 276.29 | Tue 23 Apr 2024 |
| Granules India | 490.79 (+3.91%) | 498.75 (+%) | Thu 01 Jan 1970 |
Top Small Cap Stocks That Created a New All Time High Today
Companies with Market Capital less than 5,000 Crores| Stock | Close | New All-Time High (ATH) | Previous ATH | Previous ATH Date |
|---|---|---|---|---|
| The First Custodian Fund | 134.50 (+4.99%) | 134.50 (+%) | Thu 01 Jan 1970 | |
| 20 Microns | 213.70 (+13.79%) | 218.11 (+%) | Thu 01 Jan 1970 | |
| Aayush Food and Herbs | 298.00 (+0.89%) | 304.79 (+25.76%) | 242.35 | Thu 25 Apr 2024 |
| ADC India Communications | 1690.00 (+6.27%) | 1771.00 (+%) | Thu 01 Jan 1970 | |
| Ahmedabad Steelcraft | 93.53 (+1.99%) | 93.53 (+%) | Thu 01 Jan 1970 |


