Home / Tue 20 Aug 2024 Market Recap
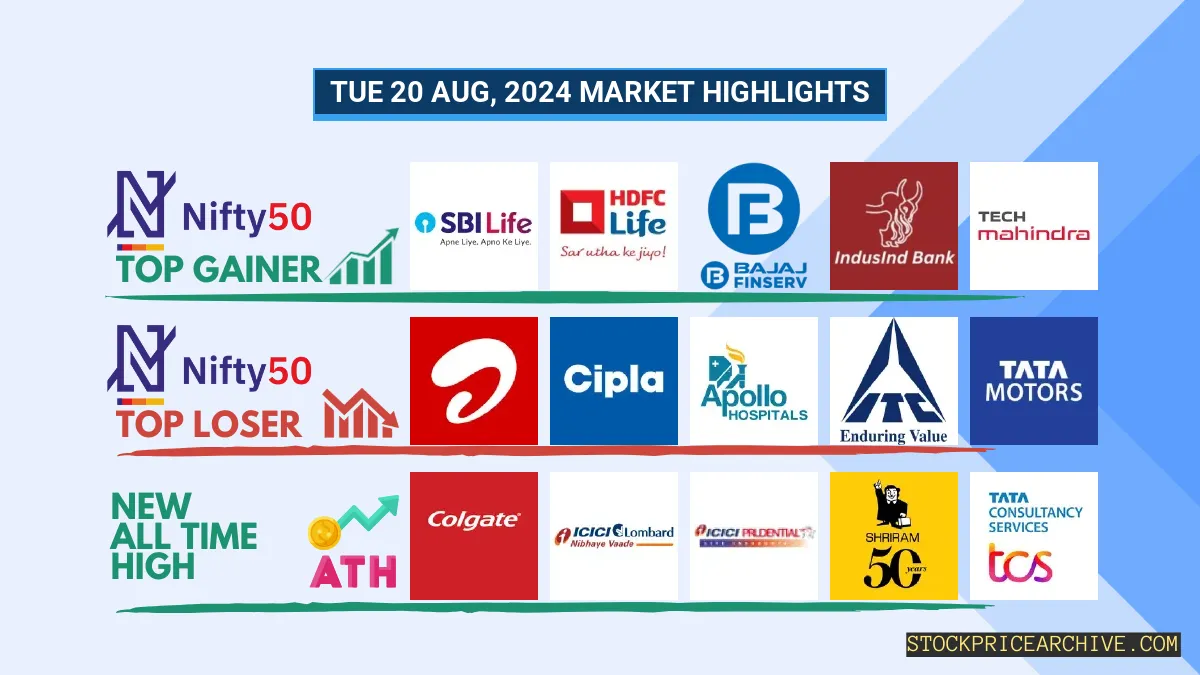
20 Aug 2024: Nifty 50 Closes at ₹24,672.84 (+0.4%), Mankind Pharma Closing Higher Past 10-days & HCL Since 5-days
Show Table of Contents
Table of Contents
- 1: Top Indices Performance Overview
- 2: Nifty 50 Performance Overview
- 2.1: Nifty 50 Top Gainers
- 2.2: Nifty 50 Top Losers
- 2.3: Nifty 50 Stocks To Watch for Tomorrow
- 2.3.1: ➲ HCL (Looking Bullish)
- 2.3.2: ➲ Bharti Airtel (Looking Bearish)
- 3: Nifty 500 Performance Overview
- 3.1: Nifty 500 Top Gainers
- 3.2: Nifty 500 Top Losers
- 3.3: Nifty 51 to 500 Stocks To Watch for Tomorrow
- 3.3.1: ➲ Mankind Pharma (Strong Bullish Pattern)
- 3.3.2: ➲ Timken India (Bearish Trend)
- 4: Top Stocks That Created a New All Time High Today
- 4.1: Top Large Cap Stocks That Created a New All Time High Today
- 4.2: Top Mid Cap Stocks That Created a New All Time High Today
- 4.3: Top Small Cap Stocks That Created a New All Time High Today
Top Indices Performance Overview
| Stock | Close | Range |
|---|---|---|
| NIFTY 50 | ₹24,672.84 (0.4%) | ₹24,607.19 – ₹24,734.3 |
| NIFTY BANK | ₹50,719.1 (0.69%) | ₹50,398.6 – ₹51,025.6 |
| NIFTY FIN SERVICE | ₹23,138.09 (0.93%) | ₹22,926.8 – ₹23,247.19 |
| NIFTY IT | ₹41,572.8 (0.81%) | ₹41,366.19 – ₹41,746.55 |
| NIFTY AUTO | ₹25500 (0.51%) | ₹25,377.59 – ₹25,538.44 |
| NIFTY ENERGY | ₹43,527.64 (0.45%) | ₹43,369.8 – ₹43592 |
Nifty 50 Performance Overview
The Nifty 50 started the day at ₹24,648.9, showcasing its typical dynamic nature. Throughout the trading session, the index swung between a low of ₹24,607.19 and a high of ₹24,734.3 before settling at ₹24,672.84, marking a positive close of +0.4%.
The performance of top gainers and losers significantly influenced today’s Nifty 50 movement. Take a look at the table below to see which stocks drove the action.
Nifty 50 Top Gainers
| Stock | Close | Range |
|---|---|---|
| SBI Life Insurance | ₹1,761.3 (5.36%) | ₹1,672.75 – ₹1,770.8 |
| HDFC Life | ₹710.59 (3.62%) | ₹684.04 – ₹713 |
| Bajaj Finserv | ₹1,602.09 (3.28%) | ₹1,551.5 – ₹1,624.9 |
| IndusInd Bank | ₹1,379.34 (2.35%) | ₹1,357.19 – ₹1,391.65 |
| Tech Mahindra | ₹1629 (2.15%) | ₹1,595.25 – ₹1,633.65 |
Nifty 50 Top Losers
| Stock | Close | Range |
|---|---|---|
| Bharti Airtel | ₹1,449.15 (-1.4%) | ₹1,446.5 – ₹1,484.75 |
| Cipla | ₹1,562.84 (-0.81%) | ₹1,558.19 – ₹1579 |
| Apollo Hospitals | ₹6,672.89 (-0.78%) | ₹6650 – ₹6,788.6 |
| ITC | ₹498.79 (-0.54%) | ₹497.7 – ₹503.39 |
| Tata Motors | ₹1,086.58 (-0.11%) | ₹1,082.05 – ₹1,098.05 |
Nifty 50 Stocks To Watch for Tomorrow
➲ HCL (Looking Bullish)
- Performance Overview: Over the past 25 trading days, HCL Technologies has closed higher than the previous day 14 times and closed lower 10 times.
- Recent Trend: HCL has been on a roll, closing higher each day for the last 5 days – a green streak since Monday, August 12, 2024.
- Returns: If you had invested ₹10,000 in HCL Technologies over the past 25 trading days, your investment would have grown by 6.75% to ₹10,674.99.
- Financial Insight: In the last 12 months, HCL Technologies has generated impressive revenue of ₹1,12,771.71 Crore and a strong profit of ₹16,470 Crore.
- As of Tuesday, August 20, 2024, HCL Technologies boasts a Market Capital of ₹4,40,057.3 Crore.
- Summary: HCL Technologies is showing strong signs of potential growth. Investors looking for opportunities might want to keep a close eye on its price movements. To see possible short-term and long-term price targets for HCL, check out: HCL Target for Tomorrow and HCL Targets for 2024 & 2025.
HCL Financial Performance
| Metric | Value | Description |
|---|---|---|
| Market Capital | 4,40,057.3 Crore | Market valuation of HCL’s shares. |
| Revenue (TTM) | 1,12,771.71 Crore | Total revenue generated by HCL over the past twelve months. |
| Net Income (TTM) | +16,470 Crore | Net Profit or Loss after all the expenses over the past twelve months. |
| Operating Margin | 17.09% | Income from operations as a percentage of revenue, before taxes and interest. |
| Profit Margin | 14.6% | Net income as a percentage of revenue, after all expenses. |
| Revenue Growth (Quarterly) | +5.09% | Change in revenue compared to the previous quarter. |
| Earnings Growth (YOY Quarterly) | +15.3% | Change in earnings compared to the same quarter last year. |
| Debt-to-Equity (D/E) Ratio | 8.17 | Company’s total debt divided by total shareholder equity. |
| Total Debt | 5,531.97 Crore | Sum of HCL’s current & long-term financial obligations. |
| Total Cash | 26,417.49 Crore | Total amount of liquid funds available to HCL. |
| Beta | 0.61 | Beta is less than 1 indicating that the HCL’s price is less volatile than the market. |
➲ Bharti Airtel (Looking Bearish)
- Recent Performance: Over the past 25 trading days, Bharti Airtel has closed lower 12 times and higher 13 times.
- Current Trend: Bharti Airtel has experienced a bit of a dip, closing lower for the past two days, with the last green close on Friday, August 16th, 2024.
- Returns Over the Past Month: Bharti Airtel has delivered a modest 1.1% return over the last 25 trading sessions. If you invested ₹10,000 during that time, it would have grown to ₹10,109.99.
- Financial Snapshot: In the last 12 months, Bharti Airtel generated ₹1,51,048.8 Crore in revenue and achieved a profit of ₹10,014.39 Crore.
- Market Value: As of Tuesday, August 20th, 2024, Bharti Airtel has a market capitalization of ₹8,86,707.42 Crore.
- Keep an Eye On: Bharti Airtel is currently showing some bearish signs. Keep a close watch on its performance. You might want to check out the Bharti Airtel Target for Tomorrow and Bharti Airtel Targets for 2024 & 2025 for insights.
Bharti Airtel Financial Performance
| Metric | Value | Description |
|---|---|---|
| Market Capital | 8,86,707.42 Crore | Market valuation of Bharti Airtel’s shares. |
| Revenue (TTM) | 1,51,048.8 Crore | Total revenue generated by Bharti Airtel over the past twelve months. |
| Net Income (TTM) | +10,014.39 Crore | Net Profit or Loss after all the expenses over the past twelve months. |
| Operating Margin | 23.8% | Income from operations as a percentage of revenue, before taxes and interest. |
| Profit Margin | 6.63% | Net income as a percentage of revenue, after all expenses. |
| Revenue Growth (Quarterly) | +2.8% | Change in revenue compared to the previous quarter. |
| Earnings Growth (YOY Quarterly) | +158% | Change in earnings compared to the same quarter last year. |
| Debt-to-Equity (D/E) Ratio | 186.43 | Company’s total debt divided by total shareholder equity. |
| Total Debt | 2,08,874.29 Crore | Sum of Bharti Airtel’s current & long-term financial obligations. |
| Total Cash | 13,266 Crore | Total amount of liquid funds available to Bharti Airtel. |
| Beta | 0.25 | Beta is less than 1 indicating that the Bharti Airtel’s price is less volatile than the market. |
Nifty 500 Performance Overview
The Nifty 500 kicked off the day at ₹23,223.59, showing some energetic movement throughout the session. It touched a low of ₹23,175.4 before climbing to a high of ₹23,292.69. By the end of the day, it closed strong at ₹23,280.34, a solid +0.6% gain.
Take a look at the table below to see the top gainers and losers that shaped the Nifty 500’s performance today.
Nifty 500 Top Gainers
| Stock | Close | Range |
|---|---|---|
| Angel One | ₹2,696.89 (15.19%) | ₹2,348.3 – ₹2,739.94 |
| Vaibhav Global | ₹341.35 (12.61%) | ₹299.7 – ₹344.5 |
| Poonawalla Fincorp | ₹399.75 (7.74%) | ₹371.39 – ₹402 |
| KEI Industries | ₹4705 (7.73%) | ₹4475 – ₹4,779.89 |
| Godfrey Phillips | ₹5,640.5 (7.67%) | ₹5,187.6 – ₹5990 |
Nifty 500 Top Losers
| Stock | Close | Range |
|---|---|---|
| Mazagoan Dock Shipbuilders | ₹4296 (-9.08%) | ₹4281 – ₹4,702.35 |
| Firstsource Solutions | ₹323 (-4.26%) | ₹319.25 – ₹343.7 |
| Sharda Cropchem | ₹558 (-3.87%) | ₹555.65 – ₹585.84 |
| Cochin Shipyard | ₹2,074.39 (-3.77%) | ₹2,039.09 – ₹2158 |
| Triveni Engineering & Industries | ₹450.75 (-3.12%) | ₹444.1 – ₹466.89 |
Nifty 51 to 500 Stocks To Watch for Tomorrow
➲ Mankind Pharma (Strong Bullish Pattern)
- Performance Snapshot: Over the past 25 trading days, Mankind Pharma has closed higher 14 times and lower 11 times.
- Recent Trend: Mankind Pharma has been on a 10-day winning streak, consistently closing in the green since Monday, August 5th, 2024.
- Returns: Mankind Pharma delivered a strong 8.7% return over the last 25 trading days. That means an investment of ₹10,000 would have grown to ₹10,870 during that time.
- Financial Highlights: In the past year, Mankind Pharma generated impressive revenue of ₹10,649.57 Crore and recorded a profit of ₹1,962.51 Crore.
- As of Tuesday, August 20th, 2024, Mankind Pharma has a Market Capital of ₹92,184.17 Crore.
- Summary: Mankind Pharma is exhibiting a strong bullish trend. Investors may want to keep an eye on its price movements and consider both short-term and long-term growth opportunities. Check out Mankind Pharma’s Target for Tomorrow and Mankind Pharma’s Targets for 2024 & 2025 for more insights.
Mankind Pharma Financial Performance
| Metric | Value | Description |
|---|---|---|
| Market Capital | 92,184.17 Crore | Market valuation of Mankind Pharma’s shares. |
| Revenue (TTM) | 10,649.57 Crore | Total revenue generated by Mankind Pharma over the past twelve months. |
| Net Income (TTM) | +1,962.51 Crore | Net Profit or Loss after all the expenses over the past twelve months. |
| Operating Margin | 19.83% | Income from operations as a percentage of revenue, before taxes and interest. |
| Profit Margin | 18.42% | Net income as a percentage of revenue, after all expenses. |
| Revenue Growth (Quarterly) | +12.2% | Change in revenue compared to the previous quarter. |
| Earnings Growth (YOY Quarterly) | +10.19% | Change in earnings compared to the same quarter last year. |
| Debt-to-Equity (D/E) Ratio | 2.16 | Company’s total debt divided by total shareholder equity. |
| Total Debt | 207.17 Crore | Sum of Mankind Pharma’s current & long-term financial obligations. |
| Total Cash | 3,386.49 Crore | Total amount of liquid funds available to Mankind Pharma. |
➲ Timken India (Bearish Trend)
- Performance Overview: Over the past 25 trading days, Timken India has closed lower 17 times and higher 8 times.
- Recent Trend: Timken India has been on a downward trend for the past 7 days, closing lower each day since Thursday, August 8th, 2024.
- Returns: If you had invested ₹10,000 in Timken India over the last 25 trading days, your investment would be worth ₹8,897, representing a loss of 11.03%.
- Financial Insight: Over the past 12 months, Timken India generated revenue of ₹2,909.54 Crore and achieved a profit of ₹392.14 Crore.
- As of Tuesday, August 20th, 2024, Timken India has a Market Capital of ₹31,142.42 Crore.
- Summary: Timken India is currently experiencing a bearish phase. We recommend keeping a close eye on its performance, especially its potential price movements in the near future. You can explore potential price targets for Timken India in the coming days and for the year ahead by visiting these links: Timken India Target for Tomorrow and Timken India Targets for 2024 & 2025.
Timken India Financial Performance
| Metric | Value | Description |
|---|---|---|
| Market Capital | 31,142.42 Crore | Market valuation of Timken India’s shares. |
| Revenue (TTM) | 2,909.54 Crore | Total revenue generated by Timken India over the past twelve months. |
| Net Income (TTM) | +392.14 Crore | Net Profit or Loss after all the expenses over the past twelve months. |
| Operating Margin | 19.7% | Income from operations as a percentage of revenue, before taxes and interest. |
| Profit Margin | 13.47% | Net income as a percentage of revenue, after all expenses. |
| Revenue Growth (Quarterly) | +11.89% | Change in revenue compared to the previous quarter. |
| Earnings Growth (YOY Quarterly) | +35.4% | Change in earnings compared to the same quarter last year. |
| Debt-to-Equity (D/E) Ratio | 1.04 | Company’s total debt divided by total shareholder equity. |
| Total Debt | 25.36 Crore | Sum of Timken India’s current & long-term financial obligations. |
| Total Cash | 491.85 Crore | Total amount of liquid funds available to Timken India. |
| Beta | 0.47 | Beta is less than 1 indicating that the Timken India’s price is less volatile than the market. |
Top Stocks That Created a New All Time High Today
Top Large Cap Stocks That Created a New All Time High Today
Companies with Market Capital more than 20,000 Crores| Stock | Close | New All-Time High (ATH) | Previous ATH | Previous ATH Date |
|---|---|---|---|---|
| Ashok Leyland | 260.00 (+0.97%) | 261.75 (+%) | Thu 01 Jan 1970 | |
| Aurobindo Pharma | 1537.30 (+1.19%) | 1543.25 (+%) | Thu 01 Jan 1970 | |
| Colgate Palmolive | 3557.19 (+0.28%) | 3577.64 (+27.09%) | 2814.89 | Wed 03 Apr 2024 |
| Dixon Technologies | 12675.70 (-0.82%) | 12920.00 (+61.84%) | 7983.00 | Fri 12 Apr 2024 |
| GE T&D India | 1810.00 (+0.55%) | 1889.90 (+74.06%) | 1085.75 | Wed 24 Apr 2024 |
Top Mid Cap Stocks That Created a New All Time High Today
Companies with Market Capital between 5,000 Crores to 20,000 Crores| Stock | Close | New All-Time High (ATH) | Previous ATH | Previous ATH Date |
|---|---|---|---|---|
| Balrampur Chinni | 570.84 (+7.3%) | 578.20 (+%) | Thu 01 Jan 1970 | |
| Bombay Burmah Trading Corp | 2510.94 (+5.5%) | 2548.00 (+%) | Thu 01 Jan 1970 | |
| CMS Info Systems | 574.04 (+1.1%) | 601.90 (+%) | Thu 01 Jan 1970 | |
| Gabriel India | 535.50 (+5.87%) | 535.65 (+%) | Thu 01 Jan 1970 | |
| GENUSPOWER | 417.20 (+2.24%) | 427.95 (+%) | Thu 01 Jan 1970 |
Top Small Cap Stocks That Created a New All Time High Today
Companies with Market Capital less than 5,000 Crores| Stock | Close | New All-Time High (ATH) | Previous ATH | Previous ATH Date |
|---|---|---|---|---|
| Archidply | 144.53 (+1.35%) | 153.00 (+%) | Thu 01 Jan 1970 | |
| Bits | 8.22 (+1.98%) | 8.22 (+%) | Thu 01 Jan 1970 | |
| BTTL | 62.51 (+2.2%) | 69.20 (+%) | Thu 01 Jan 1970 | |
| Ceenik Exports | 1263.84 (+1.99%) | 1263.84 (+147.23%) | 511.20 | Wed 24 Apr 2024 |
| Chemfab Alkalis | 941.25 (+1.09%) | 977.59 (+33.05%) | 734.70 | Mon 11 Mar 2024 |