Home / Thu 22 Aug 2024 Market Recap
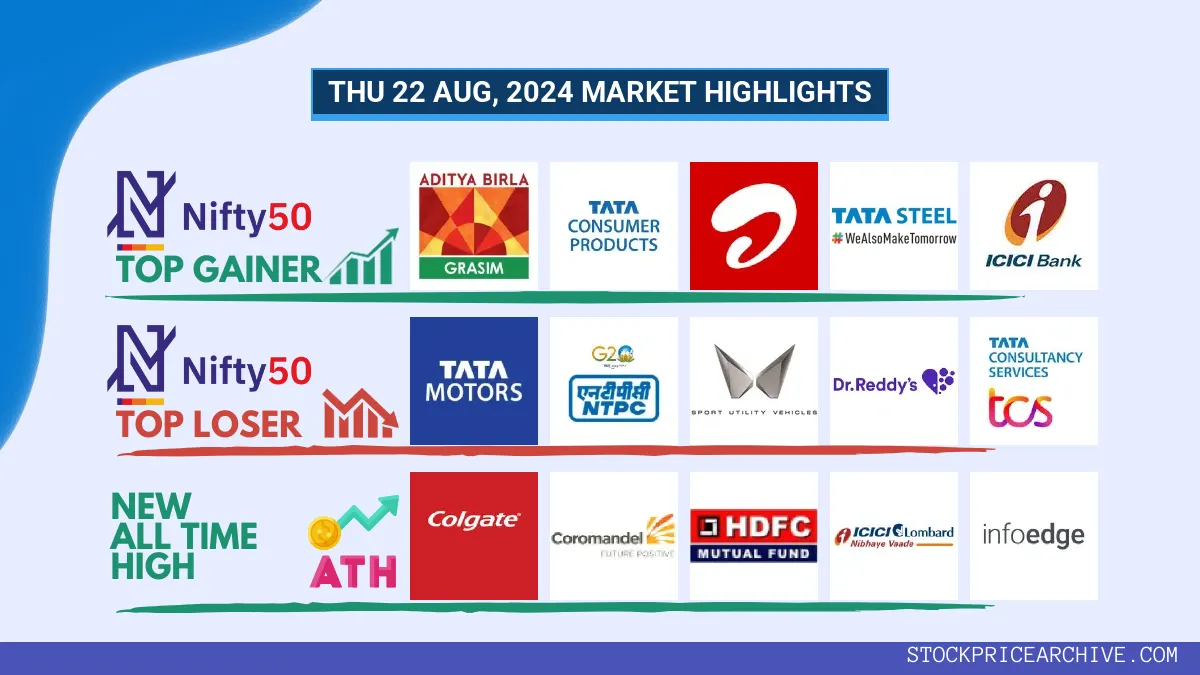
22 Aug 2024: Nifty 50 Closed at ₹24,811.5 (+0.16%), TITAN & Berger Paints enjoying 7-day winning streak.

Show Table of Contents
Table of Contents
- 1: Top Indices Performance Overview
- 2: Nifty 50 Performance Overview
- 2.1: Nifty 50 Top Gainers
- 2.2: Nifty 50 Top Losers
- 2.3: Nifty 50 Stocks To Watch for Tomorrow
- 2.3.1: ➲ TITAN (Looking Strong)
- 2.3.2: ➲ Tata Motors (Bearish Trend)
- 3: Nifty 500 Performance Overview
- 3.1: Nifty 500 Top Gainers
- 3.2: Nifty 500 Top Losers
- 3.3: Nifty 51 to 500 Stocks To Watch for Tomorrow
- 3.3.1: ➲ Berger Paints (Looking Bullish)
- 3.3.2: ➲ Gujarat Fluorochemical (Bearish Trend)
- 4: Top Stocks That Created a New All Time High Today
- 4.1: Top Large Cap Stocks That Created a New All Time High Today
- 4.2: Top Mid Cap Stocks That Created a New All Time High Today
- 4.3: Top Small Cap Stocks That Created a New All Time High Today
Top Indices Performance Overview
| Stock | Close | Range |
|---|---|---|
| NIFTY 50 | ₹24,811.5 (0.16%) | ₹24,784.44 – ₹24,867.34 |
| NIFTY BANK | ₹50,985.69 (0.59%) | ₹50,794.44 – ₹51080 |
| NIFTY FIN SERVICE | ₹23,247.15 (0.36%) | ₹23,163.44 – ₹23,283.84 |
| NIFTY IT | ₹41,501.44 (-0.17%) | ₹41,406.75 – ₹41,832.05 |
| NIFTY ENERGY | ₹43,331.25 (-0.6%) | ₹43,249.44 – ₹43,725.89 |
Nifty 50 Performance Overview
The Nifty 50 started the day at ₹24,863.4, showcasing a bit of a roller coaster ride throughout the session. It dipped to a low of ₹24,784.44 before climbing back up to a high of ₹24,867.34. The index ultimately closed the day at ₹24,811.5, up 0.16% from its starting point.
The day’s movement was influenced by some notable gainers and losers, which you can find detailed in the table below.
Nifty 50 Top Gainers
| Stock | Close | Range |
|---|---|---|
| GRASIM | ₹2,755.14 (2.61%) | ₹2,698.44 – ₹2,772.94 |
| Tata Consumer Products | ₹1,205.8 (2.39%) | ₹1181 – ₹1,209.83 |
| Bharti Airtel | ₹1,486.9 (1.6%) | ₹1,466.8 – ₹1,499.65 |
| Tata Steel | ₹154.13 (1.46%) | ₹152.5 – ₹154.35 |
| ICICI BANK | ₹1,191.08 (1.38%) | ₹1,176.83 – ₹1,192.58 |
Nifty 50 Top Losers
| Stock | Close | Range |
|---|---|---|
| Tata Motors | ₹1,068.44 (-1.55%) | ₹1,065.44 – ₹1,094.75 |
| NTPC | ₹403.35 (-1.37%) | ₹402.25 – ₹410.04 |
| Mahindra & Mahindra | ₹2,732.94 (-1.32%) | ₹2,724.05 – ₹2,775.75 |
| Dr Reddy Lab | ₹6980 (-1.17%) | ₹6,926.45 – ₹7,035.79 |
| TCS | ₹4502 (-1.09%) | ₹4,497.2 – ₹4,560.95 |
Nifty 50 Stocks To Watch for Tomorrow
➲ TITAN (Looking Strong)
- Performance Snapshot: Over the past 25 trading days, TITAN closed higher on 14 occasions and lower on 11.
- Recent Trend: TITAN has enjoyed a 7-day winning streak, with prices consistently rising since Monday, August 12th, 2024.
- Returns: TITAN delivered a solid 11.48% return over the past 25 trading days. This means an investment of ₹10,000 would have grown to ₹11,148.
- Financial Snapshot: In the past year, TITAN generated impressive revenue of ₹51,084 Crore and a profit of ₹3,495.99 Crore.
- As of Thursday, August 22nd, 2024, TITAN has a Market Capitalization of ₹3,06,218.19 Crore.
- Key Takeaway: TITAN’s recent performance suggests a positive trend, making it an interesting prospect for investors seeking growth potential. To explore potential short-term and long-term opportunities, check out: TITAN Target for Tomorrow and TITAN Targets for 2024 & 2025.
TITAN Financial Performance
| Metric | Value | Description |
|---|---|---|
| Market Capital | 3,06,218.19 Crore | Market valuation of TITAN’s shares. |
| Revenue (TTM) | 51,084 Crore | Total revenue generated by TITAN over the past twelve months. |
| Net Income (TTM) | +3,495.99 Crore | Net Profit or Loss after all the expenses over the past twelve months. |
| Operating Margin | 8.26% | Income from operations as a percentage of revenue, before taxes and interest. |
| Profit Margin | 6.84% | Net income as a percentage of revenue, after all expenses. |
| Revenue Growth (Quarterly) | +20.6% | Change in revenue compared to the previous quarter. |
| Earnings Growth (YOY Quarterly) | +5.6% | Change in earnings compared to the same quarter last year. |
| Debt-to-Equity (D/E) Ratio | 165.31 | Company’s total debt divided by total shareholder equity. |
| Total Debt | 15,527.99 Crore | Sum of TITAN’s current & long-term financial obligations. |
| Total Cash | 3,192 Crore | Total amount of liquid funds available to TITAN. |
| Beta | 0.46 | Beta is less than 1 indicating that the TITAN’s price is less volatile than the market. |
➲ Tata Motors (Bearish Trend)
- Recent Performance: In the last 25 trading days, Tata Motors has closed higher 13 times and lower 12 times. This suggests a somewhat mixed performance over the recent past.
- Current Trend: Tata Motors has been on a downward trend for the past 4 days, closing lower each day since Friday, August 16, 2024.
- Returns: Over the last 25 trading days, Tata Motors has delivered a 4.44% return. So, if you had invested ₹10,000 on August 1st, your investment would be worth ₹10,444 today.
- Financial Snapshot: Over the past year, Tata Motors generated ₹4,37,927.77 Crore in revenue and earned a profit of ₹31,399.09 Crore.
- As of Thursday, August 22, 2024, Tata Motors has a Market Capitalization of ₹3,52,846.53 Crore.
- In Summary: Tata Motors is currently facing a bearish trend. We recommend investors stay informed and carefully monitor the stock’s direction. For insights on short-term and long-term prospects, consider checking out Tata Motors Target for Tomorrow and Tata Motors Targets for 2024 & 2025.
Tata Motors Financial Performance
| Metric | Value | Description |
|---|---|---|
| Market Capital | 3,52,846.53 Crore | Market valuation of Tata Motors’s shares. |
| Revenue (TTM) | 4,37,927.77 Crore | Total revenue generated by Tata Motors over the past twelve months. |
| Net Income (TTM) | +31,399.09 Crore | Net Profit or Loss after all the expenses over the past twelve months. |
| Operating Margin | 9.32% | Income from operations as a percentage of revenue, before taxes and interest. |
| Profit Margin | 7.17% | Net income as a percentage of revenue, after all expenses. |
| Revenue Growth (Quarterly) | +13.3% | Change in revenue compared to the previous quarter. |
| Earnings Growth (YOY Quarterly) | +221.89% | Change in earnings compared to the same quarter last year. |
| Debt-to-Equity (D/E) Ratio | 112.15 | Company’s total debt divided by total shareholder equity. |
| Total Debt | 1,07,262.5 Crore | Sum of Tata Motors’s current & long-term financial obligations. |
| Total Cash | 60,059.92 Crore | Total amount of liquid funds available to Tata Motors. |
| Beta | 1.81 | Beta is greater than 1 indicating that the Tata Motors’s price is more volatile than the market. |
Nifty 500 Performance Overview
The Nifty 500 kicked off the day at ₹23,468.44, showing some volatility throughout the session. It dipped to a low of ₹23,409.09 before climbing to a high of ₹23,474.8. The index ultimately closed at ₹23,437.25, ending the day with a +0.29% gain.
Let’s take a look at the top gainers and losers that influenced the Nifty 500’s movement today:
Nifty 500 Top Gainers
| Stock | Close | Range |
|---|---|---|
| Varroc Engineering | ₹604.9 (12.85%) | ₹538 – ₹618.79 |
| Sumitomo Chemical India | ₹542.25 (7.49%) | ₹540.09 – ₹567.34 |
| Archean Chemical | ₹817.09 (7.16%) | ₹765.5 – ₹831.2 |
| Aarti Drugs | ₹566.45 (6.27%) | ₹558.75 – ₹592.04 |
| Shyam Metalics and Energy | ₹810.2 (6.15%) | ₹801.75 – ₹844.5 |
Nifty 500 Top Losers
| Stock | Close | Range |
|---|---|---|
| Sterlite Technologies | ₹137.69 (-6.65%) | ₹137.05 – ₹140 |
| Sundram Fasteners | ₹1,341.4 (-5.53%) | ₹1318 – ₹1,349.19 |
| Sun Pharma Advanced Research Company | ₹214.89 (-5.2%) | ₹212.02 – ₹216.16 |
| Glaxosmithkline | ₹2,911.55 (-4.9%) | ₹2,910.44 – ₹3,069.1 |
| Adani Power | ₹673 (-3.3%) | ₹671.34 – ₹697.5 |
Nifty 51 to 500 Stocks To Watch for Tomorrow
➲ Berger Paints (Looking Bullish)
- Recent Performance: Over the past 25 trading days, Berger Paints has closed higher 16 times and lower 9 times, showing a positive trend.
- On a Roll: Berger Paints has been on a strong run, closing higher every day for the last 7 days, starting on Monday, August 12, 2024.
- Returns: Your investment in Berger Paints would have grown significantly! Over the last 25 trading days, the stock has delivered a 14.34% return. This means that a ₹10,000 investment would have grown to ₹11,434.
- Financially Sound: Over the past year, Berger Paints has generated strong revenue of ₹11,260.5 Crore and a healthy profit of ₹1,166.94 Crore.
- Market Value: As of Thursday, August 22, 2024, Berger Paints has a market capitalization of ₹64,107.34 Crore, reflecting its substantial size and investor confidence.
- Looking Ahead: Berger Paints is showing positive signs and looks promising for investors. To help you make informed decisions, we’ve provided resources to explore potential short-term and long-term price targets: Checkout Berger Paints Target for Tomorrow and Berger Paints Targets for 2024 & 2025.
Berger Paints Financial Performance
| Metric | Value | Description |
|---|---|---|
| Market Capital | 64,107.34 Crore | Market valuation of Berger Paints’s shares. |
| Revenue (TTM) | 11,260.5 Crore | Total revenue generated by Berger Paints over the past twelve months. |
| Net Income (TTM) | +1,166.94 Crore | Net Profit or Loss after all the expenses over the past twelve months. |
| Operating Margin | 14.08% | Income from operations as a percentage of revenue, before taxes and interest. |
| Profit Margin | 10.36% | Net income as a percentage of revenue, after all expenses. |
| Revenue Growth (Quarterly) | +2% | Change in revenue compared to the previous quarter. |
| Earnings Growth (YOY Quarterly) | -0.2% | Change in earnings compared to the same quarter last year. |
| Debt-to-Equity (D/E) Ratio | 13.97 | Company’s total debt divided by total shareholder equity. |
| Total Debt | 753.28 Crore | Sum of Berger Paints’s current & long-term financial obligations. |
| Total Cash | 556.03 Crore | Total amount of liquid funds available to Berger Paints. |
| Beta | 0.39 | Beta is less than 1 indicating that the Berger Paints’s price is less volatile than the market. |
➲ Gujarat Fluorochemical (Bearish Trend)
- Performance Overview: Over the past 25 trading days, Gujarat Fluorochemical has closed lower than the previous day’s close 15 times, while it closed higher 10 times.
- Recent Trend: Gujarat Fluorochemical has been on a downward trend for the past four days, without a single day closing higher since Friday, August 16, 2024.
- Returns: In the last 25 trading days, Gujarat Fluorochemical has yielded a return of -5.08%. This means an investment of ₹10,000 would have become ₹9,492 during this period.
- Financial Insight: Over the past 12 months, Gujarat Fluorochemical has generated a revenue of ₹4,246.82 Crore and generated a profit of ₹341.95 Crore.
- As of Thursday, August 22, 2024, Gujarat Fluorochemical has a Market Capital of ₹37,645.59 Crore.
- Summary: Gujarat Fluorochemical is currently experiencing a bearish phase. We advise investors to keep a close watch on its performance, particularly its short-term price target for tomorrow and its projected price targets for 2024 and 2025.
Gujarat Fluorochemical Financial Performance
| Metric | Value | Description |
|---|---|---|
| Market Capital | 37,645.59 Crore | Market valuation of Gujarat Fluorochemical’s shares. |
| Revenue (TTM) | 4,246.82 Crore | Total revenue generated by Gujarat Fluorochemical over the past twelve months. |
| Net Income (TTM) | +341.95 Crore | Net Profit or Loss after all the expenses over the past twelve months. |
| Operating Margin | 14.29% | Income from operations as a percentage of revenue, before taxes and interest. |
| Profit Margin | 8.05% | Net income as a percentage of revenue, after all expenses. |
| Revenue Growth (Quarterly) | -2.8% | Change in revenue compared to the previous quarter. |
| Earnings Growth (YOY Quarterly) | -46.3% | Change in earnings compared to the same quarter last year. |
| Debt-to-Equity (D/E) Ratio | 35.3 | Company’s total debt divided by total shareholder equity. |
| Total Debt | 2,095.95 Crore | Sum of Gujarat Fluorochemical’s current & long-term financial obligations. |
| Total Cash | 198.44 Crore | Total amount of liquid funds available to Gujarat Fluorochemical. |
| Beta | 0.48 | Beta is less than 1 indicating that the Gujarat Fluorochemical’s price is less volatile than the market. |
Top Stocks That Created a New All Time High Today
Top Large Cap Stocks That Created a New All Time High Today
Companies with Market Capital more than 20,000 Crores| Stock | Close | New All-Time High (ATH) | Previous ATH | Previous ATH Date |
|---|---|---|---|---|
| Abbott | 29156.59 (+1.93%) | 29942.09 (+%) | Thu 01 Jan 1970 | |
| Colgate Palmolive | 3598.60 (+0.67%) | 3613.39 (+28.36%) | 2814.89 | Wed 03 Apr 2024 |
| Coromandel International | 1781.55 (+1.11%) | 1789.00 (+%) | Thu 01 Jan 1970 | |
| HDFC Asset Management | 4425.39 (+0.81%) | 4438.85 (+%) | Thu 01 Jan 1970 | |
| ICICI Lombard | 2083.19 (+1.13%) | 2090.35 (+20.48%) | 1734.90 | Wed 28 Feb 2024 |
Top Mid Cap Stocks That Created a New All Time High Today
Companies with Market Capital between 5,000 Crores to 20,000 Crores| Stock | Close | New All-Time High (ATH) | Previous ATH | Previous ATH Date |
|---|---|---|---|---|
| Aarti Pharmalabs | 668.00 (+3.45%) | 688.54 (+%) | Thu 01 Jan 1970 | |
| Balrampur Chinni | 585.00 (+4.45%) | 585.25 (+%) | Thu 01 Jan 1970 | |
| BALUFORGE | 646.50 (+4.97%) | 650.09 (+%) | Thu 01 Jan 1970 | |
| Deepak Fertilisers | 1060.05 (+0.91%) | 1083.09 (+%) | Thu 01 Jan 1970 | |
| Epigral | 2001.00 (+3.62%) | 2024.84 (+42.1%) | 1424.90 | Mon 22 Apr 2024 |
Top Small Cap Stocks That Created a New All Time High Today
Companies with Market Capital less than 5,000 Crores| Stock | Close | New All-Time High (ATH) | Previous ATH | Previous ATH Date |
|---|---|---|---|---|
| 20 Microns | 336.89 (+3.15%) | 346.45 (+%) | Thu 01 Jan 1970 | |
| 21ST CENTURY MANAG | 107.21 (+1.99%) | 107.21 (+%) | Thu 01 Jan 1970 | |
| Ace Men Engg Works | 80.00 (-2.22%) | 85.90 (+%) | Thu 01 Jan 1970 | |
| B & A Packaging India | 396.20 (+4.26%) | 407.14 (+%) | Thu 01 Jan 1970 | |
| BELLACASA | 480.04 (+5.57%) | 482.00 (+%) | Thu 01 Jan 1970 |


![19 Jul 2024: Nifty 50 Closes at ₹24,530.9 (-1.09%), ITC [Bullish] closing higher for the past 6 days, HDFC Bank [Bearish] closing lower for the past 4 days](https://stockpricearchive.com/wp-content/uploads/2024/07/fri-19-jul-2024-market-highlights-440x264.webp)


