Home / Tue 13 Aug 2024 Market Recap
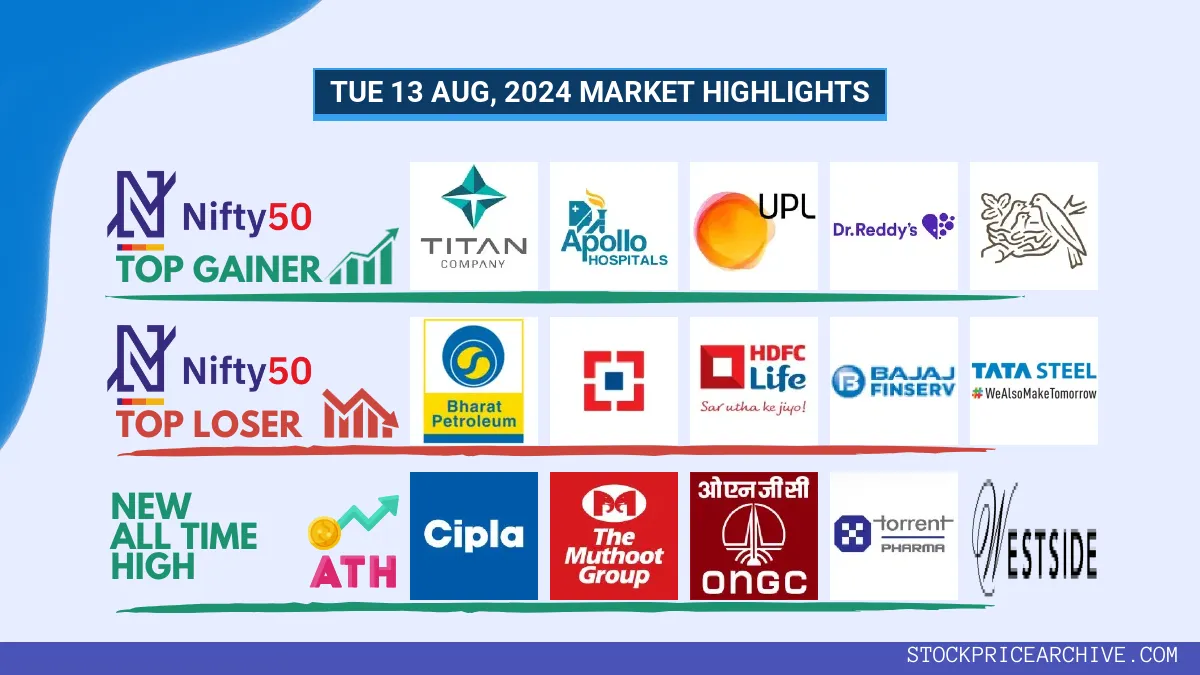
13 Aug 2024: Nifty Closes at ₹24,138.55 (-0.86%), Apollo Hospitals & Bajaj Auto Lead the Pack, Ipca Labs Closing in Green Past 6-days
Show Table of Contents
Table of Contents
- 1: Top Indices Performance Overview
- 2: Nifty 50 Performance Overview
- 2.1: Nifty 50 Top Gainers
- 2.2: Nifty 50 Top Losers
- 2.3: Nifty 50 Stocks To Watch for Tomorrow
- 2.3.1: ➲ Apollo Hospitals (Looking Bullish)
- 2.3.2: ➲ Bajaj Auto (Bearish Trend)
- 3: Nifty 500 Performance Overview
- 3.1: Nifty 500 Top Gainers
- 3.2: Nifty 500 Top Losers
- 3.3: Nifty 51 to 500 Stocks To Watch for Tomorrow
- 3.3.1: ➲ Ipca Labs (Looking Bullish!)
- 3.3.2: ➲ Bata India (Bearish Pattern)
- 4: Top Stocks That Created a New All Time High Today
- 4.1: Top Large Cap Stocks That Created a New All Time High Today
- 4.2: Top Mid Cap Stocks That Created a New All Time High Today
- 4.3: Top Small Cap Stocks That Created a New All Time High Today
Top Indices Performance Overview
| Stock | Close | Range |
|---|---|---|
| NIFTY 50 | ₹24,138.55 (-0.86%) | ₹24,116.5 – ₹24,359.94 |
| NIFTY BANK | ₹49,853.69 (-1.44%) | ₹49,785.1 – ₹50,559.25 |
| NIFTY FIN SERVICE | ₹22,618.44 (-1.79%) | ₹22,574.5 – ₹22,989.15 |
| NIFTY IT | ₹39,114.85 (0.01%) | ₹38,972.69 – ₹39,383.3 |
| NIFTY AUTO | ₹25,081.84 (-0.78%) | ₹25,041.94 – ₹25,362.34 |
| NIFTY ENERGY | ₹42,570.35 (-0.81%) | ₹42,455.6 – ₹43,132.69 |
Nifty 50 Performance Overview
The Nifty 50 kicked off the day at ₹24,351.05. While it saw some ups and downs throughout the session, ultimately it closed the day slightly lower. The index reached a peak of ₹24,359.94, before dipping to a low of ₹24,116.5. In the end, it settled at ₹24,138.55, representing a -0.86% decline for the day.
The table below highlights the top gainers and losers that influenced the Nifty 50’s performance today.
Nifty 50 Top Gainers
| Stock | Close | Range |
|---|---|---|
| TITAN | ₹3389 (2.05%) | ₹3,305.39 – ₹3,404.75 |
| Apollo Hospitals | ₹6,589.39 (1.33%) | ₹6,510.29 – ₹6642 |
| UPL | ₹552.5 (0.85%) | ₹550.79 – ₹566.09 |
| Dr Reddy Lab | ₹6,940.04 (0.77%) | ₹6,851.25 – ₹6,962.25 |
| Nestle India | ₹2,484.69 (0.46%) | ₹2,473.5 – ₹2492 |
Nifty 50 Top Losers
| Stock | Close | Range |
|---|---|---|
| Bharat Petroleum | ₹321.6 (-3.54%) | ₹321 – ₹332.75 |
| HDFC BANK | ₹1,605.84 (-3.27%) | ₹1,601.15 – ₹1,632.4 |
| HDFC Life | ₹684.09 (-2.62%) | ₹677.5 – ₹707.29 |
| Bajaj Finance | ₹6,465.04 (-2.17%) | ₹6,452.2 – ₹6,644.95 |
| Tata Steel | ₹148.85 (-2.12%) | ₹148.5 – ₹152.94 |
Nifty 50 Stocks To Watch for Tomorrow
➲ Apollo Hospitals (Looking Bullish)
- Performance Snapshot: Over the last 25 trading days, Apollo Hospitals has closed higher 15 times and lower 10 times. That’s a pretty good run!
- Recent Trend: Apollo Hospitals has been on a 1-day green streak, with no red days since Monday, August 12, 2024. Let’s see if this momentum continues.
- Returns: Apollo Hospitals delivered a 3.28% return in the past 25 trading days. If you’d invested ₹10,000, you’d be looking at ₹10,328 today. Not bad!
- Financial Spotlight: Over the past 12 months, Apollo Hospitals has generated a revenue of ₹19,059.19 Crore and made a profit of ₹898.6 Crore. These numbers show strong financial performance.
- As of Tuesday, August 13, 2024, Apollo Hospitals has a Market Capital of ₹94,723.39 Crore.
- Summary: Apollo Hospitals is showing strong signs of a bullish trend. Investors will be keeping an eye on its price movements for both short-term and long-term growth potential. Check out Apollo Hospitals Target for Tomorrow and Apollo Hospitals Targets for 2024 & 2025 to see what analysts are predicting.
Apollo Hospitals Financial Performance
| Metric | Value | Description |
|---|---|---|
| Market Capital | 94,723.39 Crore | Market valuation of Apollo Hospitals’s shares. |
| Revenue (TTM) | 19,059.19 Crore | Total revenue generated by Apollo Hospitals over the past twelve months. |
| Net Income (TTM) | +898.6 Crore | Net Profit or Loss after all the expenses over the past twelve months. |
| Operating Margin | 9.19% | Income from operations as a percentage of revenue, before taxes and interest. |
| Profit Margin | 4.71% | Net income as a percentage of revenue, after all expenses. |
| Revenue Growth (Quarterly) | +14.89% | Change in revenue compared to the previous quarter. |
| Earnings Growth (YOY Quarterly) | +75.59% | Change in earnings compared to the same quarter last year. |
| Debt-to-Equity (D/E) Ratio | 72.84 | Company’s total debt divided by total shareholder equity. |
| Total Debt | 5,332.6 Crore | Sum of Apollo Hospitals’s current & long-term financial obligations. |
| Total Cash | 1,189.5 Crore | Total amount of liquid funds available to Apollo Hospitals. |
| Beta | 0.55 | Beta is less than 1 indicating that the Apollo Hospitals’s price is less volatile than the market. |
➲ Bajaj Auto (Bearish Trend)
- Performance Overview: Bajaj Auto has been on a roller coaster ride recently. Over the last 26 trading sessions, it closed in red 13 times and in green 13 times.
- Recent Trend: Bajaj Auto is currently on a two-day losing streak, with no green days since Friday, August 9th, 2024.
- Returns: Bajaj Auto’s performance in the last 26 trading sessions resulted in a modest 0.32% return. This means an investment of ₹10,000 would have grown to ₹10,032.
- Financial Insight: Over the past year, Bajaj Auto has generated a revenue of ₹47,766.08 Crore and achieved a profit of ₹8,005.89 Crore.
- As of Tuesday, August 13th, 2024, Bajaj Auto has a Market Capital of ₹2,73,270.8 Crore.
- Summary: Bajaj Auto is currently experiencing a bearish phase. Investors should keep a close eye on its performance. It’s always smart to check out Bajaj Auto’s Target for Tomorrow and Bajaj Auto’s Targets for 2024 & 2025.
Bajaj Auto Financial Performance
| Metric | Value | Description |
|---|---|---|
| Market Capital | 2,73,270.8 Crore | Market valuation of Bajaj Auto’s shares. |
| Revenue (TTM) | 47,766.08 Crore | Total revenue generated by Bajaj Auto over the past twelve months. |
| Net Income (TTM) | +8,005.89 Crore | Net Profit or Loss after all the expenses over the past twelve months. |
| Operating Margin | 21.28% | Income from operations as a percentage of revenue, before taxes and interest. |
| Profit Margin | 16.76% | Net income as a percentage of revenue, after all expenses. |
| Revenue Growth (Quarterly) | +15% | Change in revenue compared to the previous quarter. |
| Earnings Growth (YOY Quarterly) | +18.09% | Change in earnings compared to the same quarter last year. |
| Debt-to-Equity (D/E) Ratio | 6.16 | Company’s total debt divided by total shareholder equity. |
| Total Debt | 1,785.9 Crore | Sum of Bajaj Auto’s current & long-term financial obligations. |
| Total Cash | 6,298.9 Crore | Total amount of liquid funds available to Bajaj Auto. |
| Beta | 0.94 | Beta is less than 1 indicating that the Bajaj Auto’s price is less volatile than the market. |
Nifty 500 Performance Overview
The Nifty 500 kicked off the day at ₹22,955.59, showing some early energy. It dipped to a low of ₹22,685.44 during the session, but rallied back up, reaching a high of ₹22,958.94. Ultimately, it settled at ₹22,704.15, ending the day with a 0.93% loss.
Let’s take a closer look at the top gainers and losers that influenced the Nifty 500’s movement today.
Nifty 500 Top Gainers
| Stock | Close | Range |
|---|---|---|
| Triveni Turbine | ₹788 (14.5%) | ₹703.25 – ₹838 |
| Trent | ₹6375 (12.94%) | ₹6,330.54 – ₹6440 |
| Triveni Engineering & Industries | ₹412.14 (8.83%) | ₹391.85 – ₹426 |
| Kaynes Technology | ₹4670 (8.63%) | ₹4,298.95 – ₹4740 |
| Olectra Greentech | ₹1,652.9 (7.12%) | ₹1,611.9 – ₹1742 |
Nifty 500 Top Losers
| Stock | Close | Range |
|---|---|---|
| Rallis India | ₹335.95 (-7.56%) | ₹332.85 – ₹356.2 |
| Chambal Fertilizers | ₹489.89 (-7.09%) | ₹487 – ₹530.5 |
| Epigral | ₹1856 (-6.89%) | ₹1,843.5 – ₹2,003.94 |
| BEML | ₹3807 (-6.18%) | ₹3800 – ₹4102 |
| RCF | ₹190.64 (-6.02%) | ₹189.88 – ₹198.28 |
Nifty 51 to 500 Stocks To Watch for Tomorrow
➲ Ipca Labs (Looking Bullish!)
- Performance Snapshot: Over the last 26 trading sessions, Ipca Labs has closed higher 16 times and lower 10 times.
- Recent Trend: Ipca Labs has been on a 6-day winning streak, steadily climbing since Monday, August 5th, 2024.
- Returns: Ipca Labs has delivered a solid 17.11% return in the past 26 trading sessions. That means if you had invested ₹10,000, it would have grown to ₹11,711.
- Financial Highlights: Over the past 12 months, Ipca Labs generated a revenue of ₹7,705.88 Crore and a profit of ₹547.35 Crore.
- As of Tuesday, August 13th, 2024, Ipca Labs has a Market Capital of ₹34,647.08 Crore.
- Summary: Ipca Labs is showing a strong bullish pattern, making it an interesting stock to watch. Investors might want to consider its potential for both short-term and long-term growth. Checkout Ipca Labs Target for Tomorrow and Ipca Labs Targets for 2024 & 2025.
Ipca Labs Financial Performance
| Metric | Value | Description |
|---|---|---|
| Market Capital | 34,647.08 Crore | Market valuation of Ipca Labs’s shares. |
| Revenue (TTM) | 7,705.88 Crore | Total revenue generated by Ipca Labs over the past twelve months. |
| Net Income (TTM) | +547.35 Crore | Net Profit or Loss after all the expenses over the past twelve months. |
| Operating Margin | 11.33% | Income from operations as a percentage of revenue, before taxes and interest. |
| Profit Margin | 7.1% | Net income as a percentage of revenue, after all expenses. |
| Revenue Growth (Quarterly) | +34.2% | Change in revenue compared to the previous quarter. |
| Earnings Growth (YOY Quarterly) | -22.1% | Change in earnings compared to the same quarter last year. |
| Debt-to-Equity (D/E) Ratio | 18.61 | Company’s total debt divided by total shareholder equity. |
| Total Debt | 1,438.35 Crore | Sum of Ipca Labs’s current & long-term financial obligations. |
| Total Cash | 854.26 Crore | Total amount of liquid funds available to Ipca Labs. |
| Beta | 0.23 | Beta is less than 1 indicating that the Ipca Labs’s price is less volatile than the market. |
➲ Bata India (Bearish Pattern)
- Performance Overview: Over the past 26 trading days, Bata India has closed lower 15 times and higher 11 times.
- Recent Trend: Bata India has been on a bit of a slide, closing lower for the past 8 trading days. The last time the stock closed higher was Thursday, August 1st, 2024.
- Returns: In the last 26 trading days, Bata India’s share price has dipped by 6.77%. This means that an investment of ₹10,000 would have become ₹9,323 during this period.
- Financial Insight: Looking at the past 12 months, Bata India generated a revenue of ₹3,465.09 Crore and made a profit of ₹329.68 Crore.
- As of Tuesday, August 13th, 2024, Bata India has a Market Capital of ₹18,692.33 Crore.
- Summary: Bata India is currently in a bearish trend. It’s a good idea to keep a close eye on the stock’s direction, especially considering its recent performance. To help you navigate this, we encourage you to check out our projections for Bata India’s target for tomorrow and Bata India’s targets for 2024 and 2025.
Bata India Financial Performance
| Metric | Value | Description |
|---|---|---|
| Market Capital | 18,692.33 Crore | Market valuation of Bata India’s shares. |
| Revenue (TTM) | 3,465.09 Crore | Total revenue generated by Bata India over the past twelve months. |
| Net Income (TTM) | +329.68 Crore | Net Profit or Loss after all the expenses over the past twelve months. |
| Operating Margin | 10.34% | Income from operations as a percentage of revenue, before taxes and interest. |
| Profit Margin | 9.51% | Net income as a percentage of revenue, after all expenses. |
| Revenue Growth (Quarterly) | -1.4% | Change in revenue compared to the previous quarter. |
| Earnings Growth (YOY Quarterly) | +62.8% | Change in earnings compared to the same quarter last year. |
| Debt-to-Equity (D/E) Ratio | 88.89 | Company’s total debt divided by total shareholder equity. |
| Total Debt | 1,357.29 Crore | Sum of Bata India’s current & long-term financial obligations. |
| Total Cash | 404.1 Crore | Total amount of liquid funds available to Bata India. |
| Beta | 0.54 | Beta is less than 1 indicating that the Bata India’s price is less volatile than the market. |
Top Stocks That Created a New All Time High Today
Top Large Cap Stocks That Created a New All Time High Today
Companies with Market Capital more than 20,000 Crores| Stock | Close | New All-Time High (ATH) | Previous ATH | Previous ATH Date |
|---|---|---|---|---|
| Aurobindo Pharma | 1505.90 (+3.01%) | 1533.19 (+%) | Thu 01 Jan 1970 | |
| Cipla | 1583.44 (-0.18%) | 1606.69 (+%) | Thu 01 Jan 1970 | |
| Federal Bank | 202.30 (+0.52%) | 206.59 (+%) | Thu 01 Jan 1970 | |
| Glenmark Pharma | 1478.05 (-2.06%) | 1520.00 (+%) | Thu 01 Jan 1970 | |
| Ipca Labs | 1396.84 (+1.23%) | 1413.69 (+%) | Thu 01 Jan 1970 |
Top Mid Cap Stocks That Created a New All Time High Today
Companies with Market Capital between 5,000 Crores to 20,000 Crores| Stock | Close | New All-Time High (ATH) | Previous ATH | Previous ATH Date |
|---|---|---|---|---|
| DOMS Industries | 2388.05 (-2.76%) | 2545.00 (+37.86%) | 1846.00 | Mon 01 Apr 2024 |
| Eris Lifesciences | 1200.00 (-0.51%) | 1217.25 (+%) | Thu 01 Jan 1970 | |
| Glenmark Life Sciences | 979.95 (-1.87%) | 1037.05 (+%) | Thu 01 Jan 1970 | |
| GMR Power And Urban Infra | 103.44 (-1.79%) | 109.44 (+%) | Thu 01 Jan 1970 | |
| Gulf Oil Lubricants | 1342.00 (+3.38%) | 1375.00 (+23.06%) | 1117.30 | Thu 04 Apr 2024 |
Top Small Cap Stocks That Created a New All Time High Today
Companies with Market Capital less than 5,000 Crores| Stock | Close | New All-Time High (ATH) | Previous ATH | Previous ATH Date |
|---|---|---|---|---|
| Anna Infrastructures | 54.51 (+4.98%) | 54.51 (+%) | Thu 01 Jan 1970 | |
| B & A Packaging India | 348.60 (-4.71%) | 397.70 (+%) | Thu 01 Jan 1970 | |
| Bits | 7.61 (+1.87%) | 7.61 (+%) | Thu 01 Jan 1970 | |
| Bright Brothers | 227.00 (+4%) | 237.00 (+%) | Thu 01 Jan 1970 | |
| Ceenik Exports | 1167.69 (+1.99%) | 1167.69 (+128.42%) | 511.20 | Wed 24 Apr 2024 |