Home / Thu 29 Aug 2024 Market Recap
29 Aug 2024: Nifty 50 Closes at ₹25,156.75 (+0.41%), Bajaj Auto & Gujarat State Petronet Shine, Adani Enterprises & Adani Energy Struggle
Show Table of Contents
Table of Contents
- 1: Top Indices Performance Overview
- 2: Nifty 50 Performance Overview
- 2.1: Nifty 50 Top Gainers
- 2.2: Nifty 50 Top Losers
- 2.3: Nifty 50 Stocks To Watch for Tomorrow
- 2.3.1: ➲ Bajaj Auto (Looking Strong!)
- 2.3.2: ➲ Adani Enterprises (Bearish Pattern)
- 3: Nifty 500 Performance Overview
- 3.1: Nifty 500 Top Gainers
- 3.2: Nifty 500 Top Losers
- 3.3: Nifty 51 to 500 Stocks To Watch for Tomorrow
- 3.3.1: ➲ Gujarat State Petronet (Looking Bullish)
- 3.3.2: ➲ Adani Energy (Bearish Pattern)
- 4: Top Stocks That Created a New All Time High Today
- 4.1: Top Large Cap Stocks That Created a New All Time High Today
- 4.2: Top Mid Cap Stocks That Created a New All Time High Today
- 4.3: Top Small Cap Stocks That Created a New All Time High Today
Top Indices Performance Overview
| Stock | Close | Range |
|---|---|---|
| NIFTY 50 | ₹25,156.75 (0.41%) | ₹24,998.5 – ₹25,192.9 |
| NIFTY BANK | ₹51,166.8 (0.04%) | ₹50,984.75 – ₹51,368.25 |
| NIFTY FIN SERVICE | ₹23,593.65 (0.3%) | ₹23,485.65 – ₹23,675.3 |
| NIFTY IT | ₹42,564.3 (0.4%) | ₹42,163.39 – ₹42,788.94 |
| NIFTY AUTO | ₹25,997.05 (0.45%) | ₹25,671.8 – ₹26,117.05 |
| NIFTY ENERGY | ₹43,742.39 (0.79%) | ₹43,170.05 – ₹43,742.39 |
Nifty 50 Performance Overview
The Nifty 50 kicked off the day at ₹25,032.44, showcasing a dynamic trading session. It dipped to a low of ₹24,998.5 before reaching a peak of ₹25,192.9. The index ultimately closed at ₹25,156.75, marking a +0.41% gain for the day.
The table below highlights the top gainers and losers that significantly impacted the Nifty 50’s movement today.
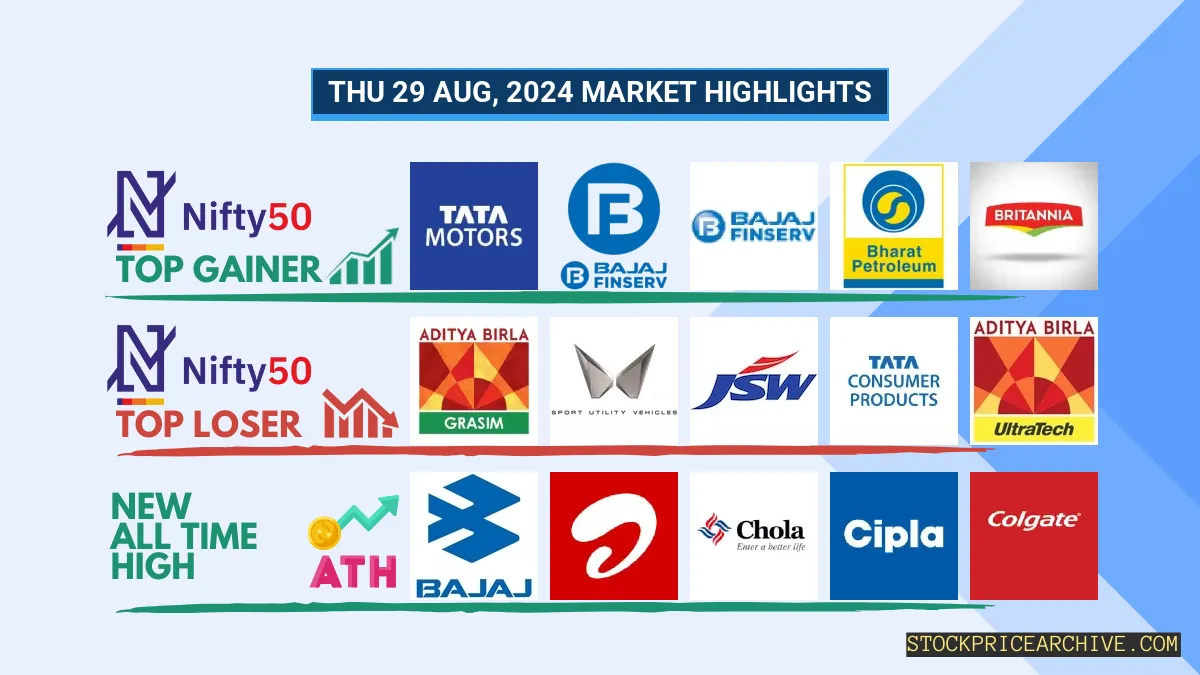
Nifty 50 Top Gainers
| Stock | Close | Range |
|---|---|---|
| Tata Motors | ₹1,112.15 (3.49%) | ₹1066 – ₹1,141.65 |
| Bajaj Finserv | ₹1,758.3 (2.61%) | ₹1,712.8 – ₹1772 |
| Bajaj Finance | ₹7079 (2.58%) | ₹6886 – ₹7,157.1 |
| Bharat Petroleum | ₹356.45 (2.57%) | ₹347.14 – ₹357.54 |
| Britannia | ₹5,831.39 (2.24%) | ₹5,696.14 – ₹5,843.45 |
Nifty 50 Top Losers
| Stock | Close | Range |
|---|---|---|
| GRASIM | ₹2,674.94 (-1.5%) | ₹2,640.25 – ₹2,713.19 |
| Mahindra & Mahindra | ₹2765 (-1.18%) | ₹2,741.64 – ₹2800 |
| JSW Steel | ₹939.7 (-1.01%) | ₹930.79 – ₹950.29 |
| Tata Consumer Products | ₹1,198.44 (-0.93%) | ₹1,185.3 – ₹1,208.75 |
| UltraTech Cement | ₹11210 (-0.8%) | ₹11,115.4 – ₹11,254.95 |
Nifty 50 Stocks To Watch for Tomorrow
➲ Bajaj Auto (Looking Strong!)
- Performance Snapshot: Over the past 26 trading sessions, Bajaj Auto has closed higher 18 times and lower 8 times. That’s a pretty good run!
- Recent Trend: Bajaj Auto has been on an impressive 8-day winning streak, since Monday, August 19th, 2024. It hasn’t closed in the red for a while!
- Returns: Bajaj Auto delivered a healthy 15.48% return during these 26 trading sessions. So, if you had invested ₹10,000, it would now be worth ₹11,548.
- Financial Snapshot: Over the past year, Bajaj Auto generated ₹47,766.08 Crore in revenue and earned a profit of ₹8,005.89 Crore. That’s strong performance.
- As of Thursday, August 29th, 2024, Bajaj Auto has a Market Capital of ₹2,91,193.27 Crore.
- Summary: Bajaj Auto is showing a strong bullish pattern. Investors are watching its price closely for both short-term and long-term growth possibilities. Want to see what experts are predicting? Check out Bajaj Auto Target for Tomorrow and Bajaj Auto Targets for 2024 & 2025.
Bajaj Auto Financial Performance
| Metric | Value | Description |
|---|---|---|
| Market Capital | 2,91,193.27 Crore | Market valuation of Bajaj Auto’s shares. |
| Revenue (TTM) | 47,766.08 Crore | Total revenue generated by Bajaj Auto over the past twelve months. |
| Net Income (TTM) | +8,005.89 Crore | Net Profit or Loss after all the expenses over the past twelve months. |
| Operating Margin | 21.28% | Income from operations as a percentage of revenue, before taxes and interest. |
| Profit Margin | 16.76% | Net income as a percentage of revenue, after all expenses. |
| Revenue Growth (Quarterly) | +15% | Change in revenue compared to the previous quarter. |
| Earnings Growth (YOY Quarterly) | +18.09% | Change in earnings compared to the same quarter last year. |
| Debt-to-Equity (D/E) Ratio | 6.16 | Company’s total debt divided by total shareholder equity. |
| Total Debt | 1,785.9 Crore | Sum of Bajaj Auto’s current & long-term financial obligations. |
| Total Cash | 6,298.9 Crore | Total amount of liquid funds available to Bajaj Auto. |
| Beta | 0.94 | Beta is less than 1 indicating that the Bajaj Auto’s price is less volatile than the market. |
➲ Adani Enterprises (Bearish Pattern)
- Performance Overview: In the last 25 trading sessions, Adani Enterprises has closed lower 15 times and higher 10 times.
- Recent Trend: Adani Enterprises has been on a 6-day downward streak, without a single day closing higher since Wednesday, August 21, 2024.
- Returns: Adani Enterprises generated a 0.82% return over the last 25 trading sessions, meaning an investment of ₹10,000 would have grown to ₹10,082.
- Financial Insight: Over the past 12 months, Bajaj Auto has generated a revenue of ₹99,248.91 Crore and earned a profit of ₹3,887.4 Crore.
- As of Thursday, August 29, 2024, Bajaj Auto has a Market Capital of ₹3,50,765.42 Crore.
- Summary: Adani Enterprises is currently facing some headwinds. It’s important to keep a close eye on its performance, especially Adani Enterprises’ Target for Tomorrow and Adani Enterprises’ Targets for 2024 & 2025.
Adani Enterprises Financial Performance
| Metric | Value | Description |
|---|---|---|
| Market Capital | 3,50,765.42 Crore | Market valuation of Adani Enterprises’s shares. |
| Revenue (TTM) | 99,248.91 Crore | Total revenue generated by Adani Enterprises over the past twelve months. |
| Net Income (TTM) | +3,887.4 Crore | Net Profit or Loss after all the expenses over the past twelve months. |
| Operating Margin | 11.12% | Income from operations as a percentage of revenue, before taxes and interest. |
| Profit Margin | 4.05% | Net income as a percentage of revenue, after all expenses. |
| Revenue Growth (Quarterly) | +0.1% | Change in revenue compared to the previous quarter. |
| Earnings Growth (YOY Quarterly) | +115.8% | Change in earnings compared to the same quarter last year. |
| Debt-to-Equity (D/E) Ratio | 147.8 | Company’s total debt divided by total shareholder equity. |
| Total Debt | 65,310.14 Crore | Sum of Adani Enterprises’s current & long-term financial obligations. |
| Total Cash | 4,380.95 Crore | Total amount of liquid funds available to Adani Enterprises. |
| Beta | 0.93 | Beta is less than 1 indicating that the Adani Enterprises’s price is less volatile than the market. |
Nifty 500 Performance Overview
The Nifty 500 kicked off the day at ₹23,619.55, showing some lively movement throughout the session. It dipped to a low of ₹23,495.15 before rallying to a high of ₹23,663.84. The index eventually closed at ₹23,643.9, a +0.11% gain for the day.
The day’s performance was influenced by several stocks, with some strong gainers and others facing some headwinds.
Nifty 500 Top Gainers
| Stock | Close | Range |
|---|---|---|
| Gujarat State Petronet | ₹420.79 (6.16%) | ₹394.39 – ₹422.64 |
| TV18 Broadcast | ₹51.64 (5.77%) | ₹49.7 – ₹54.25 |
| Concord Biotech | ₹1,705.59 (5.76%) | ₹1582 – ₹1815 |
| L&T Technology | ₹5996 (5.58%) | ₹5,628.45 – ₹5996 |
| Whirlpool | ₹2,189.8 (5.58%) | ₹2084 – ₹2,247.85 |
Nifty 500 Top Losers
| Stock | Close | Range |
|---|---|---|
| TATA ELXSI | ₹7,922.45 (-11.7%) | ₹7,864.54 – ₹8,212.04 |
| Symphony | ₹1500 (-7.01%) | ₹1495 – ₹1,590.94 |
| Varroc Engineering | ₹548.04 (-5.96%) | ₹546 – ₹567.15 |
| Sunteck Realty | ₹570.45 (-5.65%) | ₹565 – ₹586.15 |
| Vaibhav Global | ₹315 (-5.41%) | ₹311.14 – ₹320.95 |
Nifty 51 to 500 Stocks To Watch for Tomorrow
➲ Gujarat State Petronet (Looking Bullish)
- Recent Performance: In the last 26 trading days, Gujarat State Petronet has had a positive close 18 times and a negative close 8 times. That’s a pretty good track record!
- Hot Streak: Gujarat State Petronet has been on a 9-day winning streak, with no losses since Friday, August 16th, 2024. That’s impressive!
- Returns: Gujarat State Petronet has provided a 31.62% return over the past 26 trading sessions. This means that if you had invested ₹10,000, it would now be worth ₹13,162. Not bad, right?
- Financial Highlights: Over the past year, Gujarat State Petronet has generated revenue of ₹17,913.51 Crore and a profit of ₹1,699.45 Crore. These are solid numbers!
- As of Thursday, August 29th, 2024, Gujarat State Petronet has a Market Capital of ₹19,104.18 Crore.
- Summary: Gujarat State Petronet is showing strong signs of bullish momentum. Keep an eye on its price movements as it looks to potentially continue its upward trajectory. Checkout Gujarat State Petronet Target for Tomorrow and Gujarat State Petronet Targets for 2024 & 2025 for potential insights.
Gujarat State Petronet Financial Performance
| Metric | Value | Description |
|---|---|---|
| Market Capital | 19,104.18 Crore | Market valuation of Gujarat State Petronet’s shares. |
| Revenue (TTM) | 17,913.51 Crore | Total revenue generated by Gujarat State Petronet over the past twelve months. |
| Net Income (TTM) | +1,699.45 Crore | Net Profit or Loss after all the expenses over the past twelve months. |
| Operating Margin | 14.07% | Income from operations as a percentage of revenue, before taxes and interest. |
| Profit Margin | 9.48% | Net income as a percentage of revenue, after all expenses. |
| Revenue Growth (Quarterly) | +15.1% | Change in revenue compared to the previous quarter. |
| Earnings Growth (YOY Quarterly) | +11.89% | Change in earnings compared to the same quarter last year. |
| Debt-to-Equity (D/E) Ratio | 0.97 | Company’s total debt divided by total shareholder equity. |
| Total Debt | 139.61 Crore | Sum of Gujarat State Petronet’s current & long-term financial obligations. |
| Total Cash | 2,385.98 Crore | Total amount of liquid funds available to Gujarat State Petronet. |
| Beta | 0.6 | Beta is less than 1 indicating that the Gujarat State Petronet’s price is less volatile than the market. |
➲ Adani Energy (Bearish Pattern)
- Performance Overview: Over the past 25 trading days, Adani Energy has closed lower than the previous day’s close 13 times, while closing higher 11 times.
- Recent Trend: Adani Energy has been on a downward trend for the last 7 trading days, with no gains since Tuesday, August 20, 2024.
- Returns: Adani Energy has experienced a -2.13% return over the last 25 trading days. This means if you had invested ₹10,000 on August 4th, 2024, your investment would be worth ₹9,787 today.
- Financial Insight: Over the last 12 months, Adani Energy has generated revenue of ₹17,181.76 Crore and earned a profit of ₹351.85 Crore.
- As of Thursday, August 29th, 2024, Adani Energy has a Market Capitalization of ₹1,30,001.53 Crore.
- Summary: Adani Energy is currently in a bearish phase. It’s wise for investors to keep a close eye on the market, especially considering the recent downward trend. You might want to check out Adani Energy’s Target for Tomorrow and Adani Energy’s Target for 2024 & 2025 for further insights.
Adani Energy Financial Performance
| Metric | Value | Description |
|---|---|---|
| Market Capital | 1,30,001.53 Crore | Market valuation of Adani Energy’s shares. |
| Revenue (TTM) | 17,181.76 Crore | Total revenue generated by Adani Energy over the past twelve months. |
| Net Income (TTM) | -351.85 Crore | Net Profit or Loss after all the expenses over the past twelve months. |
| Operating Margin | 27.74% | Income from operations as a percentage of revenue, before taxes and interest. |
| Profit Margin | -2.05% | Net income as a percentage of revenue, after all expenses. |
| Revenue Growth (Quarterly) | +21.7% | Change in revenue compared to the previous quarter. |
| Earnings Growth (YOY Quarterly) | +46.79% | Change in earnings compared to the same quarter last year. |
| Debt-to-Equity (D/E) Ratio | 270.52 | Company’s total debt divided by total shareholder equity. |
| Total Debt | 37,069.64 Crore | Sum of Adani Energy’s current & long-term financial obligations. |
| Total Cash | 1,920.37 Crore | Total amount of liquid funds available to Adani Energy. |
| Beta | 1.16 | Beta is greater than 1 indicating that the Adani Energy’s price is more volatile than the market. |
Top Stocks That Created a New All Time High Today
Top Large Cap Stocks That Created a New All Time High Today
Companies with Market Capital more than 20,000 Crores| Stock | Close | New All-Time High (ATH) | Previous ATH | Previous ATH Date |
|---|---|---|---|---|
| Abbott | 29983.69 (-0.39%) | 30149.94 (+%) | Thu 01 Jan 1970 | |
| Alkem Labs | 5999.29 (+0.03%) | 6064.79 (+%) | Thu 01 Jan 1970 | |
| Bajaj Auto | 10809.00 (+1.42%) | 10850.00 (+%) | Thu 01 Jan 1970 | |
| Bharti Airtel | 1567.00 (+0.68%) | 1571.55 (+16.32%) | 1351.00 | Tue 23 Apr 2024 |
| Cholamandalam | 1455.59 (+0.33%) | 1478.90 (+%) | Thu 01 Jan 1970 |
Top Mid Cap Stocks That Created a New All Time High Today
Companies with Market Capital between 5,000 Crores to 20,000 Crores| Stock | Close | New All-Time High (ATH) | Previous ATH | Previous ATH Date |
|---|---|---|---|---|
| Aarti Pharmalabs | 704.00 (+7.18%) | 721.65 (+%) | Thu 01 Jan 1970 | |
| Concord Biotech | 1705.59 (+5.76%) | 1815.00 (+12.94%) | 1607.00 | Wed 10 Jan 2024 |
| ENTERO | 1350.90 (+2.91%) | 1355.00 (+%) | Thu 01 Jan 1970 | |
| Eris Lifesciences | 1337.00 (+0.4%) | 1399.00 (+%) | Thu 01 Jan 1970 | |
| GMR Power And Urban Infra | 138.39 (+4.83%) | 138.89 (+%) | Thu 01 Jan 1970 |
Top Small Cap Stocks That Created a New All Time High Today
Companies with Market Capital less than 5,000 Crores| Stock | Close | New All-Time High (ATH) | Previous ATH | Previous ATH Date |
|---|---|---|---|---|
| 21ST CENTURY MANAG | 118.35 (+1.99%) | 118.35 (+%) | Thu 01 Jan 1970 | |
| AAREYDRUGS | 72.84 (+9.99%) | 72.84 (+%) | Thu 01 Jan 1970 | |
| Albert David | 1629.40 (+4.8%) | 1719.94 (+%) | Thu 01 Jan 1970 | |
| AMBO AGRITEC LIMITED | 109.20 (+5%) | 109.20 (+%) | Thu 01 Jan 1970 | |
| Asia Pack | 68.59 (+3.73%) | 69.00 (+%) | Thu 01 Jan 1970 |