Home / Thu 06 Jun 2024 Market Recap
06 Jun 2024: Nifty 50 closed at ₹22,620.34 (+3.36%), with Tech Mahindra and HCL leading the gains. GMM Pfaudler show bearish patterns.
Show Table of Contents
Table of Contents
- 1: Top Indices Performance Overview
- 2: Nifty 50 Performance Overview
- 2.1: Nifty 50 Top Gainers
- 2.2: Nifty 50 Top Losers
- 2.3: Nifty 50 Stocks To Watch for Tomorrow
- 2.3.1: ➲ Cipla (Bullish Pattern)
- 3: Nifty 500 Performance Overview
- 3.1: Nifty 500 Top Gainers
- 3.2: Nifty 500 Top Losers
- 3.3: Nifty 51 to 500 Stocks To Watch for Tomorrow
- 3.3.1: ➲ Krishna Institute of Medical Sciences (Bullish Pattern)
- 3.3.2: ➲ GMM Pfaudler (Bearish Pattern)
- 4: Top Stocks That Created a New All Time High Today
- 4.1: Top Large Cap Stocks That Created a New All Time High Today
- 4.2: Top Mid Cap Stocks That Created a New All Time High Today
- 4.3: Top Small Cap Stocks That Created a New All Time High Today
Top Indices Performance Overview
| Stock | Close | Range |
|---|---|---|
| NIFTY 50 | ₹22,854.34 (1.03%) | ₹22,653.75 – ₹22,908.75 |
| NIFTY BANK | ₹49,330.89 (0.56%) | ₹48,911.3 – ₹49,672.05 |
| NIFTY FIN SERVICE | ₹21,910.34 (1.05%) | ₹21,712.44 – ₹22,034.65 |
| NIFTY IT | ₹34,074.1 (2.98%) | ₹33348 – ₹34,092.05 |
| NIFTY AUTO | ₹24400 (0.47%) | ₹24,201.44 – ₹24,463.3 |
| NIFTY ENERGY | ₹39,399.6 (1.77%) | ₹39,049.39 – ₹40,059.1 |
Nifty 50 Performance Overview
The Nifty 50 opened the trading day at ₹22,128.34. Throughout the session, it saw fluctuations, hitting a low of ₹21,791.94 and reaching a high of ₹22,670.4, before settling at a close of ₹22,620.34 (+3.36%).
Refer to the table below for the top gainers and losers stocks that influenced today’s Nifty 50 movement.
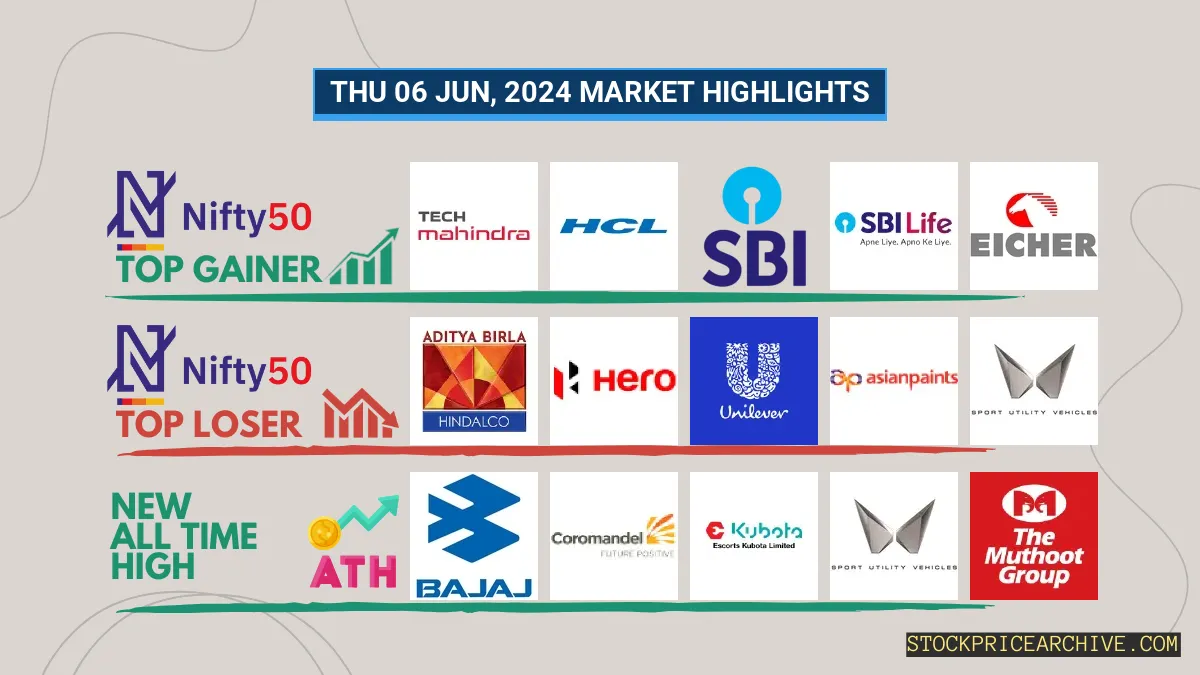
Nifty 50 Top Gainers
| Stock | Close | Range |
|---|---|---|
| Tech Mahindra | ₹1,317.44 (3.98%) | ₹1,276.15 – ₹1,323.55 |
| HCL | ₹1397 (3.96%) | ₹1,353.25 – ₹1,399.75 |
| SBI | ₹817.5 (3.51%) | ₹796.79 – ₹833.15 |
| SBI Life Insurance | ₹1,437.05 (3.37%) | ₹1,380.44 – ₹1,445.75 |
| Eicher Motors | ₹4,721.85 (3.11%) | ₹4539 – ₹4,726.89 |
Nifty 50 Top Losers
| Stock | Close | Range |
|---|---|---|
| Hindalco | ₹678.54 (-2.41%) | ₹673.04 – ₹691.9 |
| Hero MotoCorp | ₹5535 (-2.19%) | ₹5,475.79 – ₹5,735.14 |
| Hindustan Unilever | ₹2556 (-1.8%) | ₹2518 – ₹2,579.25 |
| Asian Paints | ₹2,909.05 (-1.78%) | ₹2,882.25 – ₹2,961.1 |
| Mahindra & Mahindra | ₹2,701.75 (-1.43%) | ₹2,670.89 – ₹2,756.55 |
Nifty 50 Stocks To Watch for Tomorrow
➲ Cipla (Bullish Pattern)
- Performance Overview: In the last 26 trading sessions, Cipla has closed on a positive note 14 times, while closing in the red 12 times, indicating a fairly balanced performance.
- Recent Trend: Cipla has been on a 3-day green streak, consistently closing in the green since Friday, May 31, 2024.
- Returns: Over the past 26 trading sessions, Cipla has generated a respectable 5.78% return. If you had invested ₹10,000, your investment would have grown to approximately ₹10,578.
- Financial Insight: Cipla’s financial performance over the past 12 months reflects a strong revenue of ₹25,446.62 Crore and a healthy profit of ₹4,121.55 Crore.
- As of Wednesday, June 5, 2024, Cipla has an impressive Market Capital of ₹1,17,346.38 Crore, demonstrating its substantial market presence.
- Summary: Cipla’s market performance exhibits a bullish pattern, attracting the attention of investors seeking growth potential. Investors may find it beneficial to track the stock’s price movements to identify potential opportunities. For more in-depth analysis, explore Cipla Target for Tomorrow and Cipla Targets for 2024 & 2025.
Cipla Financial Performance
| Metric | Value | Description |
|---|---|---|
| Market Capital | 1,17,346.38 Crore | Market valuation of Cipla’s shares. |
| Revenue (TTM) | 25,446.62 Crore | Total revenue generated by Cipla over the past twelve months. |
| Net Income (TTM) | +4,121.55 Crore | Net Profit or Loss after all the expenses over the past twelve months. |
| Operating Margin | 16.89% | Income from operations as a percentage of revenue, before taxes and interest. |
| Profit Margin | 16.19% | Net income as a percentage of revenue, after all expenses. |
| Revenue Growth (Quarterly) | +9.7% | Change in revenue compared to the previous quarter. |
| Earnings Growth (YOY Quarterly) | +78.6% | Change in earnings compared to the same quarter last year. |
| Debt-to-Equity (D/E) Ratio | 2.08 | Company’s total debt divided by total shareholder equity. |
| Total Debt | 559.41 Crore | Sum of Cipla’s current & long-term financial obligations. |
| Total Cash | 5,681.97 Crore | Total amount of liquid funds available to Cipla. |
| Beta | 0.36 | Beta is less than 1 indicating that the Cipla’s price is less volatile than the market. |
Nifty 500 Performance Overview
Today, the Nifty 500 started its trading session at ₹20,570.75. It fluctuated throughout the day, hitting a low of ₹20,116.59 and reaching a high of ₹21,092.15, before finally closing with a gain of ₹21,054.40 (+3.59%).
Nifty 500 Top Gainers
| Stock | Close | Range |
|---|---|---|
| Nazara Technologies | ₹802.29 (15.06%) | ₹717 – ₹817.95 |
| Nippon Life India Asset Management | ₹619.79 (13.52%) | ₹554.45 – ₹621.9 |
| UNO Minda | ₹977.2 (13.49%) | ₹907.65 – ₹1025 |
| Mazagoan Dock Shipbuilders | ₹3175 (13.46%) | ₹2,838.1 – ₹3214 |
| RattanIndia Enterprises | ₹78.2 (13.25%) | ₹71.75 – ₹78.59 |
Nifty 500 Top Losers
| Stock | Close | Range |
|---|---|---|
| Sun TV Network | ₹718.95 (-3.92%) | ₹714.25 – ₹744.79 |
| Vijaya Diagnostic Centre | ₹819 (-3.72%) | ₹811 – ₹867.5 |
| Triveni Engineering & Industries | ₹316.29 (-3.46%) | ₹315.04 – ₹330.79 |
| Avenue Supermarts Dmart | ₹4699 (-3.36%) | ₹4,676.1 – ₹4,858.04 |
| CRISIL | ₹4050 (-3.28%) | ₹4,009.35 – ₹4,234.7 |
Nifty 51 to 500 Stocks To Watch for Tomorrow
➲ Krishna Institute of Medical Sciences (Bullish Pattern)
- Performance Overview: In the last 26 trading sessions, Krishna Institute of Medical Sciences has closed in green 13 times and in red 13 times.
- Recent Trend: Krishna Institute of Medical Sciences has been on a 5-day green streak, without a single day closing in red since Wednesday, May 29, 2024.
- Returns: Krishna Institute of Medical Sciences gave a -6.36% return in the last 26 trading sessions, which means that your investment of ₹10,000 would have become ₹9,364
- Financial Insight: Over the past 12 months, Krishna Institute of Medical Sciences has generated a renvenue of ₹2,498.14 Crore and created a profit of ₹310.14 Crore.
- As of Wednesday, June 05, 2024, Krishna Institute of Medical Sciences has a Market Capital of ₹14,619.88 Crore.
- Summary: Krishna Institute of Medical Sciences exhibits a robust bullish pattern. Investors should monitor its price movements for both short-term and long-term growth prospects: Checkout Krishna Institute of Medical Sciences Target for Tomorrow and Krishna Institute of Medical Sciences Targets for 2024 & 2025.
Krishna Institute of Medical Sciences Financial Performance
| Metric | Value | Description |
|---|---|---|
| Market Capital | 14,619.88 Crore | Market valuation of Krishna Institute of Medical Sciences’s shares. |
| Revenue (TTM) | 2,498.14 Crore | Total revenue generated by Krishna Institute of Medical Sciences over the past twelve months. |
| Net Income (TTM) | +310.14 Crore | Net Profit or Loss after all the expenses over the past twelve months. |
| Operating Margin | 17.77% | Income from operations as a percentage of revenue, before taxes and interest. |
| Profit Margin | 12.41% | Net income as a percentage of revenue, after all expenses. |
| Revenue Growth (Quarterly) | +10% | Change in revenue compared to the previous quarter. |
| Earnings Growth (YOY Quarterly) | -29.8% | Change in earnings compared to the same quarter last year. |
| Debt-to-Equity (D/E) Ratio | 64.74 | Company’s total debt divided by total shareholder equity. |
| Total Debt | 1,355.32 Crore | Sum of Krishna Institute of Medical Sciences’s current & long-term financial obligations. |
| Total Cash | 131.98 Crore | Total amount of liquid funds available to Krishna Institute of Medical Sciences. |
| Beta | -0.25 | Beta is less than 1 indicating that the Krishna Institute of Medical Sciences’s price is less volatile than the market. |
➲ GMM Pfaudler (Bearish Pattern)
- Performance Overview: In the past 26 trading sessions, GMM Pfaudler has closed in red 18 times and in green 8 times.
- Recent Trend: GMM Pfaudler has been on a 7-day red streak, without a single day closing in green since Monday, May 27, 2024.
- Returns: GMM Pfaudler gave a -17.29% return in the last 26 trading sessions, meaning your investment of ₹10,000 would have become ₹8,271.
- Financial Insight: Over the past 12 months, GMM Pfaudler has generated a revenue of ₹3,571.7 Crore and created a profit of ₹196.25 Crore.
- As of Wednesday, June 5, 2024, GMM Pfaudler has a Market Capital of ₹5,549.3 Crore.
- Summary: GMM Pfaudler is currently experiencing a bearish phase. We advise investors to keep a close watch, especially on GMM Pfaudler Target for Tomorrow and GMM Pfaudler Targets for 2024 & 2025.
GMM Pfaudler Financial Performance
| Metric | Value | Description |
|---|---|---|
| Market Capital | 5,549.3 Crore | Market valuation of GMM Pfaudler’s shares. |
| Revenue (TTM) | 3,571.7 Crore | Total revenue generated by GMM Pfaudler over the past twelve months. |
| Net Income (TTM) | +196.25 Crore | Net Profit or Loss after all the expenses over the past twelve months. |
| Operating Margin | 9.48% | Income from operations as a percentage of revenue, before taxes and interest. |
| Profit Margin | 5.49% | Net income as a percentage of revenue, after all expenses. |
| Revenue Growth (Quarterly) | +8% | Change in revenue compared to the previous quarter. |
| Earnings Growth (YOY Quarterly) | +69.89% | Change in earnings compared to the same quarter last year. |
| Debt-to-Equity (D/E) Ratio | 104.6 | Company’s total debt divided by total shareholder equity. |
| Total Debt | 984.88 Crore | Sum of GMM Pfaudler’s current & long-term financial obligations. |
| Total Cash | 306.16 Crore | Total amount of liquid funds available to GMM Pfaudler. |
| Beta | 0.12 | Beta is less than 1 indicating that the GMM Pfaudler’s price is less volatile than the market. |
Top Stocks That Created a New All Time High Today
Top Large Cap Stocks That Created a New All Time High Today
Companies with Market Capital more than 20,000 Crores| Stock | Close | New All-Time High (ATH) | Previous ATH | Previous ATH Date |
|---|---|---|---|---|
| Aegis Logistics | 787.00 (+11.56%) | 832.90 (+50.35%) | 553.95 | Thu 18 Apr 2024 |
| Bajaj Auto | 9690.00 (+0.91%) | 9740.00 (+%) | Thu 01 Jan 1970 | |
| Coromandel International | 1382.50 (+0.92%) | 1395.00 (+%) | Thu 01 Jan 1970 | |
| Endurance Technologies | 2425.00 (+2.54%) | 2495.69 (+%) | Thu 01 Jan 1970 | |
| Escorts | 4014.10 (+2.68%) | 4038.69 (+%) | Thu 01 Jan 1970 |
Top Mid Cap Stocks That Created a New All Time High Today
Companies with Market Capital between 5,000 Crores to 20,000 Crores| Stock | Close | New All-Time High (ATH) | Previous ATH | Previous ATH Date |
|---|---|---|---|---|
| Amara Raja Batteries | 1283.15 (+5.26%) | 1331.90 (+18.07%) | 1128.00 | Tue 25 Aug 2015 |
| BECTORFOOD | 1498.00 (+5.43%) | 1545.19 (+%) | Thu 01 Jan 1970 | |
| Bikaji Foods | 643.00 (+1.03%) | 661.95 (+%) | Thu 01 Jan 1970 | |
| CMS Info Systems | 456.00 (+4.97%) | 461.35 (+%) | Thu 01 Jan 1970 | |
| Eris Lifesciences | 979.90 (+6.81%) | 992.00 (+%) | Thu 01 Jan 1970 |
Top Small Cap Stocks That Created a New All Time High Today
Companies with Market Capital less than 5,000 Crores| Stock | Close | New All-Time High (ATH) | Previous ATH | Previous ATH Date |
|---|---|---|---|---|
| Ace Software Exports | 226.25 (+1.98%) | 226.25 (+50.55%) | 150.28 | Mon 01 Apr 2024 |
| Ahmedabad Steelcraft | 76.78 (+1.99%) | 76.78 (+%) | Thu 01 Jan 1970 | |
| DCB Bank | 130.10 (+0.65%) | 1559.94 (+0.26%) | 1555.85 | Fri 01 Dec 2023 |
| E2E Networks | 1586.00 (+4.99%) | 1586.00 (+37.78%) | 1151.09 | Wed 24 Apr 2024 |
| GOLDENCREST | 80.42 (+0%) | 80.44 (+%) | Thu 01 Jan 1970 |