Home / Mon 12 Aug 2024 Market Recap
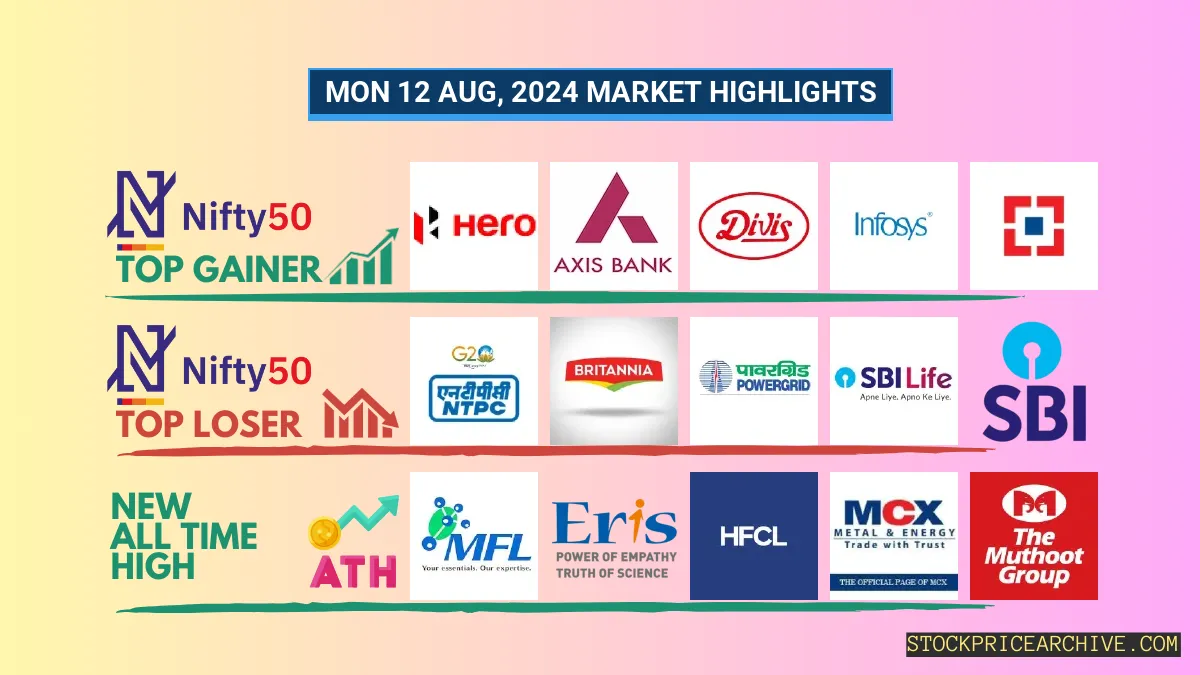
12 Aug 2024: Nifty Closes at ₹24,348.8 (-0.08%), Axis Bank Closing Higher for Last 4-days & Eris Lifesciences for 5-days
Show Table of Contents
Table of Contents
- 1: Top Indices Performance Overview
- 2: Nifty 50 Performance Overview
- 2.1: Nifty 50 Top Gainers
- 2.2: Nifty 50 Top Losers
- 2.3: Nifty 50 Stocks To Watch for Tomorrow
- 2.3.1: ➲ Axis Bank (Looking Bullish)
- 2.3.2: ➲ Britannia (Bearish Trend)
- 3: Nifty 500 Performance Overview
- 3.1: Nifty 500 Top Gainers
- 3.2: Nifty 500 Top Losers
- 3.3: Nifty 51 to 500 Stocks To Watch for Tomorrow
- 3.3.1: ➲ Eris Lifesciences (Looking Bullish)
- 3.3.2: ➲ Thermax (Bearish Trend)
- 4: Top Stocks That Created a New All Time High Today
- 4.1: Top Large Cap Stocks That Created a New All Time High Today
- 4.2: Top Mid Cap Stocks That Created a New All Time High Today
- 4.3: Top Small Cap Stocks That Created a New All Time High Today
Top Indices Performance Overview
| Stock | Close | Range |
|---|---|---|
| NIFTY 50 | ₹24,348.8 (-0.08%) | ₹24,212.3 – ₹24,472.69 |
| NIFTY BANK | ₹50,578.55 (0.18%) | ₹50151 – ₹50830 |
| NIFTY FIN SERVICE | ₹23,022.4 (0.17%) | ₹22,831.8 – ₹23,158.4 |
Nifty 50 Performance Overview
The Nifty 50 kicked off the day at ₹24,317.9, showcasing a bit of a roller coaster ride. It dipped to a low of ₹24,212.3, but rallied to a high of ₹24,472.69 before closing at ₹24,348.8, a slight -0.08% decrease for the session.
Let’s peek at the top gainers and losers that influenced today’s Nifty 50 movement.
Nifty 50 Top Gainers
| Stock | Close | Range |
|---|---|---|
| Hero MotoCorp | ₹5318 (2.12%) | ₹5185 – ₹5325 |
| Axis Bank | ₹1,163.44 (1.83%) | ₹1,136.4 – ₹1,168.94 |
| Divis Lab | ₹4,900.39 (1.45%) | ₹4783 – ₹4,903.5 |
| Infosys | ₹1795 (1.36%) | ₹1,768.19 – ₹1,803.44 |
| HDFC BANK | ₹1660 (0.59%) | ₹1,647.5 – ₹1,675.8 |
Nifty 50 Top Losers
| Stock | Close | Range |
|---|---|---|
| NTPC | ₹401.79 (-2.16%) | ₹400.1 – ₹409.7 |
| Britannia | ₹5,648.75 (-1.6%) | ₹5625 – ₹5,774.04 |
| Power Grid | ₹340.7 (-1.54%) | ₹339.6 – ₹343.64 |
| SBI Life Insurance | ₹1,700.09 (-1.45%) | ₹1,692.5 – ₹1730 |
| SBI | ₹813 (-1.37%) | ₹811.29 – ₹822.04 |
Nifty 50 Stocks To Watch for Tomorrow
➲ Axis Bank (Looking Bullish)
- Performance Snapshot: Over the past 25 trading days, Axis Bank has closed higher 12 times and lower 13 times.
- Recent Trend: Axis Bank has been on a 4-day winning streak, with no losses since Tuesday, August 6th, 2024.
- Returns: While Axis Bank experienced a -9.46% return over the past 25 trading sessions, it’s important to remember that short-term fluctuations are common in the stock market. This means that an investment of ₹10,000 would have become ₹9,054 during this period.
- Financial Highlights: In the last 12 months, Axis Bank generated a remarkable revenue of ₹64,970.45 Crore and achieved a strong profit of ₹26,731.28 Crore.
- As of Monday, August 12th, 2024, Axis Bank has a Market Capital of ₹3,53,292.56 Crore.
- Key Takeaway: The recent trend for Axis Bank suggests a potential bullish outlook. Keep an eye on its price movements to gauge short-term and long-term growth potential. To explore potential targets for Axis Bank, check out Axis Bank Target for Tomorrow and Axis Bank Targets for 2024 & 2025.
Axis Bank Financial Performance
| Metric | Value | Description |
|---|---|---|
| Market Capital | 3,53,292.56 Crore | Market valuation of Axis Bank’s shares. |
| Revenue (TTM) | 64,970.45 Crore | Total revenue generated by Axis Bank over the past twelve months. |
| Net Income (TTM) | +26,731.28 Crore | Net Profit or Loss after all the expenses over the past twelve months. |
| Operating Margin | 46.89% | Income from operations as a percentage of revenue, before taxes and interest. |
| Profit Margin | 41.14% | Net income as a percentage of revenue, after all expenses. |
| Revenue Growth (Quarterly) | +9.3% | Change in revenue compared to the previous quarter. |
| Earnings Growth (YOY Quarterly) | +5.7% | Change in earnings compared to the same quarter last year. |
| Debt-to-Equity (D/E) Ratio | 1.35 | Company’s total debt divided by total shareholder equity. |
| Total Debt | 2,24,036.7 Crore | Sum of Axis Bank’s current & long-term financial obligations. |
| Total Cash | 63,290.44 Crore | Total amount of liquid funds available to Axis Bank. |
| Beta | 0.94 | Beta is less than 1 indicating that the Axis Bank’s price is less volatile than the market. |
➲ Britannia (Bearish Trend)
- Performance Snapshot: In the last 25 trading days, Britannia’s share price has closed higher 14 times and lower 10 times.
- Recent Activity: Britannia has been on a four-day downward streak, closing lower every day since Tuesday, August 6th, 2024.
- Returns: Over the last 25 trading sessions, Britannia has generated a 1.68% return. This means an investment of ₹10,000 would have grown to ₹10,168.
- Financial Highlights: In the past 12 months, Britannia generated revenue of ₹16,957.76 Crore and recorded a profit of ₹2,187.89 Crore.
- As of Monday, August 12th, 2024, Britannia has a Market Capitalization of ₹1,38,334.33 Crore.
- In Summary: Britannia’s recent performance has shown a bearish trend. We suggest keeping a close eye on Britannia’s share price movement, especially considering its projected target for tomorrow and its projected targets for 2024 and 2025.
Britannia Financial Performance
| Metric | Value | Description |
|---|---|---|
| Market Capital | 1,38,334.33 Crore | Market valuation of Britannia’s shares. |
| Revenue (TTM) | 16,957.76 Crore | Total revenue generated by Britannia over the past twelve months. |
| Net Income (TTM) | +2,187.89 Crore | Net Profit or Loss after all the expenses over the past twelve months. |
| Operating Margin | 15.99% | Income from operations as a percentage of revenue, before taxes and interest. |
| Profit Margin | 12.9% | Net income as a percentage of revenue, after all expenses. |
| Revenue Growth (Quarterly) | +6% | Change in revenue compared to the previous quarter. |
| Earnings Growth (YOY Quarterly) | +10.5% | Change in earnings compared to the same quarter last year. |
| Debt-to-Equity (D/E) Ratio | 52.06 | Company’s total debt divided by total shareholder equity. |
| Total Debt | 2,064.95 Crore | Sum of Britannia’s current & long-term financial obligations. |
| Total Cash | 2,019.3 Crore | Total amount of liquid funds available to Britannia. |
| Beta | 0.52 | Beta is less than 1 indicating that the Britannia’s price is less volatile than the market. |
Nifty 500 Performance Overview
The Nifty 500 started the day at ₹22,940.3, showing some volatility throughout the session. It dipped to a low of ₹22,869.5 but climbed to a high of ₹22,982.34 before ultimately closing at ₹22,921.94, a positive gain of 0.95%.
This movement was influenced by a mix of top gainers and losers, which you can see in the table below.
Nifty 500 Top Gainers
| Stock | Close | Range |
|---|---|---|
| Rail Vikas Nigam | ₹575.9 (11.14%) | ₹524 – ₹582.9 |
| V-Guard Industries | ₹509 (7.29%) | ₹466.04 – ₹509 |
| HFCL | ₹140.1 (5.73%) | ₹130.69 – ₹143.19 |
| Praj Industries | ₹704.84 (4.88%) | ₹662.59 – ₹710.9 |
| Laxmi Organic Industries | ₹279.25 (4.25%) | ₹262.29 – ₹287.89 |
Nifty 500 Top Losers
| Stock | Close | Range |
|---|---|---|
| Balkrishna Industries | ₹2850 (-6.84%) | ₹2,755.5 – ₹2,955.85 |
| Vinati Organics | ₹2,113.35 (-6.7%) | ₹2,098.25 – ₹2209 |
| Aster Healthcare | ₹385.2 (-5.48%) | ₹383.1 – ₹408 |
| Astral | ₹1942 (-4.72%) | ₹1,916.65 – ₹2026 |
| MEDANTA (Global Health) | ₹1081 (-4.64%) | ₹1,080.08 – ₹1,129.25 |
Nifty 51 to 500 Stocks To Watch for Tomorrow
➲ Eris Lifesciences (Looking Bullish)
- Performance Snapshot: Over the past 25 trading days, Eris Lifesciences has closed higher 21 times and lower 4 times. That’s a pretty strong showing!
- Recent Momentum: Eris Lifesciences has been on a roll, closing higher for five consecutive days, with the most recent green close on Monday, August 5th, 2024.
- Returns: Eris Lifesciences delivered an impressive 18.88% return over the last 25 trading sessions. This means if you had invested ₹10,000, your investment would have grown to ₹11,888.
- Financial Highlights: Over the past year, Eris Lifesciences generated total revenue of ₹2,246.85 Crore and earned a profit of ₹380.3 Crore.
- As of Monday, August 12th, 2024, Eris Lifesciences has a Market Capitalization of ₹16,302.46 Crore.
- In a Nutshell: Eris Lifesciences is showing a strong bullish pattern. Investors are keeping a close eye on its price movements to identify potential opportunities for both short-term and long-term growth. Checkout Eris Lifesciences Target for Tomorrow and Eris Lifesciences Targets for 2024 & 2025.
Eris Lifesciences Financial Performance
| Metric | Value | Description |
|---|---|---|
| Market Capital | 16,302.46 Crore | Market valuation of Eris Lifesciences’s shares. |
| Revenue (TTM) | 2,246.85 Crore | Total revenue generated by Eris Lifesciences over the past twelve months. |
| Net Income (TTM) | +380.3 Crore | Net Profit or Loss after all the expenses over the past twelve months. |
| Operating Margin | 24.32% | Income from operations as a percentage of revenue, before taxes and interest. |
| Profit Margin | 16.92% | Net income as a percentage of revenue, after all expenses. |
| Revenue Growth (Quarterly) | +55.6% | Change in revenue compared to the previous quarter. |
| Earnings Growth (YOY Quarterly) | -12.3% | Change in earnings compared to the same quarter last year. |
| Debt-to-Equity (D/E) Ratio | 86.32 | Company’s total debt divided by total shareholder equity. |
| Total Debt | 2,781.26 Crore | Sum of Eris Lifesciences’s current & long-term financial obligations. |
| Total Cash | 1,400.63 Crore | Total amount of liquid funds available to Eris Lifesciences. |
| Beta | 0.35 | Beta is less than 1 indicating that the Eris Lifesciences’s price is less volatile than the market. |
➲ Thermax (Bearish Trend)
- Performance Overview: Over the past 25 trading days, Thermax has closed lower 17 times and higher 8 times.
- Recent Trend: Thermax has been on a downward trend for the past 7 days, without a single day closing higher since Thursday, August 1, 2024.
- Returns: If you had invested ₹10,000 in Thermax over the last 25 trading days, your investment would have decreased to ₹7,510, representing a loss of -24.9%.
- Financial Insight: Over the past 12 months, Eris Lifesciences has generated revenue of ₹9,323.46 Crore and recorded a profit of ₹645.28 Crore.
- As of Monday, August 12, 2024, Eris Lifesciences has a Market Capital of ₹58,166.4 Crore.
- Summary: Thermax is currently in a bearish phase. We encourage investors to closely monitor the stock, particularly the Thermax Target for Tomorrow and Thermax Targets for 2024 & 2025.
Thermax Financial Performance
| Metric | Value | Description |
|---|---|---|
| Market Capital | 58,166.4 Crore | Market valuation of Thermax’s shares. |
| Revenue (TTM) | 9,323.46 Crore | Total revenue generated by Thermax over the past twelve months. |
| Net Income (TTM) | +645.28 Crore | Net Profit or Loss after all the expenses over the past twelve months. |
| Operating Margin | 8.07% | Income from operations as a percentage of revenue, before taxes and interest. |
| Profit Margin | 6.92% | Net income as a percentage of revenue, after all expenses. |
| Revenue Growth (Quarterly) | +19.6% | Change in revenue compared to the previous quarter. |
| Earnings Growth (YOY Quarterly) | +22% | Change in earnings compared to the same quarter last year. |
| Debt-to-Equity (D/E) Ratio | 28.77 | Company’s total debt divided by total shareholder equity. |
| Total Debt | 1,277.42 Crore | Sum of Thermax’s current & long-term financial obligations. |
| Total Cash | 2,338.77 Crore | Total amount of liquid funds available to Thermax. |
| Beta | 0.37 | Beta is less than 1 indicating that the Thermax’s price is less volatile than the market. |
Top Stocks That Created a New All Time High Today
Top Large Cap Stocks That Created a New All Time High Today
Companies with Market Capital more than 20,000 Crores| Stock | Close | New All-Time High (ATH) | Previous ATH | Previous ATH Date |
|---|---|---|---|---|
| MCX of India | 4427.70 (+1.13%) | 4465.00 (+9.63%) | 4072.60 | Fri 12 Apr 2024 |
| Muthoot Finance | 1893.00 (+0.73%) | 1902.00 (+%) | Thu 01 Jan 1970 | |
| NATCO Pharma | 1494.50 (+3.75%) | 1539.69 (+%) | Thu 01 Jan 1970 |
Top Mid Cap Stocks That Created a New All Time High Today
Companies with Market Capital between 5,000 Crores to 20,000 Crores| Stock | Close | New All-Time High (ATH) | Previous ATH | Previous ATH Date |
|---|---|---|---|---|
| BALUFORGE | 578.40 (+0.15%) | 598.45 (+%) | Thu 01 Jan 1970 | |
| Epigral | 1984.09 (+2.54%) | 2010.00 (+41.06%) | 1424.90 | Mon 22 Apr 2024 |
| Eris Lifesciences | 1208.94 (+0.9%) | 1217.00 (+%) | Thu 01 Jan 1970 | |
| HFCL | 140.10 (+5.72%) | 143.19 (+%) | Thu 01 Jan 1970 | |
| INOXGREEN | 188.45 (+11.54%) | 192.80 (+24.87%) | 154.39 | Wed 24 Apr 2024 |
Top Small Cap Stocks That Created a New All Time High Today
Companies with Market Capital less than 5,000 Crores| Stock | Close | New All-Time High (ATH) | Previous ATH | Previous ATH Date |
|---|---|---|---|---|
| Bright Brothers | 218.25 (+12.5%) | 228.00 (+%) | Thu 01 Jan 1970 | |
| Dharmaj Crop Guard | 361.89 (+3.93%) | 375.20 (+%) | Thu 01 Jan 1970 | |
| Delton Cables | 572.54 (+4.99%) | 572.54 (+%) | Thu 01 Jan 1970 | |
| EMS | 914.50 (+6.3%) | 924.00 (+%) | Thu 01 Jan 1970 | |
| Eveready Industries | 474.79 (+7.31%) | 482.20 (+%) | Thu 01 Jan 1970 |