Home / Mon 05 Aug 2024 Market Recap
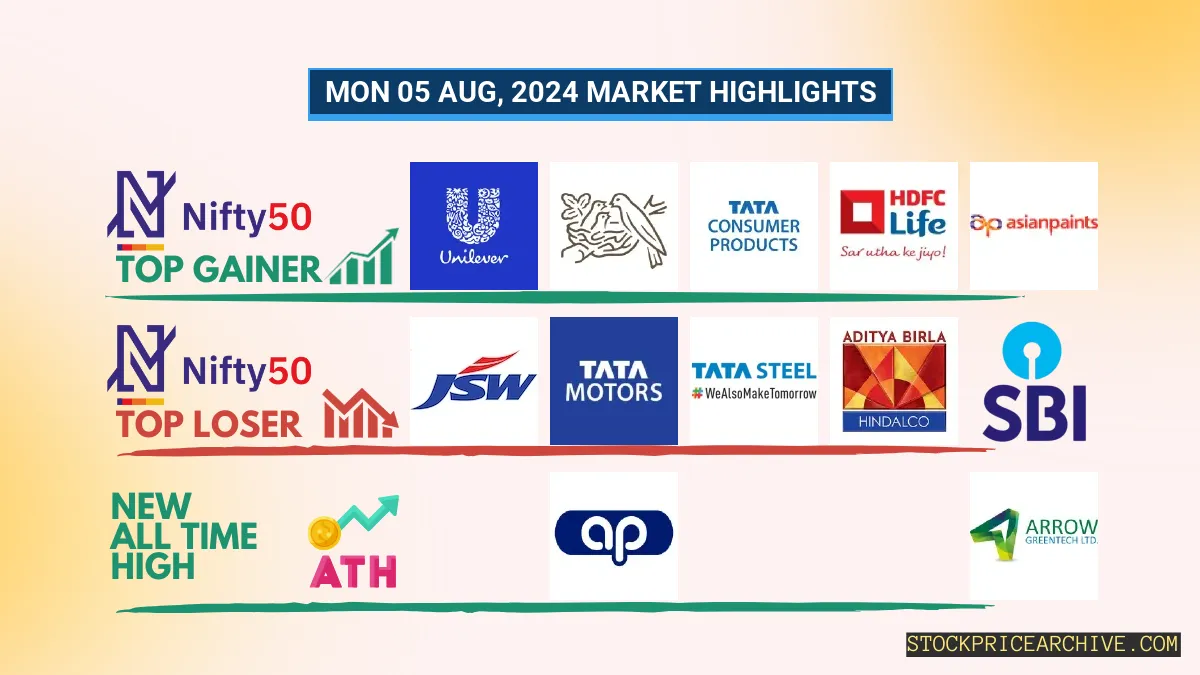
05 Aug 2024: Nifty 50 Plunges 2.7%: Metal & Auto Stocks Lead Selloff as JSW Steel (-7.87%) & Tata Motors (-5.62%) Tumble
Show Table of Contents
Table of Contents
- 1: Top Indices Performance Overview
- 2: Nifty 50 Performance Overview
- 2.1: Nifty 50 Top Gainers
- 2.2: Nifty 50 Top Losers
- 2.3: Nifty 50 Stocks To Watch for Tomorrow
- 2.3.1: Nestle India (Bullish Pattern)
- 2.3.2: ➲ GRASIM (Bearish Pattern)
- 3: Nifty 500 Performance Overview
- 3.1: Nifty 500 Top Gainers
- 3.2: Nifty 500 Top Losers
- 3.3: Nifty 51 to 500 Stocks To Watch for Tomorrow
- 3.3.1: Ajanta Pharma (Bullish Pattern)
- 3.3.2: ➲ Astral (Bearish Pattern)
- 4: Top Stocks That Created a New All Time High Today
- 4.1: Top Large Cap Stocks That Created a New All Time High Today
- 4.2: Top Mid Cap Stocks That Created a New All Time High Today
- 4.3: Top Small Cap Stocks That Created a New All Time High Today
Top Indices Performance Overview
| Stock | Close | Range |
|---|---|---|
| NIFTY 50 | ₹24,051.8 (-2.7%) | ₹23,893.69 – ₹24,350.05 |
| NIFTY BANK | ₹50056 (-2.53%) | ₹49,719.1 – ₹50,747.55 |
| NIFTY FIN SERVICE | ₹22,751.19 (-2.64%) | ₹22598 – ₹23,086.15 |
| NIFTY IT | ₹38,435.94 (-3.26%) | ₹37,829.1 – ₹39,044.69 |
| NIFTY AUTO | ₹24,706.5 (-3.92%) | ₹24,509.25 – ₹25,150.5 |
| NIFTY ENERGY | ₹42,640.89 (-3.82%) | ₹42,284.6 – ₹43,594.44 |
Nifty 50 Performance Overview
The Nifty 50 started the day at ₹24,323.69, showcasing a bit of a roller coaster ride. It dipped to a low of ₹23,893.69 before climbing to a high of ₹24,350.05. By the closing bell, the index settled at ₹24,051.8, down 2.7% for the day.
This movement was influenced by a mix of top gainers and losers, which you can find in the table below.
Nifty 50 Top Gainers
| Stock | Close | Range |
|---|---|---|
| Hindustan Unilever | ₹2722 (1.09%) | ₹2,666.19 – ₹2742 |
| Nestle India | ₹2,514.5 (0.77%) | ₹2,475.05 – ₹2,528.89 |
| Tata Consumer Products | ₹1202 (0.69%) | ₹1151 – ₹1,213.58 |
| HDFC Life | ₹710.9 (0.49%) | ₹690.04 – ₹713.9 |
Nifty 50 Top Losers
| Stock | Close | Range |
|---|---|---|
| JSW Steel | ₹861 (-7.87%) | ₹854.15 – ₹884 |
| Tata Motors | ₹1,015.45 (-7.41%) | ₹1,014.04 – ₹1065 |
| Tata Steel | ₹149.33 (-5.62%) | ₹149 – ₹154 |
| Hindalco | ₹613.5 (-5.33%) | ₹609.25 – ₹633.84 |
| SBI | ₹810 (-4.47%) | ₹800 – ₹831.34 |
Nifty 50 Stocks To Watch for Tomorrow
Nestle India (Bullish Pattern)
- Performance Overview: In the last 25 trading days, Nestle India closed higher 11 times and lower 14 times.
- Recent Trend: Nestle India has been on a 3-day winning streak, with no closing losses since Wednesday, July 31, 2024.
- Returns: Over the past 25 trading days, Nestle India generated a return of -1.77%. This means an investment of ₹10,000 would be worth ₹9,823 today.
- Financial Insight: Over the past year, Nestle India generated revenue of ₹19,665.02 Crore and achieved a profit of ₹3,244.46 Crore.
- As of Monday, August 5, 2024, Nestle India has a Market Capital of ₹2,40,846.42 Crore.
- Summary: Nestle India shows a strong bullish pattern. Keep an eye on its price movements for both short-term and long-term growth potential. Check out Nestle India Target for Tomorrow and Nestle India Targets for 2024 & 2025 for more insights.
Nestle India Financial Performance
| Metric | Value | Description |
|---|---|---|
| Market Capital | 2,40,846.42 Crore | Market valuation of Nestle India’s shares. |
| Revenue (TTM) | 19,665.02 Crore | Total revenue generated by Nestle India over the past twelve months. |
| Net Income (TTM) | +3,244.46 Crore | Net Profit or Loss after all the expenses over the past twelve months. |
| Operating Margin | 20.55% | Income from operations as a percentage of revenue, before taxes and interest. |
| Profit Margin | 16.49% | Net income as a percentage of revenue, after all expenses. |
| Revenue Growth (Quarterly) | +3.3% | Change in revenue compared to the previous quarter. |
| Earnings Growth (YOY Quarterly) | +6.9% | Change in earnings compared to the same quarter last year. |
| Debt-to-Equity (D/E) Ratio | 10.31 | Company’s total debt divided by total shareholder equity. |
| Total Debt | 344.76 Crore | Sum of Nestle India’s current & long-term financial obligations. |
| Total Cash | 798.84 Crore | Total amount of liquid funds available to Nestle India. |
| Beta | 0.06 | Beta is less than 1 indicating that the Nestle India’s price is less volatile than the market. |
➲ GRASIM (Bearish Pattern)
- Performance Overview: Over the past 25 trading days, GRASIM’s stock has closed lower 15 times and higher 10 times.
- Recent Trend: GRASIM has been on a downward trend, closing lower for the past six trading days, with the last green day being Friday, July 26, 2024.
- Returns: In the last 25 trading sessions, GRASIM has yielded a return of -1.92%. This means an investment of ₹10,000 would be worth ₹9,808 today.
- Financial Insight: Over the last year, GRASIM has generated revenue of ₹1,30,978.48 Crore and earned a profit of ₹5,624.48 Crore.
- As of Monday, August 5, 2024, GRASIM has a Market Capital of ₹1,83,406.48 Crore.
- Summary: GRASIM is currently in a bearish phase. Investors should keep a close eye on its performance, particularly the GRASIM Target for Tomorrow and GRASIM Targets for 2024 & 2025.
GRASIM Financial Performance
| Metric | Value | Description |
|---|---|---|
| Market Capital | 1,83,406.48 Crore | Market valuation of GRASIM’s shares. |
| Revenue (TTM) | 1,30,978.48 Crore | Total revenue generated by GRASIM over the past twelve months. |
| Net Income (TTM) | +5,624.48 Crore | Net Profit or Loss after all the expenses over the past twelve months. |
| Operating Margin | 17.41% | Income from operations as a percentage of revenue, before taxes and interest. |
| Profit Margin | 4.29% | Net income as a percentage of revenue, after all expenses. |
| Revenue Growth (Quarterly) | +12.7% | Change in revenue compared to the previous quarter. |
| Earnings Growth (YOY Quarterly) | +0.1% | Change in earnings compared to the same quarter last year. |
| Debt-to-Equity (D/E) Ratio | 100.1 | Company’s total debt divided by total shareholder equity. |
| Total Debt | 1,39,077.27 Crore | Sum of GRASIM’s current & long-term financial obligations. |
| Total Cash | 22,122.05 Crore | Total amount of liquid funds available to GRASIM. |
| Beta | 0.55 | Beta is less than 1 indicating that the GRASIM’s price is less volatile than the market. |
Nifty 500 Performance Overview
The Nifty 500 kicked off the day at ₹22,772.55, showing a bit of a roller coaster ride throughout the session. It dipped to a low of ₹22,397.69 before reaching a peak of ₹22,868.34. The index eventually closed at ₹22,542.44, down 3.09% from its starting point.
The movement was influenced by the top gainers and losers, which you can find in the table below.
Nifty 500 Top Gainers
| Stock | Close | Range |
|---|---|---|
| Lux Industries | ₹2299 (10.57%) | ₹2,039.34 – ₹2300 |
| Cera Sanitaryware | ₹9,436.7 (5.56%) | ₹8760 – ₹9487 |
| Glenmark Life Sciences | ₹932 (5.42%) | ₹851.25 – ₹954.59 |
| Dr. Lal Path labs | ₹3158 (1.98%) | ₹3,055.35 – ₹3,172.19 |
| Vijaya Diagnostic Centre | ₹800.95 (1.86%) | ₹763.79 – ₹805 |
Nifty 500 Top Losers
| Stock | Close | Range |
|---|---|---|
| Shree Renuka Sugars | ₹45.55 (-12.68%) | ₹45.22 – ₹47.35 |
| Redington | ₹190.25 (-11.38%) | ₹190 – ₹200 |
| RCF | ₹196 (-10.87%) | ₹195.32 – ₹207.45 |
| REC | ₹578 (-10%) | ₹572.65 – ₹597.2 |
| RBL Bank | ₹214.28 (-9.64%) | ₹211.73 – ₹222.82 |
Nifty 51 to 500 Stocks To Watch for Tomorrow
Ajanta Pharma (Bullish Pattern)
- Performance Overview: In the last 24 trading sessions, Ajanta Pharma has closed higher 17 times and lower 7 times.
- Recent Trend: Ajanta Pharma has been on a 3-day winning streak, without a single day closing lower since Tuesday, July 16, 2024.
- Returns: Ajanta Pharma delivered a 24.3% return in the last 24 trading sessions, meaning an investment of ₹10,000 would have grown to ₹12,429.99.
- Financial Insight: Over the past 12 months, Ajanta Pharma has generated revenue of ₹4,332.58 Crore and achieved a profit of ₹853.82 Crore.
- As of Monday, August 5, 2024, Ajanta Pharma has a Market Capital of ₹35,341.25 Crore.
- Summary: Ajanta Pharma presents a strong bullish pattern. Investors should keep an eye on its price movements for both short-term and long-term growth opportunities: Checkout Ajanta Pharma Target for Tomorrow and Ajanta Pharma Targets for 2024 & 2025.
Ajanta Pharma Financial Performance
| Metric | Value | Description |
|---|---|---|
| Market Capital | 35,341.25 Crore | Market valuation of Ajanta Pharma’s shares. |
| Revenue (TTM) | 4,332.58 Crore | Total revenue generated by Ajanta Pharma over the past twelve months. |
| Net Income (TTM) | +853.82 Crore | Net Profit or Loss after all the expenses over the past twelve months. |
| Operating Margin | 25.88% | Income from operations as a percentage of revenue, before taxes and interest. |
| Profit Margin | 19.7% | Net income as a percentage of revenue, after all expenses. |
| Revenue Growth (Quarterly) | +12.1% | Change in revenue compared to the previous quarter. |
| Earnings Growth (YOY Quarterly) | +18.09% | Change in earnings compared to the same quarter last year. |
| Debt-to-Equity (D/E) Ratio | 1.03 | Company’s total debt divided by total shareholder equity. |
| Total Debt | 36.84 Crore | Sum of Ajanta Pharma’s current & long-term financial obligations. |
| Total Cash | 459.54 Crore | Total amount of liquid funds available to Ajanta Pharma. |
| Beta | 0.04 | Beta is less than 1 indicating that the Ajanta Pharma’s price is less volatile than the market. |
➲ Astral (Bearish Pattern)
- Performance Overview: Over the last 25 trading days, Astral has ended the day lower than the previous day 18 times, and higher 7 times.
- Recent Trend: Astral has been on a downward trend for the past 6 days, with no positive closing since Friday, July 26, 2024.
- Returns: In the last 25 trading days, Astral has delivered a return of -11.54%. This means an investment of ₹10,000 would have become ₹8,846.
- Financial Insight: In the past 12 months, Astral has generated revenue of ₹5,641.39 Crore and a profit of ₹546.1 Crore.
- As of Monday, August 5, 2024, Astral has a Market Capital of ₹57,229.63 Crore.
- Summary: Astral is currently facing a bearish trend. It’s a good idea for investors to stay informed and monitor the situation closely. You might want to check out the Astral Target for Tomorrow and Astral Targets for 2024 & 2025 for additional insights.
Astral Financial Performance
| Metric | Value | Description |
|---|---|---|
| Market Capital | 57,229.63 Crore | Market valuation of Astral’s shares. |
| Revenue (TTM) | 5,641.39 Crore | Total revenue generated by Astral over the past twelve months. |
| Net Income (TTM) | +546.1 Crore | Net Profit or Loss after all the expenses over the past twelve months. |
| Operating Margin | 15.1% | Income from operations as a percentage of revenue, before taxes and interest. |
| Profit Margin | 9.68% | Net income as a percentage of revenue, after all expenses. |
| Revenue Growth (Quarterly) | +7.9% | Change in revenue compared to the previous quarter. |
| Earnings Growth (YOY Quarterly) | -11.7% | Change in earnings compared to the same quarter last year. |
| Debt-to-Equity (D/E) Ratio | 3.65 | Company’s total debt divided by total shareholder equity. |
| Total Debt | 119.4 Crore | Sum of Astral’s current & long-term financial obligations. |
| Total Cash | 609.5 Crore | Total amount of liquid funds available to Astral. |
| Beta | 0.48 | Beta is less than 1 indicating that the Astral’s price is less volatile than the market. |
Top Stocks That Created a New All Time High Today
Top Large Cap Stocks That Created a New All Time High Today
Companies with Market Capital more than 20,000 Crores| Stock | Close | New All-Time High (ATH) | Previous ATH | Previous ATH Date |
|---|---|---|---|---|
| Ajanta Pharma | 2841.85 (+0.47%) | 2873.94 (+%) | Thu 01 Jan 1970 | |
| Sun Pharma | 1720.34 (-0.66%) | 1758.00 (+7.58%) | 1634.00 | Thu 28 Mar 2024 |
Top Mid Cap Stocks That Created a New All Time High Today
Companies with Market Capital between 5,000 Crores to 20,000 Crores| Stock | Close | New All-Time High (ATH) | Previous ATH | Previous ATH Date |
|---|---|---|---|---|
| Black Box | 565.25 (+1.13%) | 584.00 (+%) | Thu 01 Jan 1970 | |
| Blue Jet Healthcare | 518.65 (+2.2%) | 530.00 (+%) | Thu 01 Jan 1970 | |
| Neuland Laboratories | 10800.00 (-2.51%) | 11800.00 (+55.05%) | 7610.00 | Tue 16 Apr 2024 |
| PCBL | 380.20 (+0.87%) | 396.89 (+%) | Thu 01 Jan 1970 | |
| Shakti Pumps | 4907.00 (+4.69%) | 4921.04 (+166.86%) | 1844.00 | Wed 24 Apr 2024 |
Top Small Cap Stocks That Created a New All Time High Today
Companies with Market Capital less than 5,000 Crores| Stock | Close | New All-Time High (ATH) | Previous ATH | Previous ATH Date |
|---|---|---|---|---|
| Ahmedabad Steelcraft | 168.64 (+1.99%) | 168.64 (+%) | Thu 01 Jan 1970 | |
| Arrow Greentech | 943.29 (+19.99%) | 943.29 (+%) | Thu 01 Jan 1970 | |
| Bits | 6.79 (+1.95%) | 6.79 (+%) | Thu 01 Jan 1970 | |
| Ceenik Exports | 1037.05 (+1.99%) | 1037.05 (+102.86%) | 511.20 | Wed 24 Apr 2024 |
| Chitradurga Spintex | 341.79 (+1.99%) | 341.79 (+57.58%) | 216.89 | Wed 24 Apr 2024 |