Home / Mon 01 Jul 2024 Market Recap
01 Jul 2024: Nifty Closes at ₹24,123.15 (+0.46%) – GRASIM Shows Bullish Pattern, Eicher Motors Faces Bearish Trend!

Show Table of Contents
Table of Contents
- 1: Top Indices Performance Overview
- 2: Nifty 50 Performance Overview
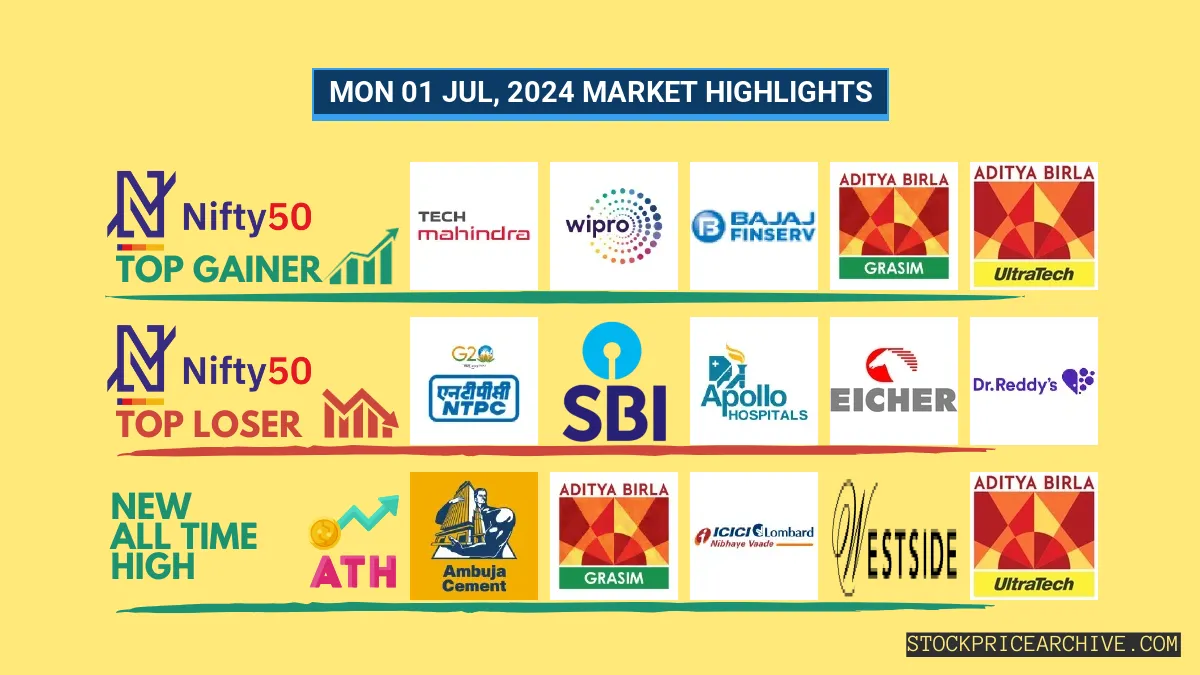
- 2.1: Nifty 50 Top Gainers
- 2.2: Nifty 50 Top Losers
- 2.3: Nifty 50 Stocks To Watch for Tomorrow
- 2.3.1: GRASIM (Bullish Pattern)
- 2.3.2: ➲ Eicher Motors (Bearish Trend)
- 3: Nifty 500 Performance Overview
- 3.1: Nifty 500 Top Gainers
- 3.2: Nifty 500 Top Losers
- 3.3: Nifty 51 to 500 Stocks To Watch for Tomorrow
- 3.3.1: Indus Towers (Showing Positive Signs)
- 3.3.2: ➲ Hindustan Petroleum (Bearish Pattern)
- 4: Top Stocks That Created a New All Time High Today
- 4.1: Top Large Cap Stocks That Created a New All Time High Today
- 4.2: Top Mid Cap Stocks That Created a New All Time High Today
- 4.3: Top Small Cap Stocks That Created a New All Time High Today
Top Indices Performance Overview
| Stock | Close | Range |
|---|---|---|
| NIFTY 50 | ₹24,123.15 (0.46%) | ₹24,007.05 – ₹24,162.9 |
| NIFTY BANK | ₹52,521.44 (0.34%) | ₹52,167.69 – ₹52,654.3 |
| NIFTY IT | ₹36,791.44 (1.75%) | ₹36,086.94 – ₹37,092.55 |
| NIFTY AUTO | ₹25,292.94 (0.36%) | ₹25,173.65 – ₹25,417.15 |
| NIFTY ENERGY | ₹41,589.75 (-0.48%) | ₹41,483.1 – ₹41,916.55 |
Nifty 50 Performance Overview
The Nifty 50 started the day at ₹24,022.59, showing some spirited movement throughout the session. It dipped to a low of ₹24,007.05 before reaching a peak of ₹24,162.9. By the closing bell, it settled at ₹24,123.15 (+0.46%), ending the day on a positive note.
Nifty 50 Top Gainers
| Stock | Close | Range |
|---|---|---|
| Tech Mahindra | ₹1,472.09 (2.91%) | ₹1,424.15 – ₹1,478.5 |
| WIPRO | ₹527.34 (2.42%) | ₹514.09 – ₹535.79 |
| Bajaj Finance | ₹7,262.2 (2.06%) | ₹7,081.79 – ₹7302 |
| GRASIM | ₹2,725.05 (2.04%) | ₹2,667.3 – ₹2,743.19 |
| UltraTech Cement | ₹11,904.65 (2.02%) | ₹11,667.9 – ₹12,031.59 |
Nifty 50 Top Losers
| Stock | Close | Range |
|---|---|---|
| NTPC | ₹370.64 (-2.04%) | ₹367.89 – ₹381.64 |
| SBI | ₹841.95 (-0.83%) | ₹839.95 – ₹850.5 |
| Apollo Hospitals | ₹6,134.75 (-0.83%) | ₹6,108.45 – ₹6,168.5 |
| Eicher Motors | ₹4,635.54 (-0.81%) | ₹4626 – ₹4,728.64 |
| Dr Reddy Lab | ₹6,353.7 (-0.76%) | ₹6,337.25 – ₹6,479.89 |
Nifty 50 Stocks To Watch for Tomorrow
GRASIM (Bullish Pattern)
- Performance Overview: In the last 25 trading sessions, GRASIM has closed in the green 16 times and in the red 9 times.
- Recent Trend: GRASIM has been on a 6-day green streak, with no red days since Friday, June 21, 2024.
- Returns: GRASIM has delivered a strong 11.63% return over the past 25 trading sessions. This means that an investment of ₹10,000 would have grown to ₹11,163.
- Financial Insight: Over the past 12 months, GRASIM has generated a revenue of ₹1,30,978.48 Crore and a profit of ₹5,624.48 Crore.
- As of Monday, July 1, 2024, GRASIM has a Market Capital of ₹1,81,171.06 Crore.
- Summary: GRASIM is showing a strong bullish pattern, making it an exciting stock to watch. Investors might want to consider its potential for both short-term and long-term growth. Checkout GRASIM Target for Tomorrow and GRASIM Targets for 2024 & 2025 for further insights.
GRASIM Financial Performance
| Metric | Value | Description |
|---|---|---|
| Market Capital | 1,81,171.06 Crore | Market valuation of GRASIM’s shares. |
| Revenue (TTM) | 1,30,978.48 Crore | Total revenue generated by GRASIM over the past twelve months. |
| Net Income (TTM) | +5,624.48 Crore | Net Profit or Loss after all the expenses over the past twelve months. |
| Operating Margin | 17.39% | Income from operations as a percentage of revenue, before taxes and interest. |
| Profit Margin | 4.29% | Net income as a percentage of revenue, after all expenses. |
| Revenue Growth (Quarterly) | +12.7% | Change in revenue compared to the previous quarter. |
| Earnings Growth (YOY Quarterly) | +0.1% | Change in earnings compared to the same quarter last year. |
| Debt-to-Equity (D/E) Ratio | 98.71 | Company’s total debt divided by total shareholder equity. |
| Total Debt | 1,37,155.05 Crore | Sum of GRASIM’s current & long-term financial obligations. |
| Total Cash | 22,925.35 Crore | Total amount of liquid funds available to GRASIM. |
| Beta | 0.54 | Beta is less than 1 indicating that the GRASIM’s price is less volatile than the market. |
➲ Eicher Motors (Bearish Trend)
- Recent Performance: Over the last 25 trading days, Eicher Motors has closed lower than the previous day 17 times, and higher 8 times.
- Current Trend: Eicher Motors has been on a downward trend for the past five trading days, with no gains since Monday, June 24, 2024.
- Returns: Eicher Motors has seen a -4.64% decrease in value over the past 25 trading sessions. This means an initial investment of ₹10,000 would be worth ₹9,536 today.
- Financial Highlights: In the last year, Eicher Motors generated revenue of ₹16,535.77 Crore and a profit of ₹4,001.01 Crore.
- As of Monday, July 1, 2024, Eicher Motors has a Market Capital of ₹1,28,043.97 Crore.
- In Summary: Eicher Motors is currently showing a bearish trend. We recommend investors keep a close eye on the stock’s movement, particularly considering the Eicher Motors Target for Tomorrow and Eicher Motors Targets for 2024 & 2025.
Eicher Motors Financial Performance
| Metric | Value | Description |
|---|---|---|
| Market Capital | 1,28,043.97 Crore | Market valuation of Eicher Motors’s shares. |
| Revenue (TTM) | 16,535.77 Crore | Total revenue generated by Eicher Motors over the past twelve months. |
| Net Income (TTM) | +4,001.01 Crore | Net Profit or Loss after all the expenses over the past twelve months. |
| Operating Margin | 22.63% | Income from operations as a percentage of revenue, before taxes and interest. |
| Profit Margin | 24.19% | Net income as a percentage of revenue, after all expenses. |
| Revenue Growth (Quarterly) | +15.4% | Change in revenue compared to the previous quarter. |
| Earnings Growth (YOY Quarterly) | +18.2% | Change in earnings compared to the same quarter last year. |
| Debt-to-Equity (D/E) Ratio | 2.32 | Company’s total debt divided by total shareholder equity. |
| Total Debt | 419.44 Crore | Sum of Eicher Motors’s current & long-term financial obligations. |
| Total Cash | 327.23 Crore | Total amount of liquid funds available to Eicher Motors. |
| Beta | 0.59 | Beta is less than 1 indicating that the Eicher Motors’s price is less volatile than the market. |
Nifty 500 Performance Overview
The Nifty 500 started the day at ₹22,580.05 and saw some exciting swings throughout the session. It dipped to a low of ₹22,571.09 before rallying to a high of ₹22,739.59. The index closed the day strong, finishing at ₹22,719.8 (+0.7%).
This movement was likely influenced by the top gainers and losers, which are listed in the table below.
Nifty 500 Top Gainers
| Stock | Close | Range |
|---|---|---|
| Sharda Cropchem | ₹495.45 (10.96%) | ₹445.5 – ₹499 |
| Epigral | ₹1,460.65 (10.25%) | ₹1342 – ₹1,475.94 |
| Mahanagar Gas | ₹1,753.09 (9.78%) | ₹1,596.09 – ₹1,756.55 |
| PB Fintech | ₹1,517.15 (8.58%) | ₹1,407.55 – ₹1543 |
| Chalet Hotels | ₹870.9 (8.4%) | ₹803.25 – ₹873.79 |
Nifty 500 Top Losers
| Stock | Close | Range |
|---|---|---|
| Brightcom Group | ₹8.91 (-5.02%) | ₹8.91 – ₹8.91 |
| Motilal Oswal Financial Services | ₹592 (-3.67%) | ₹585.79 – ₹613.95 |
| India Cements | ₹283.39 (-3.47%) | ₹282.1 – ₹293 |
| Torrent Power | ₹1,456.44 (-2.81%) | ₹1450 – ₹1,498.5 |
| RattanIndia Enterprises | ₹82.53 (-2.79%) | ₹82.27 – ₹84.8 |
Nifty 51 to 500 Stocks To Watch for Tomorrow
Indus Towers (Showing Positive Signs)
- Recent Performance: Over the past 25 trading days, Indus Towers has closed higher on 17 occasions and lower on 8. This indicates a strong upward trend.
- Current Trend: Indus Towers has been on a roll, closing higher for the past 8 days straight! This positive momentum began on Wednesday, June 19, 2024.
- Returns: In the last 25 trading sessions, Indus Towers has delivered impressive returns of 12.24%. This means that an initial investment of ₹10,000 would have grown to ₹11,224.
- Financial Highlights: During the last 12 months, Indus Towers generated a substantial revenue of ₹28,600.59 Crore and achieved a profit of ₹6,036.19 Crore. This strong performance signals financial health and potential for growth.
- As of Monday, July 1, 2024, Indus Towers has a Market Capitalization of ₹1,01,104.68 Crore, demonstrating its significant market presence.
- In Summary: Indus Towers exhibits a promising upward trend, making it a potential opportunity for investors seeking growth. It’s important to keep an eye on its price movements to gauge both short-term and long-term potential. Check out Indus Towers Target for Tomorrow and Indus Towers Targets for 2024 & 2025 for further insights.
Indus Towers Financial Performance
| Metric | Value | Description |
|---|---|---|
| Market Capital | 1,01,104.68 Crore | Market valuation of Indus Towers’s shares. |
| Revenue (TTM) | 28,600.59 Crore | Total revenue generated by Indus Towers over the past twelve months. |
| Net Income (TTM) | +6,036.19 Crore | Net Profit or Loss after all the expenses over the past twelve months. |
| Operating Margin | 35.28% | Income from operations as a percentage of revenue, before taxes and interest. |
| Profit Margin | 21.1% | Net income as a percentage of revenue, after all expenses. |
| Revenue Growth (Quarterly) | +6.5% | Change in revenue compared to the previous quarter. |
| Earnings Growth (YOY Quarterly) | +32.4% | Change in earnings compared to the same quarter last year. |
| Debt-to-Equity (D/E) Ratio | 75.93 | Company’s total debt divided by total shareholder equity. |
| Total Debt | 20,531 Crore | Sum of Indus Towers’s current & long-term financial obligations. |
| Total Cash | 63.1 Crore | Total amount of liquid funds available to Indus Towers. |
| Beta | 0.23 | Beta is less than 1 indicating that the Indus Towers’s price is less volatile than the market. |
➲ Hindustan Petroleum (Bearish Pattern)
- Performance Overview: In the last 25 trading sessions, Hindustan Petroleum has closed lower than the previous day 14 times and higher 11 times.
- Recent Trend: Hindustan Petroleum has been on a 7-day downward trend, without a single day closing higher since Thursday, June 20, 2024.
- Returns: Hindustan Petroleum has seen a -38.99% return in the last 25 trading sessions, meaning a ₹10,000 investment would have become ₹6,101.
- Financial Insight: Over the past 12 months, Indus Towers has generated a revenue of ₹4,32,034.7 Crore and a profit of ₹16,014.6 Crore.
- As of Monday, July 1, 2024, Indus Towers has a Market Capital of ₹70,664.9 Crore.
- Summary: Hindustan Petroleum is currently facing some challenges, showing a bearish trend. It’s wise to keep a close eye on its performance, especially checking the Hindustan Petroleum Target for Tomorrow and Hindustan Petroleum Targets for 2024 & 2025.
Hindustan Petroleum Financial Performance
| Metric | Value | Description |
|---|---|---|
| Market Capital | 70,664.9 Crore | Market valuation of Hindustan Petroleum’s shares. |
| Revenue (TTM) | 4,32,034.7 Crore | Total revenue generated by Hindustan Petroleum over the past twelve months. |
| Net Income (TTM) | +16,014.6 Crore | Net Profit or Loss after all the expenses over the past twelve months. |
| Operating Margin | 2.84% | Income from operations as a percentage of revenue, before taxes and interest. |
| Profit Margin | 3.7% | Net income as a percentage of revenue, after all expenses. |
| Revenue Growth (Quarterly) | +7.1% | Change in revenue compared to the previous quarter. |
| Earnings Growth (YOY Quarterly) | -24.9% | Change in earnings compared to the same quarter last year. |
| Debt-to-Equity (D/E) Ratio | 142.11 | Company’s total debt divided by total shareholder equity. |
| Total Debt | 66,683.81 Crore | Sum of Hindustan Petroleum’s current & long-term financial obligations. |
| Total Cash | 5,656.12 Crore | Total amount of liquid funds available to Hindustan Petroleum. |
| Beta | 0.88 | Beta is less than 1 indicating that the Hindustan Petroleum’s price is less volatile than the market. |
Top Stocks That Created a New All Time High Today
Top Large Cap Stocks That Created a New All Time High Today
Companies with Market Capital more than 20,000 Crores| Stock | Close | New All-Time High (ATH) | Previous ATH | Previous ATH Date |
|---|---|---|---|---|
| Ambuja Cements | 695.15 (+3.71%) | 701.59 (+8.51%) | 646.54 | Wed 24 Apr 2024 |
| Bayer Cropscience | 6680.00 (-0.49%) | 6971.00 (+%) | Thu 01 Jan 1970 | |
| CDSL | 2428.00 (+1.7%) | 2535.35 (+19.67%) | 2118.60 | Tue 23 Apr 2024 |
| Cholamandalam Financial | 1567.19 (+7.82%) | 1649.80 (+%) | Thu 01 Jan 1970 | |
| CIE Automotive India | 586.09 (+2.41%) | 605.00 (+%) | Thu 01 Jan 1970 |
Top Mid Cap Stocks That Created a New All Time High Today
Companies with Market Capital between 5,000 Crores to 20,000 Crores| Stock | Close | New All-Time High (ATH) | Previous ATH | Previous ATH Date |
|---|---|---|---|---|
| ASK Automotive | 377.64 (+3.76%) | 380.00 (+%) | Thu 01 Jan 1970 | |
| Aditya Vision | 4605.00 (+3.25%) | 4791.00 (+%) | Thu 01 Jan 1970 | |
| Black Box | 385.39 (+9.92%) | 397.00 (+%) | Thu 01 Jan 1970 | |
| Can Fin Homes | 923.45 (+0.9%) | 938.00 (+%) | Thu 01 Jan 1970 | |
| CMS Info Systems | 509.60 (+3.25%) | 515.70 (+%) | Thu 01 Jan 1970 |
Top Small Cap Stocks That Created a New All Time High Today
Companies with Market Capital less than 5,000 Crores| Stock | Close | New All-Time High (ATH) | Previous ATH | Previous ATH Date |
|---|---|---|---|---|
| 21ST CENTURY MANAG | 67.91 (+1.99%) | 67.91 (+%) | Thu 01 Jan 1970 | |
| Abans Holdings | 499.79 (+7.92%) | 509.89 (+17.05%) | 435.60 | Wed 10 Apr 2024 |
| Ahmedabad Steelcraft | 105.30 (+1.99%) | 105.30 (+%) | Thu 01 Jan 1970 | |
| A.K. Spintex | 258.04 (+19.35%) | 259.39 (+%) | Thu 01 Jan 1970 | |
| Allsec Technologies | 1224.00 (+6.06%) | 1242.00 (+%) | Thu 01 Jan 1970 |


