Home / Fri 26 Jul 2024 Market Recap
26 Jul 2024: Nifty Closes at ₹24,851.75 (+1.82%), HDFC Life & Ajanta Pharma Show Strong Growth, Nestle India Dips
Show Table of Contents
Table of Contents
- 1: Top Indices Performance Overview
- 2: Nifty 50 Performance Overview
- 2.1: Nifty 50 Top Gainers
- 2.2: Nifty 50 Top Losers
- 2.3: Nifty 50 Stocks To Watch for Tomorrow
- 2.3.1: HDFC Life (Bullish Pattern)
- 2.3.2: ➲ Nestle India (Bearish Trend)
- 3: Nifty 500 Performance Overview
- 3.1: Nifty 500 Top Gainers
- 3.2: Nifty 500 Top Losers
- 3.3: Nifty 51 to 500 Stocks To Watch for Tomorrow
- 3.3.1: Ajanta Pharma: A Bullish Outlook
- 3.3.2: Godavari Power and Ispat (Bearish Trend)
- 4: Top Stocks That Created a New All Time High Today
- 4.1: Top Large Cap Stocks That Created a New All Time High Today
- 4.2: Top Mid Cap Stocks That Created a New All Time High Today
- 4.3: Top Small Cap Stocks That Created a New All Time High Today
Top Indices Performance Overview
| Stock | Close | Range |
|---|---|---|
| NIFTY 50 | ₹24,851.75 (1.82%) | ₹24,415.15 – ₹24,860.05 |
| NIFTY BANK | ₹51,352.75 (0.91%) | ₹50,491.85 – ₹51,385.5 |
| NIFTY FIN SERVICE | ₹23,338.44 (1.25%) | ₹22,955.19 – ₹23,352.8 |
| NIFTY IT | ₹41,002.55 (2.36%) | ₹40,088.85 – ₹41,072.75 |
| NIFTY AUTO | ₹26,229.4 (2.34%) | ₹25,603.59 – ₹26,288.34 |
| NIFTY ENERGY | ₹43,230.8 (1.07%) | ₹42,937.25 – ₹43,389.14 |
Nifty 50 Performance Overview
The Nifty 50 kicked off the day at ₹24,430.05, showing some initial volatility. It dipped to a low of ₹24,415.15 before rallying to a high of ₹24,860.05. The index ultimately closed at ₹24,851.75, marking a strong 1.82% gain for the day.
Let’s see which stocks were the key drivers behind this positive movement.
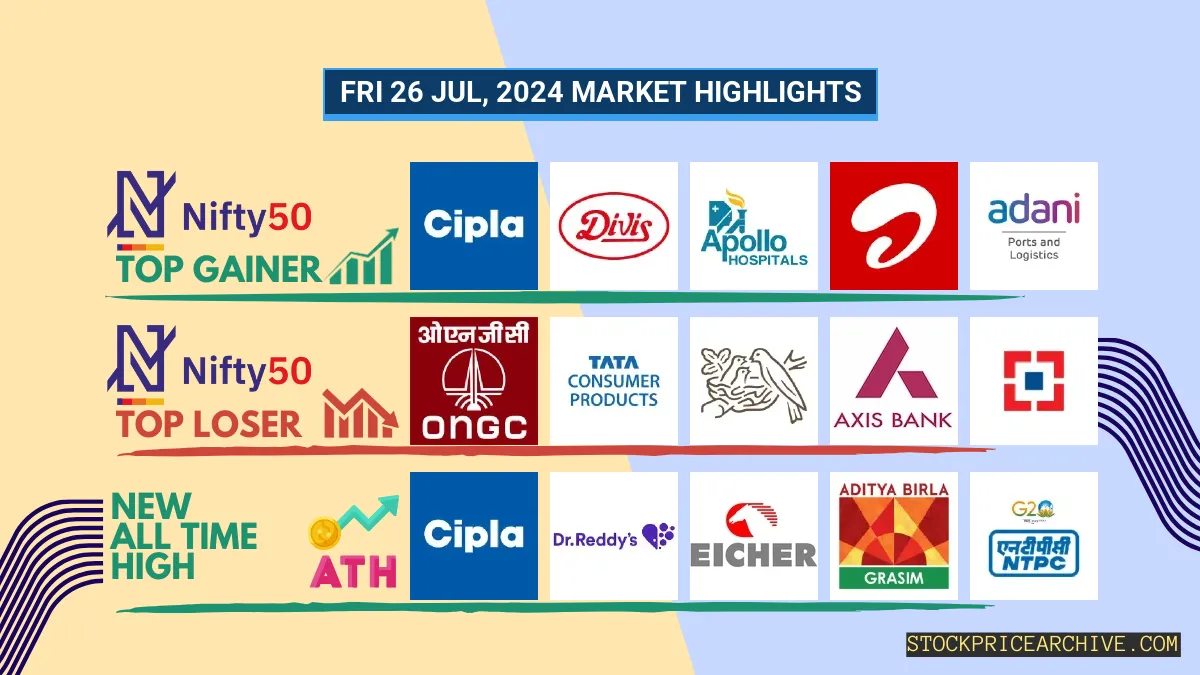
Nifty 50 Top Gainers
| Stock | Close | Range |
|---|---|---|
| Cipla | ₹1,586.25 (5.74%) | ₹1,501.09 – ₹1,599.3 |
| Divis Lab | ₹4792 (5.38%) | ₹4,565.45 – ₹4810 |
| Apollo Hospitals | ₹6666 (4.38%) | ₹6,411.54 – ₹6,679.95 |
| Bharti Airtel | ₹1,510.05 (4.2%) | ₹1452 – ₹1,519.94 |
| Adani Ports | ₹1,540.75 (3.61%) | ₹1,490.09 – ₹1,547.9 |
Nifty 50 Top Losers
| Stock | Close | Range |
|---|---|---|
| ONGC | ₹331.5 (-1.28%) | ₹330.14 – ₹338.39 |
| Tata Consumer Products | ₹1,213.65 (-0.82%) | ₹1,205.4 – ₹1,218.94 |
| Nestle India | ₹2478 (-0.11%) | ₹2,451.5 – ₹2,491.35 |
| Axis Bank | ₹1176 (0%) | ₹1,157.8 – ₹1,183.08 |
| HDFC BANK | ₹1,617.3 (0.04%) | ₹1,596.65 – ₹1,621.75 |
Nifty 50 Stocks To Watch for Tomorrow
HDFC Life (Bullish Pattern)
- Performance Overview: Over the last 26 trading sessions, HDFC Life has closed higher than the previous day’s closing price 20 times, and lower 6 times. This indicates a positive trend.
- Recent Trend: HDFC Life has enjoyed a strong run, closing higher for five consecutive days, since Friday, July 19, 2024.
- Returns: During this recent period, HDFC Life has delivered impressive returns, generating a 17.95% gain. This means that an investment of ₹10,000 would have grown to ₹11,795.
- Financial Insight: HDFC Life’s strong performance is backed by solid financials. Over the past year, the company generated a revenue of ₹1,05,462.41 Crore and a profit of ₹1,636.34 Crore.
- As of Friday, July 26, 2024, HDFC Life boasts a robust market capitalization of ₹1,36,746.48 Crore.
- Summary: HDFC Life’s recent performance and strong financials paint a positive picture. This bullish pattern suggests potential for future growth. If you’re considering an investment, it’s important to monitor price movements closely. Check out our predictions for both short-term and long-term price targets: HDFC Life Target for Tomorrow and HDFC Life Targets for 2024 & 2025.
HDFC Life Financial Performance
| Metric | Value | Description |
|---|---|---|
| Market Capital | 1,36,746.48 Crore | Market valuation of HDFC Life’s shares. |
| Revenue (TTM) | 1,05,462.41 Crore | Total revenue generated by HDFC Life over the past twelve months. |
| Net Income (TTM) | +1,636.34 Crore | Net Profit or Loss after all the expenses over the past twelve months. |
| Operating Margin | 1.48% | Income from operations as a percentage of revenue, before taxes and interest. |
| Profit Margin | 1.55% | Net income as a percentage of revenue, after all expenses. |
| Revenue Growth (Quarterly) | +15% | Change in revenue compared to the previous quarter. |
| Earnings Growth (YOY Quarterly) | +15.3% | Change in earnings compared to the same quarter last year. |
| Debt-to-Equity (D/E) Ratio | 6.18 | Company’s total debt divided by total shareholder equity. |
| Total Debt | 950 Crore | Sum of HDFC Life’s current & long-term financial obligations. |
| Total Cash | 579.77 Crore | Total amount of liquid funds available to HDFC Life. |
| Beta | 0.83 | Beta is less than 1 indicating that the HDFC Life’s price is less volatile than the market. |
➲ Nestle India (Bearish Trend)
- Recent Performance: Nestle India has had a bit of a rollercoaster ride in the past 26 trading sessions. It closed lower 14 times and higher 12 times.
- Recent Trend: Nestle India’s share price has been on a downward path for the past 6 trading days, closing lower every day since July 18th, 2024.
- Returns: Over the last 26 trading sessions, Nestle India’s share price has declined by 1.87%. This means that an investment of ₹10,000 would have become ₹9,813.
- Financial Insights: Nestle India’s financial performance over the past year has been strong. They generated revenue of ₹19,509.6 Crore and a profit of ₹3,196.19 Crore.
- As of July 26th, 2024, Nestle India’s market capitalization stands at a substantial ₹2,50,473.53 Crore.
- Summary: Nestle India’s share price is currently facing a bearish trend. It’s a good idea to keep a close eye on the stock’s movement in the coming days. You can find potential targets for tomorrow and the future on our website: Nestle India Target for Tomorrow and Nestle India Targets for 2024 & 2025.
Nestle India Financial Performance
| Metric | Value | Description |
|---|---|---|
| Market Capital | 2,50,473.53 Crore | Market valuation of Nestle India’s shares. |
| Revenue (TTM) | 19,509.6 Crore | Total revenue generated by Nestle India over the past twelve months. |
| Net Income (TTM) | +3,196.19 Crore | Net Profit or Loss after all the expenses over the past twelve months. |
| Operating Margin | 23.34% | Income from operations as a percentage of revenue, before taxes and interest. |
| Profit Margin | 16.38% | Net income as a percentage of revenue, after all expenses. |
| Revenue Growth (Quarterly) | +9% | Change in revenue compared to the previous quarter. |
| Earnings Growth (YOY Quarterly) | +26.8% | Change in earnings compared to the same quarter last year. |
| Debt-to-Equity (D/E) Ratio | 10.31 | Company’s total debt divided by total shareholder equity. |
| Total Debt | 344.52 Crore | Sum of Nestle India’s current & long-term financial obligations. |
| Total Cash | 818.82 Crore | Total amount of liquid funds available to Nestle India. |
| Beta | 0.06 | Beta is less than 1 indicating that the Nestle India’s price is less volatile than the market. |
Nifty 500 Performance Overview
The Nifty 500 started the day at ₹22,975.94. It went on a bit of a rollercoaster ride, dipping to a low of ₹22,969.9 and soaring to a high of ₹23,304.84 before settling down for the day at ₹23,299.75, a healthy +1.66% gain.
Let’s take a peek at the top gainers and losers that helped shape the Nifty 500’s performance today:
Nifty 500 Top Gainers
| Stock | Close | Range |
|---|---|---|
| NIACL | ₹290.6 (12.44%) | ₹257 – ₹308.7 |
| One 97 Communications | ₹509.04 (9.99%) | ₹459 – ₹509.04 |
| General Insurance Corp | ₹408.79 (9.84%) | ₹369.6 – ₹434.64 |
| Infibeam Avenues | ₹31.5 (9.83%) | ₹28.75 – ₹32.26 |
| Shriram Finance | ₹2932 (9.44%) | ₹2,690.64 – ₹2,980.44 |
Nifty 500 Top Losers
| Stock | Close | Range |
|---|---|---|
| MMTC | ₹106.85 (-11.63%) | ₹105.18 – ₹131.69 |
| Cyient | ₹1,792.9 (-5.35%) | ₹1,723.9 – ₹1,794.94 |
| Tata Teleservices | ₹102.35 (-3.51%) | ₹100.3 – ₹109.85 |
| Mankind Pharma | ₹2,069.19 (-3.51%) | ₹2050 – ₹2225 |
| United Breweries | ₹2037 (-3.43%) | ₹2025 – ₹2135 |
Nifty 51 to 500 Stocks To Watch for Tomorrow
Ajanta Pharma: A Bullish Outlook
- Performance Overview: Over the past 26 trading sessions (ending July 26, 2024), Ajanta Pharma has closed higher than the previous day 15 times and lower 11 times.
- Recent Trend: Ajanta Pharma has been on a roll, closing higher each day for the past 7 trading sessions (since July 16, 2024).
- Returns: If you had invested ₹10,000 in Ajanta Pharma 26 trading days ago, it would be worth ₹10,234 today, representing a 2.34% return.
- Financial Insight: In the past 12 months, Ajanta Pharma has generated revenue of ₹4,208.71 Crore and a profit of ₹816.16 Crore.
- As of July 26, 2024, Ajanta Pharma’s market capitalization stands at ₹28,569.38 Crore.
- Summary: Ajanta Pharma is showing strong bullish signs. While past performance isn’t a guarantee of future results, the company’s recent positive trend is worth noting. If you’re interested in exploring potential future price movements, you can check out the Ajanta Pharma Target for Tomorrow and Ajanta Pharma Targets for 2024 & 2025.
Ajanta Pharma Financial Performance
| Metric | Value | Description |
|---|---|---|
| Market Capital | 28,569.38 Crore | Market valuation of Ajanta Pharma’s shares. |
| Revenue (TTM) | 4,208.71 Crore | Total revenue generated by Ajanta Pharma over the past twelve months. |
| Net Income (TTM) | +816.16 Crore | Net Profit or Loss after all the expenses over the past twelve months. |
| Operating Margin | 24.01% | Income from operations as a percentage of revenue, before taxes and interest. |
| Profit Margin | 19.39% | Net income as a percentage of revenue, after all expenses. |
| Revenue Growth (Quarterly) | +19.5% | Change in revenue compared to the previous quarter. |
| Earnings Growth (YOY Quarterly) | +65.8% | Change in earnings compared to the same quarter last year. |
| Debt-to-Equity (D/E) Ratio | 1.03 | Company’s total debt divided by total shareholder equity. |
| Total Debt | 36.84 Crore | Sum of Ajanta Pharma’s current & long-term financial obligations. |
| Total Cash | 459.54 Crore | Total amount of liquid funds available to Ajanta Pharma. |
| Beta | 0.04 | Beta is less than 1 indicating that the Ajanta Pharma’s price is less volatile than the market. |
Godavari Power and Ispat (Bearish Trend)
- Performance Snapshot: Over the last 26 trading days, Godavari Power and Ispat has closed lower than the previous day 17 times, while closing higher 8 times.
- Recent Trend: Godavari Power and Ispat has been on a downward streak for the past 7 days, with no positive closes since Tuesday, July 16, 2024.
- Returns: In the last 26 trading days, Godavari Power and Ispat has seen a return of -6.52%. This means an investment of ₹10,000 would have been worth ₹9,348.
- Financial Snapshot: Over the past 12 months, Godavari Power and Ispat has generated revenue of ₹5,455.35 Crore and a profit of ₹936.54 Crore.
- As of Friday, July 26, 2024, Godavari Power and Ispat has a Market Capital of ₹14,296.61 Crore.
- Summary: Godavari Power and Ispat is currently facing a bearish trend. Keep a close watch on the share price, especially the Godavari Power and Ispat Target for Tomorrow and Godavari Power and Ispat Targets for 2024 & 2025.
Godavari Power and Ispat Financial Performance
| Metric | Value | Description |
|---|---|---|
| Market Capital | 14,296.61 Crore | Market valuation of Godavari Power and Ispat’s shares. |
| Revenue (TTM) | 5,455.35 Crore | Total revenue generated by Godavari Power and Ispat over the past twelve months. |
| Net Income (TTM) | +936.54 Crore | Net Profit or Loss after all the expenses over the past twelve months. |
| Operating Margin | 19.1% | Income from operations as a percentage of revenue, before taxes and interest. |
| Profit Margin | 17.16% | Net income as a percentage of revenue, after all expenses. |
| Revenue Growth (Quarterly) | +16.2% | Change in revenue compared to the previous quarter. |
| Earnings Growth (YOY Quarterly) | +29.5% | Change in earnings compared to the same quarter last year. |
| Debt-to-Equity (D/E) Ratio | 1.13 | Company’s total debt divided by total shareholder equity. |
| Total Debt | 51.63 Crore | Sum of Godavari Power and Ispat’s current & long-term financial obligations. |
| Total Cash | 870.44 Crore | Total amount of liquid funds available to Godavari Power and Ispat. |
| Beta | 1.57 | Beta is greater than 1 indicating that the Godavari Power and Ispat’s price is more volatile than the market. |
Top Stocks That Created a New All Time High Today
Top Large Cap Stocks That Created a New All Time High Today
Companies with Market Capital more than 20,000 Crores| Stock | Close | New All-Time High (ATH) | Previous ATH | Previous ATH Date |
|---|---|---|---|---|
| Alembic Pharma | 1206.00 (+0.42%) | 1224.90 (+%) | Thu 01 Jan 1970 | |
| Apollo Tyres | 550.00 (+2.42%) | 558.45 (+%) | Thu 01 Jan 1970 | |
| Ashok Leyland | 246.17 (+5.91%) | 248.85 (+%) | Thu 01 Jan 1970 | |
| BASF | 5829.39 (-5.57%) | 6225.14 (+%) | Thu 01 Jan 1970 | |
| Castrol | 265.89 (-1.87%) | 278.76 (+%) | Thu 01 Jan 1970 |
Top Mid Cap Stocks That Created a New All Time High Today
Companies with Market Capital between 5,000 Crores to 20,000 Crores| Stock | Close | New All-Time High (ATH) | Previous ATH | Previous ATH Date |
|---|---|---|---|---|
| Ashoka Buildcon | 262.00 (+0.79%) | 271.67 (+%) | Thu 01 Jan 1970 | |
| Aditya Vision | 4945.00 (+1.57%) | 4950.00 (+%) | Thu 01 Jan 1970 | |
| Black Box | 450.00 (+3.36%) | 457.10 (+%) | Thu 01 Jan 1970 | |
| Eris Lifesciences | 1076.50 (+0.61%) | 1098.65 (+%) | Thu 01 Jan 1970 | |
| Ethos | 3299.94 (+3.47%) | 3369.19 (+%) | Thu 01 Jan 1970 |
Top Small Cap Stocks That Created a New All Time High Today
Companies with Market Capital less than 5,000 Crores| Stock | Close | New All-Time High (ATH) | Previous ATH | Previous ATH Date |
|---|---|---|---|---|
| 20 Microns | 256.70 (+17.53%) | 262.07 (+%) | Thu 01 Jan 1970 | |
| Ace Software Exports | 347.60 (+1.99%) | 347.60 (+131.3%) | 150.28 | Mon 01 Apr 2024 |
| Abans Holdings | 558.79 (+5.3%) | 567.90 (+30.37%) | 435.60 | Wed 10 Apr 2024 |
| Ahmedabad Steelcraft | 149.89 (+1.97%) | 149.89 (+%) | Thu 01 Jan 1970 | |
| Arvind SmartSpaces | 803.00 (+1.91%) | 826.00 (+10.02%) | 750.75 | Wed 03 Apr 2024 |