Home / Fri 16 Aug 2024 Market Recap
16 Aug 2024: Nifty Closes at ₹24,540.19 (+1.64%), Mankind Pharma on an impressive 8-day green streak, Elgi Equipments on a downward trend
Show Table of Contents
Table of Contents
- 1: Top Indices Performance Overview
- 2: Nifty 50 Performance Overview
- 2.1: Nifty 50 Top Gainers
- 2.2: Nifty 50 Top Losers
- 2.3: Nifty 50 Stocks To Watch for Tomorrow
- 2.3.1: ➲ Bharti Airtel (Looking Bullish)
- 2.3.2: ➲ Divis Lab (Bearish Trend)
- 3: Nifty 500 Performance Overview
- 3.1: Nifty 500 Top Gainers
- 3.2: Nifty 500 Top Losers
- 3.3: Nifty 51 to 500 Stocks To Watch for Tomorrow
- 3.3.1: Mankind Pharma: A Bullish Trend Takes Shape
- 3.3.2: ➲ Elgi Equipments (Bearish Trend)
- 4: Top Stocks That Created a New All Time High Today
- 4.1: Top Large Cap Stocks That Created a New All Time High Today
- 4.2: Top Mid Cap Stocks That Created a New All Time High Today
- 4.3: Top Small Cap Stocks That Created a New All Time High Today
Top Indices Performance Overview
| Stock | Close | Range |
|---|---|---|
| NIFTY 50 | ₹24,540.19 (1.64%) | ₹24,204.5 – ₹24,563.9 |
| NIFTY BANK | ₹50,510.94 (1.57%) | ₹49,806.05 – ₹50,603.39 |
| NIFTY FIN SERVICE | ₹22,969.34 (1.67%) | ₹22,617.94 – ₹22,997.09 |
| NIFTY IT | ₹40,878.25 (2.88%) | ₹40,063.89 – ₹40,927.14 |
| NIFTY AUTO | ₹25,597.34 (2%) | ₹25,261.75 – ₹25,635.44 |
| NIFTY ENERGY | ₹42,762.69 (1.09%) | ₹42,244.55 – ₹42,807.6 |
Nifty 50 Performance Overview
The Nifty 50 started the day at ₹24,332.15, showing some ups and downs throughout the trading session. It dipped to a low of ₹24,204.5 before climbing to a high of ₹24,563.9. The index ultimately closed at ₹24,540.19, a +1.64% gain for the day.
Below is a table outlining the top gainers and losers, giving you a glimpse of what drove today’s Nifty 50 movement.
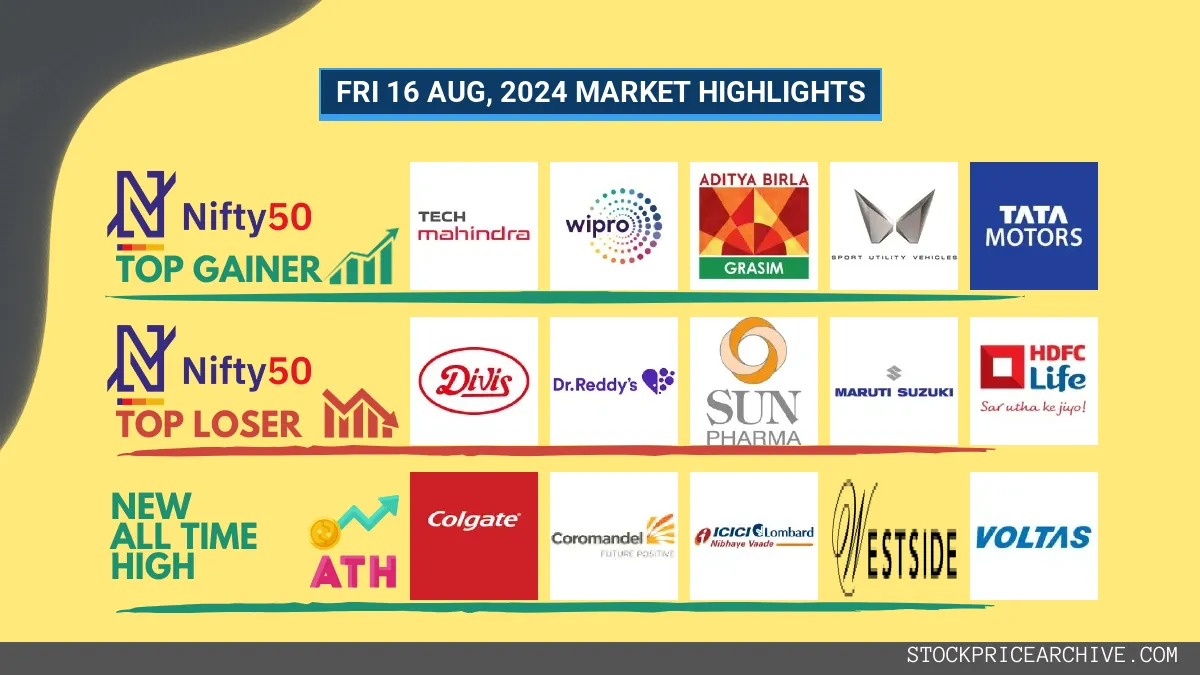
Nifty 50 Top Gainers
| Stock | Close | Range |
|---|---|---|
| Tech Mahindra | ₹1,585.25 (3.99%) | ₹1,531.3 – ₹1589 |
| WIPRO | ₹516.09 (3.75%) | ₹497.95 – ₹517.45 |
| GRASIM | ₹2,603.94 (3.64%) | ₹2,512.39 – ₹2608 |
| Mahindra & Mahindra | ₹2840 (3.45%) | ₹2,776.14 – ₹2,845.05 |
| Tata Motors | ₹1098 (3.35%) | ₹1070 – ₹1,099.94 |
Nifty 50 Top Losers
| Stock | Close | Range |
|---|---|---|
| Divis Lab | ₹4,633.89 (-0.61%) | ₹4,623.29 – ₹4,709.79 |
| Dr Reddy Lab | ₹6799 (-0.03%) | ₹6,758.14 – ₹6,848.95 |
| Sun Pharma | ₹1,741.5 (-0.01%) | ₹1,728.65 – ₹1,751.15 |
| Maruti Suzuki | ₹12,213.29 (0.06%) | ₹12111 – ₹12,343.95 |
| HDFC Life | ₹689.4 (0.44%) | ₹664.65 – ₹690.59 |
Nifty 50 Stocks To Watch for Tomorrow
➲ Bharti Airtel (Looking Bullish)
- Performance Overview: Over the past 25 trading sessions, Bharti Airtel has shown some strength, closing higher on 13 days and lower on 12 days.
- Recent Trend: Bharti Airtel is on a roll, with a 3-day winning streak – it hasn’t closed lower since Monday, August 12th, 2024.
- Returns: If you had invested ₹10,000 in Bharti Airtel over the last 25 trading sessions, your investment would have grown to ₹10,230.99, representing a 2.31% return.
- Financial Insight: During the past 12 months, Bharti Airtel generated a revenue of ₹1,51,048.8 Crore and achieved a profit of ₹10,014.39 Crore.
- As of Friday, August 16th, 2024, Bharti Airtel boasts a Market Capital of ₹8,67,845.22 Crore.
- Summary: Bharti Airtel is currently showing a positive trend, making it attractive for investors. If you’re interested in exploring its potential, you can check out the Bharti Airtel Target for Tomorrow and Bharti Airtel Targets for 2024 & 2025 for some insights into its future.
Bharti Airtel Financial Performance
| Metric | Value | Description |
|---|---|---|
| Market Capital | 8,67,845.22 Crore | Market valuation of Bharti Airtel’s shares. |
| Revenue (TTM) | 1,51,048.8 Crore | Total revenue generated by Bharti Airtel over the past twelve months. |
| Net Income (TTM) | +10,014.39 Crore | Net Profit or Loss after all the expenses over the past twelve months. |
| Operating Margin | 23.8% | Income from operations as a percentage of revenue, before taxes and interest. |
| Profit Margin | 6.63% | Net income as a percentage of revenue, after all expenses. |
| Revenue Growth (Quarterly) | +2.8% | Change in revenue compared to the previous quarter. |
| Earnings Growth (YOY Quarterly) | +158% | Change in earnings compared to the same quarter last year. |
| Debt-to-Equity (D/E) Ratio | 186.43 | Company’s total debt divided by total shareholder equity. |
| Total Debt | 2,08,874.29 Crore | Sum of Bharti Airtel’s current & long-term financial obligations. |
| Total Cash | 13,266 Crore | Total amount of liquid funds available to Bharti Airtel. |
| Beta | 0.25 | Beta is less than 1 indicating that the Bharti Airtel’s price is less volatile than the market. |
➲ Divis Lab (Bearish Trend)
- Recent Performance: Over the past 25 trading days, Divis Lab has closed lower than the previous day 14 times and higher 11 times.
- Short-Term Trend: Divis Lab has been on a downward trend for the past three trading days, with the share price closing lower each day since Monday, August 12, 2024.
- Returns: In the last 25 trading days, Divis Lab has experienced a -0.49% return. This means if you had invested ₹10,000, your investment would be worth ₹9,951 today.
- Financial Highlights: Over the last year, Divis Lab generated ₹8,184.99 Crore in revenue and earned a profit of ₹1,673.99 Crore.
- As of Friday, August 16, 2024, Divis Lab has a market capitalization of ₹1,28,340.95 Crore.
- Summary: Divis Lab is currently exhibiting a bearish trend. Investors may want to keep a close eye on the stock’s performance, particularly the short-term and long-term price targets. You can find more information about Divis Lab’s Target for Tomorrow and Divis Lab’s Targets for 2024 and 2025.
Divis Lab Financial Performance
| Metric | Value | Description |
|---|---|---|
| Market Capital | 1,28,340.95 Crore | Market valuation of Divis Lab’s shares. |
| Revenue (TTM) | 8,184.99 Crore | Total revenue generated by Divis Lab over the past twelve months. |
| Net Income (TTM) | +1,673.99 Crore | Net Profit or Loss after all the expenses over the past twelve months. |
| Operating Margin | 24.83% | Income from operations as a percentage of revenue, before taxes and interest. |
| Profit Margin | 20.45% | Net income as a percentage of revenue, after all expenses. |
| Revenue Growth (Quarterly) | +19.1% | Change in revenue compared to the previous quarter. |
| Earnings Growth (YOY Quarterly) | +20.8% | Change in earnings compared to the same quarter last year. |
| Debt-to-Equity (D/E) Ratio | 0.02 | Company’s total debt divided by total shareholder equity. |
| Total Debt | 3 Crore | Sum of Divis Lab’s current & long-term financial obligations. |
| Total Cash | 3,697.99 Crore | Total amount of liquid funds available to Divis Lab. |
| Beta | 0.36 | Beta is less than 1 indicating that the Divis Lab’s price is less volatile than the market. |
Nifty 500 Performance Overview
The Nifty 500 started the day at ₹22,846.09 and traded in a range, reaching a low of ₹22,750.55 and a high of ₹23,071.5. The index closed the session up 1.66% at ₹23,050.69.
The day’s movement was influenced by a mix of gainers and losers, whose impact is summarized in the table below.
Nifty 500 Top Gainers
| Stock | Close | Range |
|---|---|---|
| Suprajit Engineering | ₹622.9 (15.53%) | ₹566 – ₹639.59 |
| CDSL | ₹2804 (9.5%) | ₹2,580.35 – ₹2812 |
| Welspun Corp | ₹710 (8.96%) | ₹667.4 – ₹710 |
| Polyplex Corporation | ₹1,288.58 (8.79%) | ₹1,215.08 – ₹1311 |
| Nippon Life India Asset Management | ₹690.95 (8.12%) | ₹648 – ₹691 |
Nifty 500 Top Losers
| Stock | Close | Range |
|---|---|---|
| Hindustan Zinc | ₹518 (-9.41%) | ₹516.9 – ₹544 |
| Vardhman Textiles | ₹491.79 (-6.23%) | ₹486 – ₹498.5 |
| Welspun India | ₹176 (-4.47%) | ₹173.85 – ₹178.85 |
| RattanIndia Enterprises | ₹79.93 (-4.35%) | ₹79.5 – ₹86.24 |
| Adani Energy | ₹1,085.3 (-2.55%) | ₹1,073.08 – ₹1138 |
Nifty 51 to 500 Stocks To Watch for Tomorrow
Mankind Pharma: A Bullish Trend Takes Shape
- Performance Overview: Over the past 25 trading days, Mankind Pharma has closed in the green 13 times and in the red 12 times. This indicates a slight upward bias in the recent market activity.
- Recent Trend: Mankind Pharma is currently on an impressive 8-day green streak, with no closing in the red since Monday, August 5, 2024. This suggests a strong positive momentum.
- Returns: During this period, Mankind Pharma has delivered a 5.93% return. This means that an investment of ₹10,000 would have grown to ₹10,592.99.
- Financial Insight: Over the past year, Mankind Pharma has generated a revenue of ₹10,649.57 Crore and a profit of ₹1,962.51 Crore, demonstrating its solid financial performance.
- As of Friday, August 16, 2024, Mankind Pharma has a Market Capital of ₹85,581.64 Crore, highlighting its considerable size and potential.
- Summary: Mankind Pharma is exhibiting a strong bullish pattern. While past performance isn’t always indicative of future results, the recent trend suggests potential for continued growth. Investors may want to closely monitor its price movements for both short-term and long-term opportunities. Checkout Mankind Pharma Target for Tomorrow and Mankind Pharma Targets for 2024 & 2025 to explore potential price targets.
Mankind Pharma Financial Performance
| Metric | Value | Description |
|---|---|---|
| Market Capital | 85,581.64 Crore | Market valuation of Mankind Pharma’s shares. |
| Revenue (TTM) | 10,649.57 Crore | Total revenue generated by Mankind Pharma over the past twelve months. |
| Net Income (TTM) | +1,962.51 Crore | Net Profit or Loss after all the expenses over the past twelve months. |
| Operating Margin | 19.83% | Income from operations as a percentage of revenue, before taxes and interest. |
| Profit Margin | 18.42% | Net income as a percentage of revenue, after all expenses. |
| Revenue Growth (Quarterly) | +12.2% | Change in revenue compared to the previous quarter. |
| Earnings Growth (YOY Quarterly) | +10.19% | Change in earnings compared to the same quarter last year. |
| Debt-to-Equity (D/E) Ratio | 2.16 | Company’s total debt divided by total shareholder equity. |
| Total Debt | 207.17 Crore | Sum of Mankind Pharma’s current & long-term financial obligations. |
| Total Cash | 3,386.49 Crore | Total amount of liquid funds available to Mankind Pharma. |
➲ Elgi Equipments (Bearish Trend)
- Performance Overview: Over the past 25 trading days, Elgi Equipments has closed lower 17 times and higher 8 times.
- Recent Trend: Elgi Equipments has been on a downward trend for the past 7 trading days, closing lower each day since Tuesday, August 6, 2024.
- Returns: If you had invested ₹10,000 in Elgi Equipments over the past 25 trading sessions, your investment would have decreased by 16.35% to ₹8,365.
- Financial Insight: Over the past 12 months, Elgi Equipments has generated a revenue of ₹3,294.94 Crore and a profit of ₹324.25 Crore.
- As of Friday, August 16, 2024, Elgi Equipments has a Market Capital of ₹20,015.91 Crore.
- Summary: Elgi Equipments is currently experiencing a bearish trend. Keep an eye on its performance, especially in the coming days. You can find potential targets for tomorrow and for the rest of 2024 and 2025 using the links below. Elgi Equipments Target for Tomorrow and Elgi Equipments Targets for 2024 & 2025.
Elgi Equipments Financial Performance
| Metric | Value | Description |
|---|---|---|
| Market Capital | 20,015.91 Crore | Market valuation of Elgi Equipments’s shares. |
| Revenue (TTM) | 3,294.94 Crore | Total revenue generated by Elgi Equipments over the past twelve months. |
| Net Income (TTM) | +324.25 Crore | Net Profit or Loss after all the expenses over the past twelve months. |
| Operating Margin | 11.84% | Income from operations as a percentage of revenue, before taxes and interest. |
| Profit Margin | 9.84% | Net income as a percentage of revenue, after all expenses. |
| Revenue Growth (Quarterly) | +10.7% | Change in revenue compared to the previous quarter. |
| Earnings Growth (YOY Quarterly) | +20.39% | Change in earnings compared to the same quarter last year. |
| Debt-to-Equity (D/E) Ratio | 39.6 | Company’s total debt divided by total shareholder equity. |
| Total Debt | 638.05 Crore | Sum of Elgi Equipments’s current & long-term financial obligations. |
| Total Cash | 739.48 Crore | Total amount of liquid funds available to Elgi Equipments. |
| Beta | 0.65 | Beta is less than 1 indicating that the Elgi Equipments’s price is less volatile than the market. |
Top Stocks That Created a New All Time High Today
Top Large Cap Stocks That Created a New All Time High Today
Companies with Market Capital more than 20,000 Crores| Stock | Close | New All-Time High (ATH) | Previous ATH | Previous ATH Date |
|---|---|---|---|---|
| CDSL | 2804.00 (+9.5%) | 2812.00 (+32.72%) | 2118.60 | Tue 23 Apr 2024 |
| Colgate Palmolive | 3536.00 (+1.94%) | 3540.85 (+25.78%) | 2814.89 | Wed 03 Apr 2024 |
| Coromandel International | 1759.75 (+4.28%) | 1780.00 (+%) | Thu 01 Jan 1970 | |
| Glaxosmithkline | 2905.85 (+2.97%) | 2961.19 (+%) | Thu 01 Jan 1970 | |
| Glenmark Pharma | 1562.00 (+4.74%) | 1576.00 (+%) | Thu 01 Jan 1970 |
Top Mid Cap Stocks That Created a New All Time High Today
Companies with Market Capital between 5,000 Crores to 20,000 Crores| Stock | Close | New All-Time High (ATH) | Previous ATH | Previous ATH Date |
|---|---|---|---|---|
| Eris Lifesciences | 1209.55 (+2.9%) | 1225.00 (+%) | Thu 01 Jan 1970 | |
| Ethos | 3400.00 (+8.3%) | 3428.05 (+%) | Thu 01 Jan 1970 | |
| Gravita India | 2216.55 (+13.96%) | 2309.00 (+%) | Thu 01 Jan 1970 | |
| Inox Wind Energy | 11077.65 (+4.99%) | 11077.65 (+51.45%) | 7314.00 | Tue 27 Feb 2024 |
| Marksans Pharma | 209.00 (-2.49%) | 219.50 (+22.42%) | 179.30 | Wed 03 Jan 2024 |
Top Small Cap Stocks That Created a New All Time High Today
Companies with Market Capital less than 5,000 Crores| Stock | Close | New All-Time High (ATH) | Previous ATH | Previous ATH Date |
|---|---|---|---|---|
| Betex India | 359.95 (+7.68%) | 385.00 (+%) | Thu 01 Jan 1970 | |
| Bits | 7.91 (+1.93%) | 7.91 (+%) | Thu 01 Jan 1970 | |
| Ceenik Exports | 1214.84 (+1.99%) | 1214.84 (+137.64%) | 511.20 | Wed 24 Apr 2024 |
| Delton Cables | 641.90 (+1.84%) | 642.00 (+%) | Thu 01 Jan 1970 | |
| E2E Networks | 2060.89 (+4.99%) | 2060.89 (+79.03%) | 1151.09 | Wed 24 Apr 2024 |